
Building a Price Action Strategy and Trading Plan
JustWolves is an educational platform and is not a SEBI-registered investment advisor. Trading financial instruments involves significant risk of loss and may not be suitable for all investors. Past performance is not indicative of future results. Read our full disclaimer →
What you'll learn
- A strategy is a set of written rules specific enough that two people would take the same trades
- Define the market, timeframes, setup, trigger, stop, target and position size
- Start with one setup in one market; add others only after testing
- A trading plan wraps the strategy with risk limits, a routine and a review process
- Rules you can't follow consistently aren't rules; simplify until you can
In this article · 16 sections
Knowing price action concepts is not the same as having a strategy. A strategy turns concepts into rules: which market, which setup, what must happen before entry, where the stop goes and how much to risk. This lesson walks through building one price action strategy from the ground up, then wrapping it in a trading plan you can follow and review.
What You Will Learn
- The components of a written strategy
- How to write rules that are specific enough to test
- A complete example price action strategy
- How a trading plan wraps a strategy
Before You Start
Read Price Action Entry Triggers and Confluence, Position Sizing and Risk-Reward Ratio first.
What Makes a Strategy
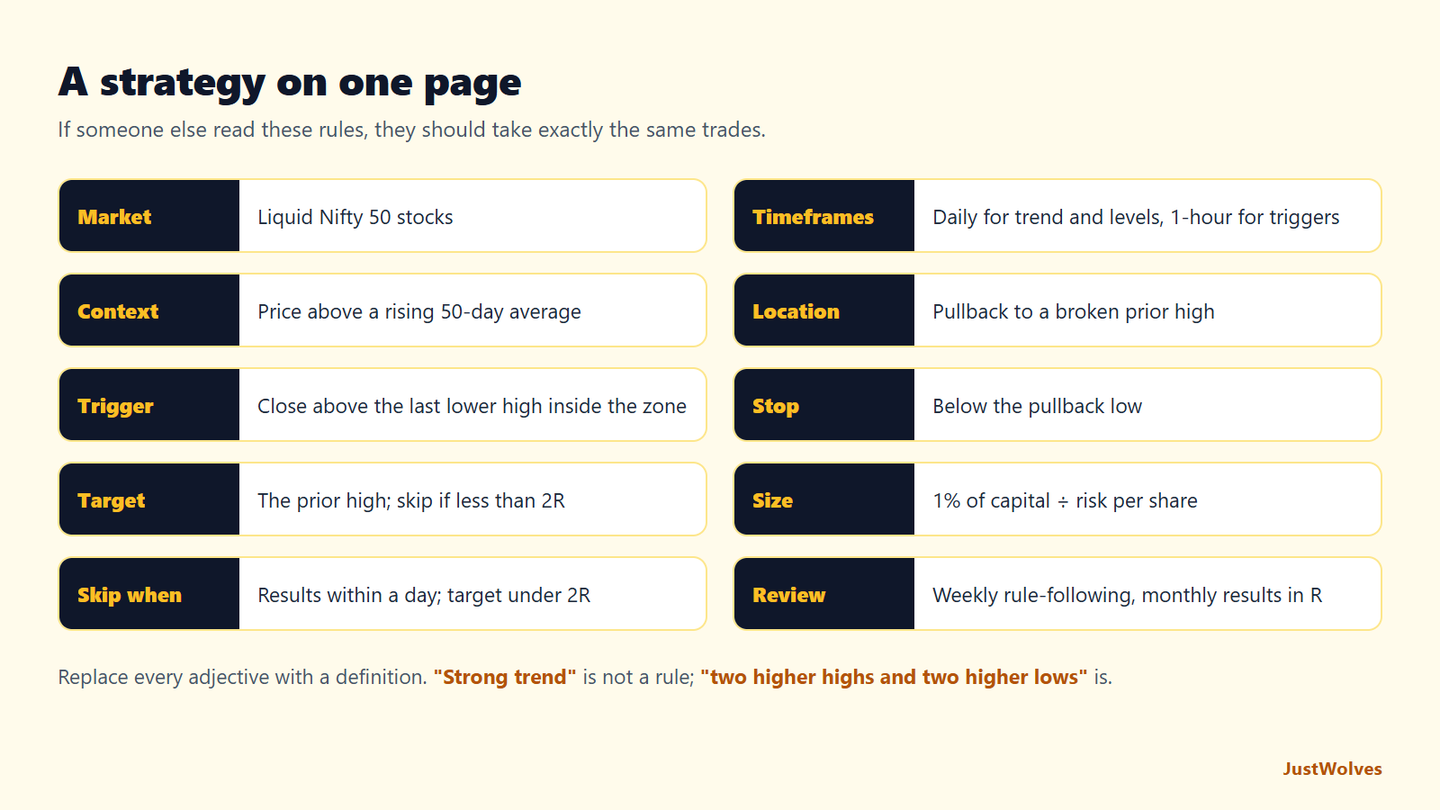
A useful test: could someone else read your rules and take exactly the same trades you would? If the answer depends on 'feel', the rules aren't finished. Specific rules can be tested, reviewed and improved; vague ones can't.
| Component | Question it answers | Example |
|---|---|---|
| Market | What do I trade? | Nifty 50 stocks with high liquidity |
| Timeframes | Which charts? | Daily for trend and levels; 1-hour for triggers |
| Context | When is the setup allowed? | Daily higher highs and higher lows; price above a rising 50-day MA |
| Location | Where? | Pullback to a prior resistance level, now support |
| Trigger | When exactly? | 1-hour close above the last lower high inside the zone |
| Stop | Where am I wrong? | Below the pullback low, with a small buffer |
| Target | Where do I take profit? | The prior swing high; minimum 2R or skip |
| Size | How much? | Risk 1% of capital per trade |
Writing Testable Rules
- Replace adjectives with definitions: not 'a strong trend' but 'two higher highs and two higher lows on the daily chart'.
- Name the level type: not 'support' but 'a prior swing high that price has closed above'.
- Define the trigger candle: not 'bullish price action' but 'a 1-hour candle closing above the last lower high'.
- Write the skip conditions: for example, no trades within a day of quarterly results, or when the target is less than 2R away.
A Complete Example
Daily pullback strategy (illustrative rules)
Step 1: Scan
Each evening, list Nifty 50 stocks in daily uptrends above a rising 50-day MA.
Step 2: Mark
For each, mark the nearest prior resistance that price has broken and closed above.
Step 3: Wait
Set alerts at those levels. Do nothing until price pulls back into the zone.
Step 4: Trigger
On the 1-hour chart, enter when a candle closes above the last lower high inside the zone.
Step 5: Risk
Stop below the pullback low; size for 1% risk; skip if the prior high is under 2R away.
Step 6: Manage
Exit at the prior high, or on a daily close below the zone.
Real Case: The Strategy on a Live Chart from the Past
The chart below applies the example strategy, rule by rule, to real daily candles for ICICI Bank from March and April 2025. Every number in the trade comes from the written rules: the level, the trigger, the stop, the 2R filter and the position size.
Real case: the example strategy on ICICI Bank, March–April 2025
Step 1 of 5
Scan and mark
ICICI Bank is in a daily uptrend above a rising 50-day average. On 19 March it closes above a swing high of 1,280.5 from 4 February, then rallies to 1,373. The broken high, drawn about 1% either side, goes on the list with an alert.
- What to observe
- Rule 1 and Rule 2 of the strategy met: trend and a broken level.
- Condition
- Do nothing until price returns to the zone.
Practical Example
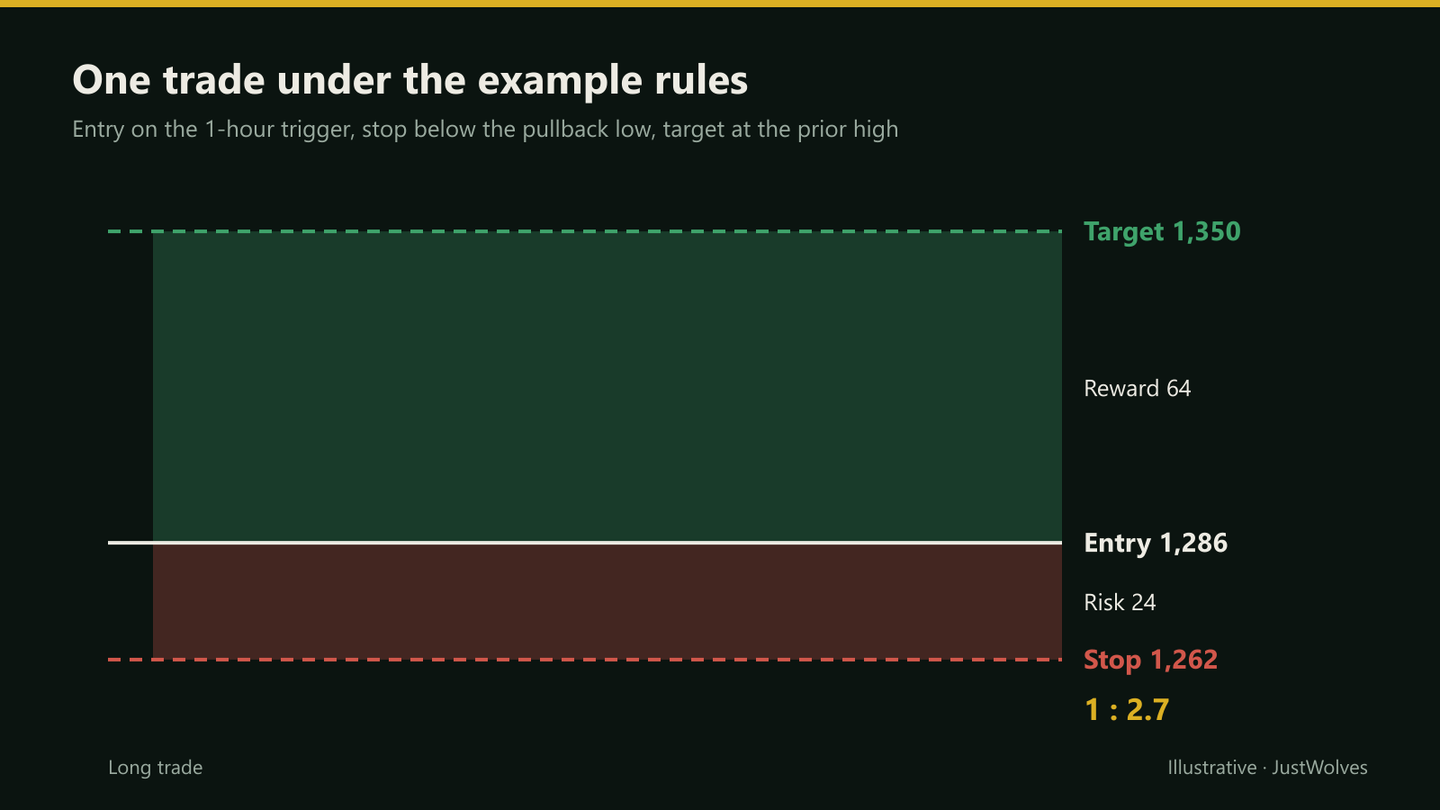
Hypothetically, Sneha has ₹5,00,000 of trading capital and risks 1% (₹5,000) per trade. An FMCG stock is in a daily uptrend and pulls back to ₹1,270–₹1,285, a broken resistance level. On the 1-hour chart, a candle closes at ₹1,286 above the last lower high.
Her stop goes below the pullback low at ₹1,262, so risk is ₹24 per share. Position size is ₹5,000 ÷ ₹24 ≈ 208 shares. The prior high at ₹1,350 is ₹64 away, about 2.7R, which passes her 2R filter. She logs the trade before entering.
Testing the Example Strategy: Our Backtest
JustWolves coded the example strategy's rules and ran them on about two years of real daily data for 20 large NSE stocks. Because only daily data was used, the trigger was a daily close above the previous day's high, rather than the 1-hour trigger in the written rules.
Rules: price above a rising 50-day average; a swing high broken by a close within the last 20 days; a pullback into a zone around that level; a close above the previous day's high; stop below the last three lows; target the high made since the breakout; skip unless the target is at least 2R. Costs were estimated at 0.25% of the price per round trip.
| Group | Trades | Winners | Average per trade |
|---|---|---|---|
| Taken (target at least 2R) | 8 | 50% | +0.89R (+0.75R after costs) |
| Skipped by the 2R rule, if they had been taken | 154 | 61% | −0.08R |
Two lessons come out of this, and both are more important than the headline numbers.
The 2R filter did its job. The 154 setups it rejected won more often (61%) but made less per win, and lost money on average. Those were setups where the nearest target was close, so the reward could not cover the losses.
Eight trades in two years is not enough to judge anything. Four winners and four losers could easily have been one winner and seven losers with a little bad luck. A written strategy with a strict filter on 20 stocks produced very few trades, which means you would need many more markets, a longer history, or a lower timeframe to gather a meaningful sample. This is exactly why the next lesson stresses sample size, and why every strategy should be tested before it is traded.
From Strategy to Trading Plan
A trading plan wraps one or more strategies with the rules that protect the account and keep you consistent:
- Risk limits: per trade, per day and per week, and a maximum number of open positions.
- Routine: when you scan, when you place alerts, and when you're not allowed to trade.
- Journal: what you record for every trade, including screenshots.
- Review: a weekly check of rule-following and a monthly check of results.
Include Costs in Your Plan
Costs turn a small edge into no edge. For delivery trades in Indian stocks, the main costs are securities transaction tax (STT), exchange and SEBI charges, GST on brokerage and charges, stamp duty, brokerage (zero at many discount brokers for delivery) and DP charges on selling. Together they often come to roughly 0.1% to 0.25% of the trade value per round trip, before slippage.
Convert costs into R, because that is how your results are measured. In the ICICI Bank example, 0.25% of 1,311.7 is about 3.3 rupees per share, against a risk of 29.8: about 0.11R per trade. A strategy averaging +0.2R before costs keeps only about half its edge. Tight stops make costs larger in R, which is one more reason not to make stops too small.
| Stop distance | Cost per share | Cost in R |
|---|---|---|
| ₹10 (1%) | ₹2.50 | 0.25R |
| ₹20 (2%) | ₹2.50 | 0.13R |
| ₹40 (4%) | ₹2.50 | 0.06R |
Practise on a Real Chart
Apply your written rules to the real chart below, scrolling from left to right without looking ahead. Log every setup your rules allow, including the ones you would rather skip, and calculate each one in R. If two people using your rules would mark different trades, the rules need more detail.
Practice chart: NIFTY 50 daily
Loading historical candles…
Common Mistakes
- Rules full of judgment words like 'strong' and 'clean'.
- Too many setups before any is tested.
- Changing rules after every loss.
- No skip conditions, so every level becomes a trade.
- Ignoring costs such as brokerage, STT and slippage.
Professional Insight
Professional trading desks often describe their edge less in terms of clever setups and more in terms of consistency: the same process, applied the same way, reviewed honestly. A modest strategy followed well usually beats a sophisticated one followed loosely.
Risk Considerations
- Any strategy has losing streaks; size so you can survive them.
- Market conditions change; a strategy that suits trends may struggle in ranges.
- Untested strategies carry unknown risk.
Important Terminology
| Term | Meaning |
|---|---|
| Strategy | A set of specific rules for one type of trade. |
| Trading plan | Strategies plus risk limits, routine and review. |
| Skip condition | A rule for when not to take a setup. |
| R | The amount risked on a trade, used as a unit. |
| Rule-following rate | The share of trades taken exactly as the rules say. |
What is a price action strategy?
A written set of rules for trading one type of price action setup, covering market, timeframe, entry, stop, target and size.
How do I create my own trading strategy?
Choose one setup you understand, write each rule precisely, define skip conditions, then test it on past charts before using real money.
What is the difference between a strategy and a trading plan?
A strategy covers one setup; a trading plan includes your strategies plus risk limits, routine, journal and review.
How many setups should a beginner trade?
Usually one, until it's tested and followed consistently.
How much should I risk per trade?
Many traders use 0.5% to 2% of capital; the Risk Management course explains how to choose.
How many trades does a strategy need before I can judge it?
Many more than most people expect. In our backtest of this lesson's exact rules, 20 NSE stocks over two years produced only 8 qualifying trades, which is not enough to tell skill from luck. Aim for at least 50 to 100 trades, using more markets or a longer history if needed.
Is a 2R minimum reward filter worth using?
In our backtest, setups rejected by the 2R filter won more often but lost money on average (−0.08R), because their targets were too close. The filter removed trades whose reward could not cover their losses.
Practical Exercise
Write your first strategy.
Your task
Step 1: Fill the table
Answer every row of the components table for one setup.
Step 2: Remove adjectives
Replace every judgment word with a definition.
Step 3: Add skip conditions
At least three.
Step 4: Test the wording
Ask someone else to mark trades from your rules on the same chart and compare.
Check Your Understanding
A good strategy rule is:
Related Lessons
Previous: Best Indicators for Price Action Traders. Next: Price Action Case Studies and Backtesting. See also Trading Plan.