
Best Indicators for Price Action Traders
JustWolves is an educational platform and is not a SEBI-registered investment advisor. Trading financial instruments involves significant risk of loss and may not be suitable for all investors. Past performance is not indicative of future results. Read our full disclaimer →
What you'll learn
- Indicators should each answer a different question; several momentum oscillators repeat the same one
- Zig Zag marks swing highs and lows, but its last leg can change (repaint)
- ADX measures trend strength, not direction; 20–25 is a common threshold between ranging and trending
- ATR measures volatility and is widely used to size stops, for example 1.5 to 2 × ATR
- Pivot Points Standard plots levels from the previous period's high, low and close
In this article · 17 sections
Price action traders don't need indicators, but a few can make specific jobs easier: marking swings, judging whether a market is trending, sizing stops to volatility and plotting reference levels. This lesson covers five free indicators built into most charting platforms that each answer a different question, with their default settings, how to use them alongside price action, and where they mislead.
What You Will Learn
- How to choose indicators that complement each other
- Zig Zag, ADX, ATR, Pivot Points Standard and the Alligator
- Their default settings and main uses
- Their limitations
Before You Start
Read Price Action Entry Triggers and Confluence first.
One Question per Indicator
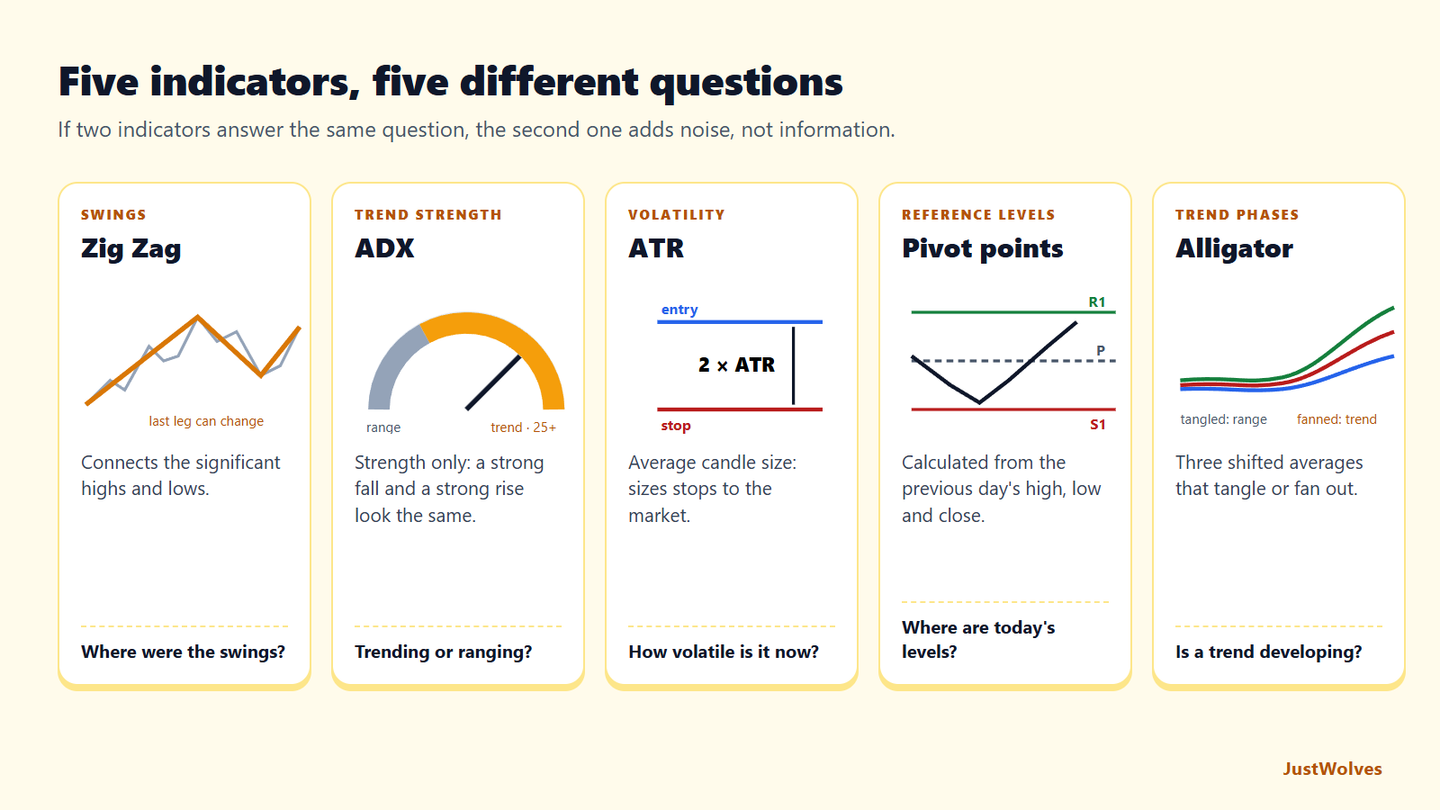
Indicators are calculations on price (and sometimes volume). If two indicators answer the same question, such as 'is momentum strong?', the second one adds noise rather than information. The five below were chosen because each answers a different question.
| Indicator | Question it answers |
|---|---|
| Zig Zag | Where were the significant swings? |
| ADX | Is the market trending or ranging? |
| ATR | How volatile is the market right now? |
| Pivot Points Standard | Where are today's reference levels? |
| Alligator | Is a trend developing, and when is price pulling back? |
Zig Zag: Marking Swings
Zig Zag connects significant highs and lows, ignoring moves smaller than a set percentage (the deviation) or fewer than a set number of bars (the depth). It's a quick way to see the swing structure and to choose which highs and lows to connect with trendlines.
Its key limitation: the most recent leg isn't final. Until price reverses by the deviation amount, the last swing point can move. Never treat the latest Zig Zag point as a confirmed swing.
ADX: Trend Strength
The Average Directional Index (ADX), measures how strongly price is trending, on a 0–100 scale, with a default period of 14. It does not show direction: a strong downtrend and a strong uptrend can both have a high ADX.
Many traders treat an ADX below about 20–25 as a ranging market and above it as trending. Used this way, it's a filter: favour trend-following setups when ADX is high and rising, and range tactics when it's low.
ATR: Volatility and Stops
The Average True Range (ATR), measures the average size of each period's range, including gaps, over 14 periods by default. It's expressed in price units: an ATR of ₹12 means the stock has recently moved about ₹12 per candle.
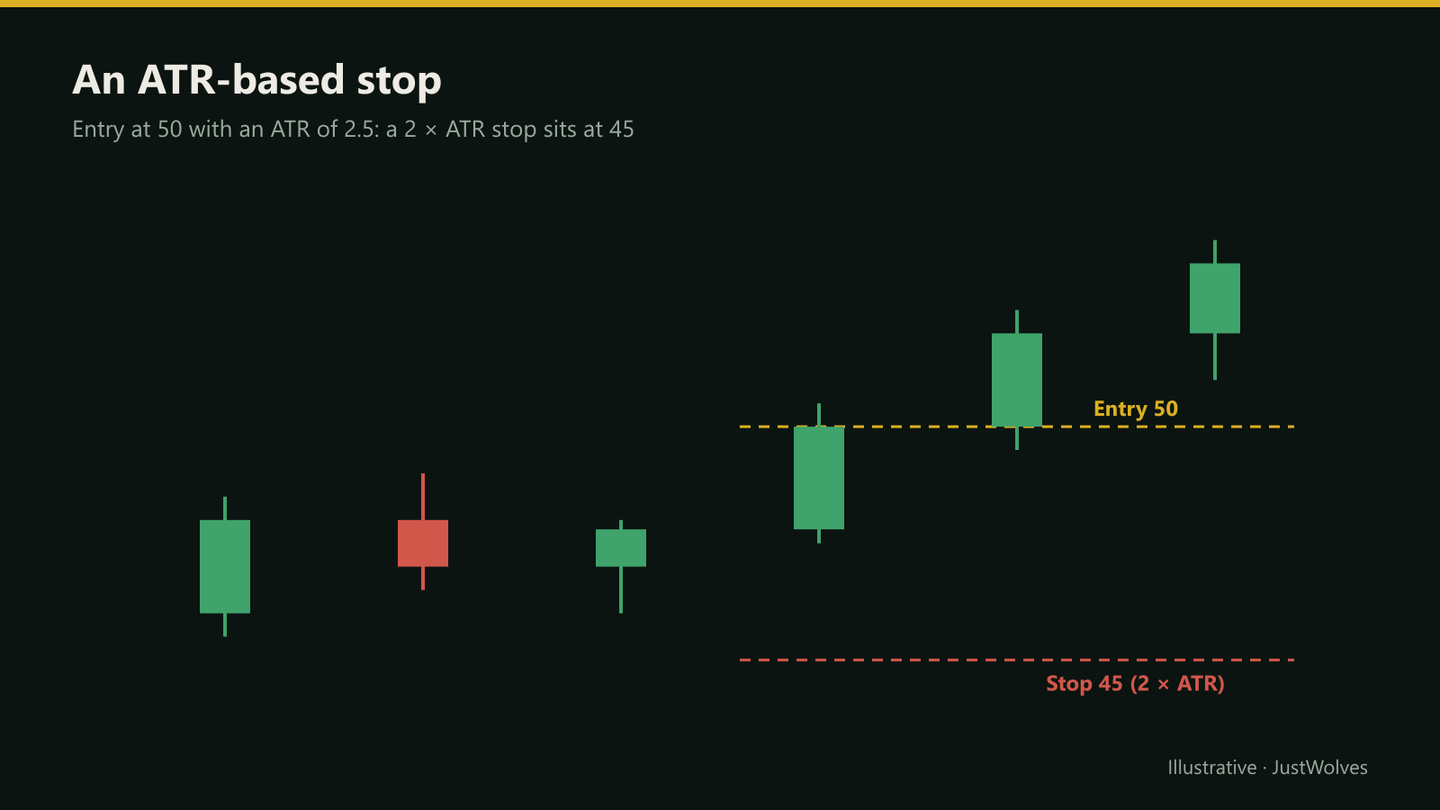
Its most common use is stop sizing. Instead of a fixed distance, the stop is placed a multiple of ATR from entry, commonly 1.5 to 2 × ATR, so it widens in volatile markets and tightens in quiet ones. Combine this with structure: the stop should also sit beyond a meaningful swing.
Real Case: ADX and ATR on NIFTY 50
The chart below uses real NIFTY 50 daily candles from late September to mid-November 2026, with ADX and ATR values calculated by JustWolves. Step through it to see two lessons at once: ADX stayed high through both a fall and a rally, because it measures strength, not direction; and ATR nearly doubled, which changes what a sensible stop and position size look like.
Real case: ADX and ATR on NIFTY 50, September–November 2026
Step 1 of 4
A strong downtrend: high ADX
In late September NIFTY 50 falls steadily. ADX(14) rises from about 30 to 37, above the common 25 threshold: the market is trending. ATR(14) is about 190–210 points.
- What to observe
- High ADX in a falling market.
- Condition
- ADX says "trending", not "up" or "down".
Pivot Points Standard: Reference Levels
Pivot Points Standard plots the classic floor-trader levels calculated from the previous period's high (H), low (L) and close (C): P = (H + L + C) ÷ 3, R1 = 2P − L, S1 = 2P − H, R2 = P + (H − L), S2 = P − (H − L). On most charting platforms, choose the timeframe the levels are based on (daily for intraday trading, weekly or monthly for swing trading). The Pivot Points lesson covers how to trade them.
Alligator: Trend Phases
The Alligator uses three smoothed moving averages shifted forward in time. Common default settings: the Jaw is a 13-period average shifted 8 bars, the Teeth an 8-period average shifted 5 bars, and the Lips a 5-period average shifted 3 bars.
When the lines are tangled together, the market is usually ranging (the Alligator is 'sleeping'). When they fan out in order, with price on one side, a trend is developing. Some traders use pullbacks toward the lines during a fanned-out phase as entry areas, which is a moving-average version of the pullback approach.
What ADX and ATR Really Do: Our Test
JustWolves tested the two most practical indicators in this lesson on real data: about two years of daily candles for NIFTY 50, EUR/USD, GBP/USD, USD/JPY, gold and 20 large NSE stocks, with short trades tested on mirrored prices.
ADX as a trend filter. We took every close above the previous 20-day high (a breakout, the kind of setup a trend filter is meant to help) and grouped it by the ADX(14) reading the day before. We measured where price was ten days later, in units of ATR.
| ADX before the breakout | Breakouts | Higher 10 days later | Average move |
|---|---|---|---|
| Above 25 | 554 | 48% | −0.01 ATR |
| 20 to 25 | 280 | 50% | −0.17 ATR |
| Below 20 | 527 | 50% | −0.16 ATR |
Breakouts when ADX was above 25 lost a little less on average, but none of the groups was profitable and the share that moved higher was the same. ADX describes whether the market has been trending; it did not tell us which breakouts would follow through.
ATR for stop distance. For a random entry on every third candle, we measured how often a stop placed a given multiple of ATR below the entry was touched within the next five candles.
| Stop distance | 1H charts | Daily charts |
|---|---|---|
| 0.5 × ATR | 70% | 73% |
| 1 × ATR | 46% | 47% |
| 1.5 × ATR | 30% | 32% |
| 2 × ATR | 20% | 19% |
| 3 × ATR | 9% | 8% |
This table is one of the most useful in the course. A stop half an ATR away was hit within five candles about seven times in ten, from a random entry with no edge either way. That is simply normal movement. At 1.5 to 2 × ATR, the common range this lesson recommends, normal noise touched the stop only 20–30% of the time. The numbers were almost identical on hourly and daily charts, which is exactly why ATR is useful: it scales the stop to the market's own movement.
Practical Example
Hypothetically, a swing trader studies a pharma stock. Zig Zag (5% deviation) shows rising swing lows. ADX(14) is 31 and rising, suggesting a trend. Price pulls back to a prior resistance level at ₹1,610, near the Alligator's lines.
A bullish engulfing candle closes at ₹1,628. ATR(14) is ₹22, so a 2 × ATR stop is ₹44 below entry, at ₹1,584, which is also below the pullback low of ₹1,598. The target is the prior high at ₹1,720: ₹44 of risk for ₹92 of reward.
Practise on a Real Chart
Open the real chart below on the daily timeframe. Using the ATR value from your own charting platform, mark where a 2 × ATR stop would sit under three recent swing lows, and compare it with a stop just below each swing. Then label the trending and ranging stretches by eye and check whether ADX agreed with you, as the practical exercise suggests.
Practice chart: NIFTY 50 daily
Loading historical candles…
Common Mistakes
- Stacking indicators that answer the same question.
- Reading ADX as direction.
- Trusting the last Zig Zag leg as a confirmed swing.
- Using ATR alone for stops, ignoring structure.
- Optimising settings until they fit past charts.
Professional Insight
Many experienced price action traders keep their charts nearly clean: price, a few marked levels and perhaps one or two tools such as ATR for stops. Indicators earn their place when they make a specific, repeated decision faster or more consistent.
Risk Considerations
- Lag: signals arrive after the move starts.
- Ranges produce false trend readings.
- Defaults are conventions, not optimised values.
Important Terminology
| Term | Meaning |
|---|---|
| Zig Zag | Connects swings larger than a set deviation. |
| Repaint | When an indicator's recent values change after the fact. |
| ADX | Average Directional Index: trend strength, not direction. |
| ATR | Average True Range: average candle range including gaps. |
| Alligator | Three shifted smoothed MAs showing trend phases. |
What are the best indicators for price action beginners?
Start with very few. ATR for stop sizing and ADX as a trend filter answer two common questions without cluttering the chart.
Does the Zig Zag indicator repaint?
Yes. Its most recent leg can change until price reverses by the set deviation, so treat only completed swings as confirmed.
What ADX value means a trend?
Many traders use about 20–25 as the threshold: below suggests ranging, above suggests trending. It's a convention, not a fixed rule.
How do I use ATR for a stop loss?
Place the stop a multiple of ATR, commonly 1.5 to 2 times, from your entry, and check that it also sits beyond a meaningful swing.
What are the default Alligator settings?
Jaw 13 shifted 8, Teeth 8 shifted 5, Lips 5 shifted 3, using smoothed moving averages.
Does a high ADX mean a breakout will work?
Not in our data. Across two years of daily data for five markets and 20 NSE stocks, 20-day breakouts with ADX above 25 moved higher over ten days 48% of the time, about the same as breakouts with low ADX.
How far should an ATR stop be?
In our data, a stop half an ATR from a random entry was touched within five candles about 70% of the time, while a 2 × ATR stop was touched about 20% of the time. Most traders use 1.5 to 2 × ATR, placed beyond a meaningful swing.
Practical Exercise
Test one indicator's job.
Your task
Step 1: Pick ADX(14)
On a daily chart of Nifty or a liquid stock.
Step 2: Mark periods
Label sections as trending or ranging by eye first.
Step 3: Compare
Did ADX above and below 25 match your labels?
Step 4: Repeat for ATR
Compare 2 × ATR stops with your structural stops on ten past setups.
Check Your Understanding
ADX tells you:
Related Lessons
Previous: Price Action Entry Triggers and Confluence. Next: Building a Price Action Strategy and Trading Plan. See also Stop-Loss.