
Reversals, Momentum and Exhaustion: When Trends Run Out
JustWolves is an educational platform and is not a SEBI-registered investment advisor. Trading financial instruments involves significant risk of loss and may not be suitable for all investors. Past performance is not indicative of future results. Read our full disclaimer →
What you'll learn
- Momentum is how fast and far price moves; you can read it from candle size, swing length and pullback depth
- Exhaustion shows as shrinking pushes, longer wicks against the trend and deeper pullbacks
- Exhaustion is a warning, not a signal; trends can weaken for a long time before they turn
- A reversal is confirmed when price breaks the last swing that defined the trend
- The safer reversal entry is the first pullback after the break, not the exact top or bottom
In this article · 17 sections
Every trend ends eventually, and catching the turn is one of the most tempting ideas in trading. It's also one of the most expensive: most attempts to pick an exact top or bottom are early. This lesson shows how to read momentum directly from price, how exhaustion tends to look as a trend weakens, and how to wait for structural confirmation before treating a turn as a reversal.
What You Will Learn
- How to read momentum from price action
- Common signs of exhaustion
- How a reversal is confirmed by structure
- Lower-risk ways to trade a reversal
Before You Start
Read Pullbacks and Retracements and Swing Highs and Swing Lows first.
Reading Momentum from Price
Momentum describes how forcefully price is moving. You don't need an indicator to see it; price shows it directly:
- Candle size: large bodies in the trend's direction, small ones against it.
- Swing length: each push in the trend's direction travels about as far as, or further than, the last.
- Pullback depth: pullbacks stay shallow.
- Closes: candles close near their extremes in the trend's direction.
Signs of Exhaustion
Exhaustion is what it looks like when a trend runs short of fuel. Common signs in an uptrend:
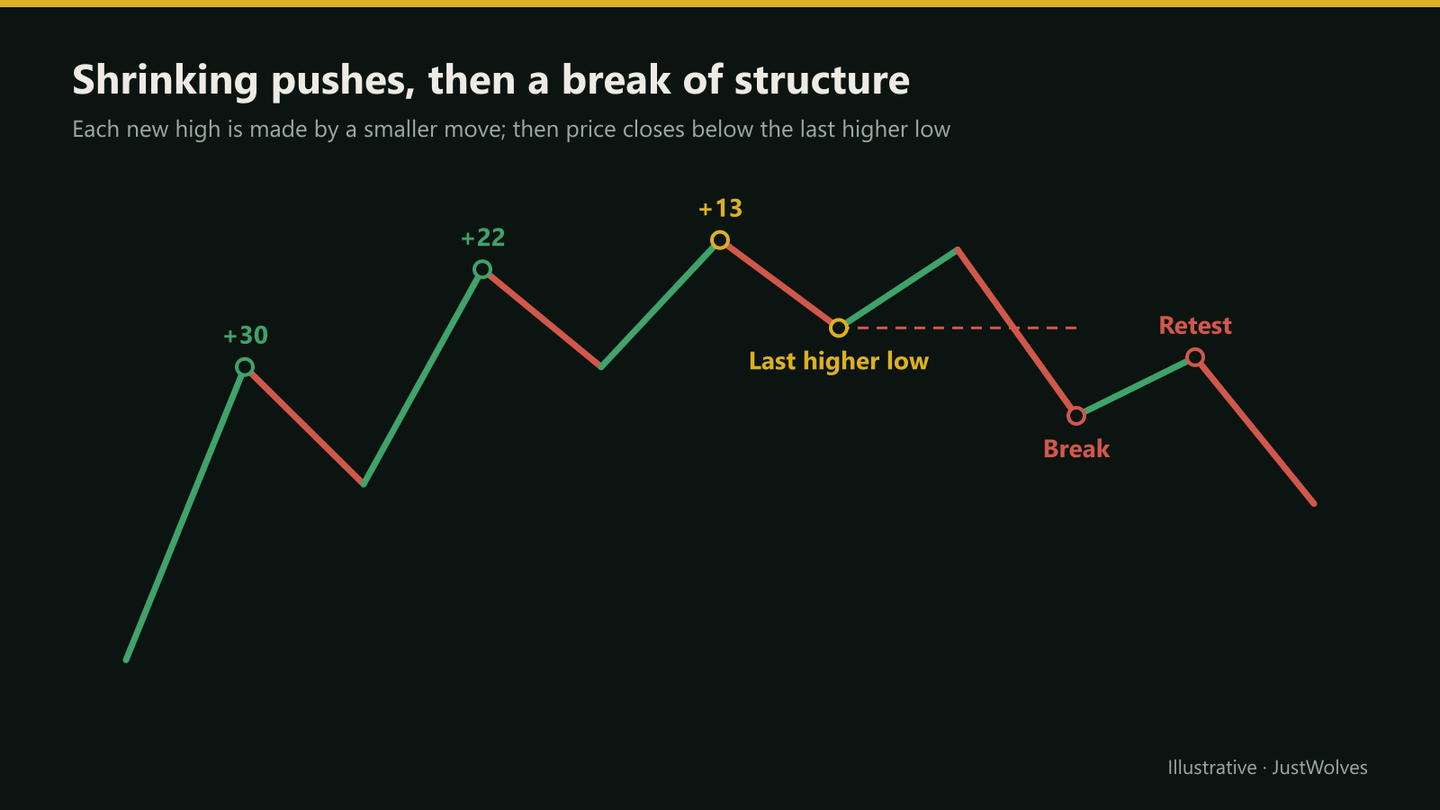
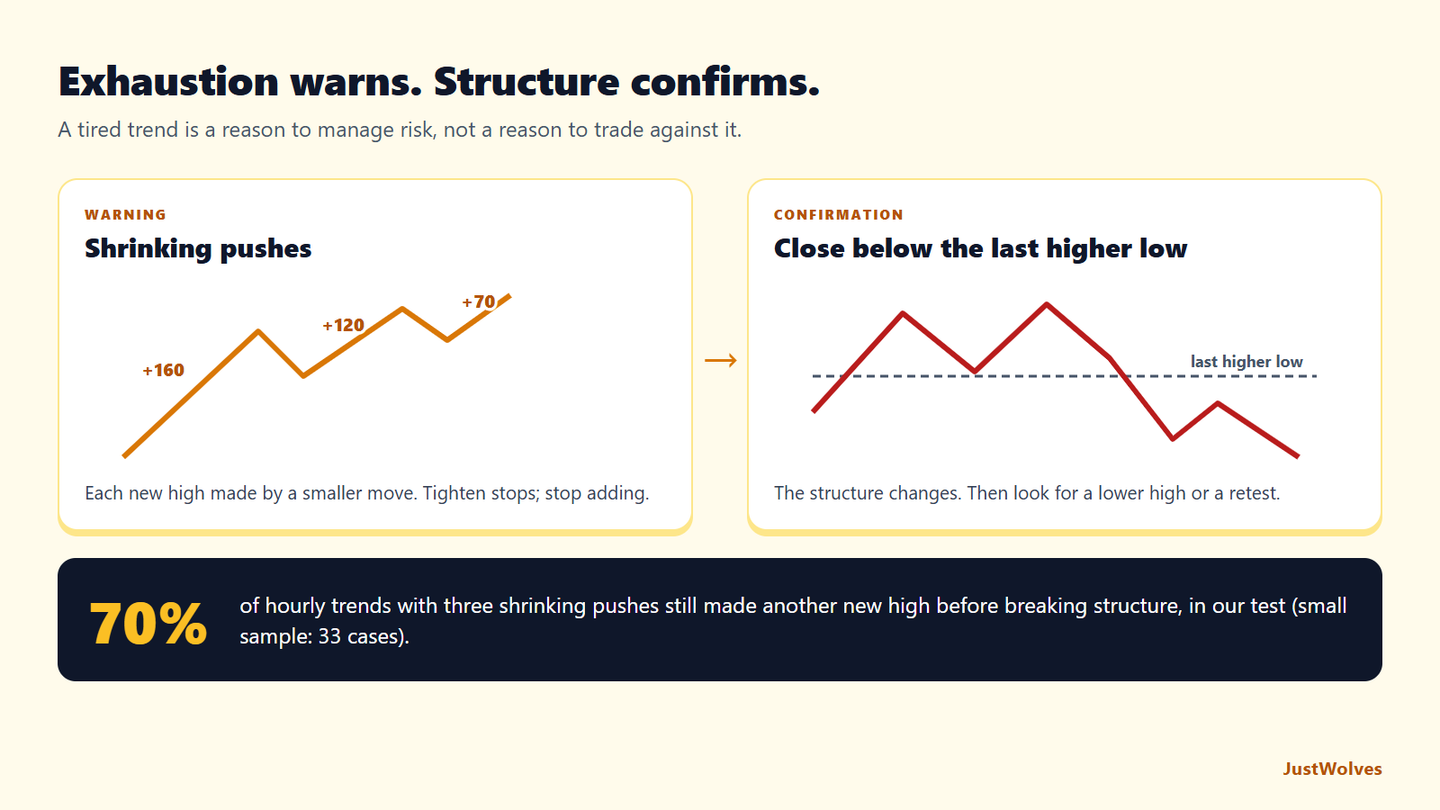
- Shrinking pushes: each new high is made by a smaller move than the last.
- Long upper wicks at new highs: buyers push up, sellers push back.
- Deeper pullbacks that retrace more of each move.
- A climactic candle: an unusually large candle, often on high volume, after a long run, followed by no follow-through.
Confirming a Reversal
In an uptrend, the structure is a sequence of higher highs and higher lows. The trend is intact as long as the last higher low holds. A close below it is a break of structure: the first objective evidence that the uptrend may be over.
Stronger confirmation comes when price then makes a lower high on the next bounce. At that point the sequence has changed from up to down. Check the higher timeframe too: a break on the hourly chart inside a strong daily uptrend is more likely to be a pullback than a lasting reversal.
From Exhaustion to Reversal
The chart below follows the practical example in this lesson. Step through it to see the three shrinking pushes, the line that decides the trend, the break, and the retest entry.
Shrinking pushes, a structure break and a retest
Step 1 of 5
Three pushes, each smaller
The stock rises in three pushes: 1,200 to 1,360 (160), 1,320 to 1,440 (120) and 1,410 to 1,480 (70). The last high has a long upper wick. Momentum is fading.
- What to observe
- Shrinking pushes and a wick at the high.
- Condition
- A warning to manage longs, not a reason to short.
Real Case: A NIFTY 50 Reversal Without a Retest
The chart below uses real NIFTY 50 hourly candles from July 2026. It shows shrinking pushes, a structure break, and the kind of sharp follow-through that leaves no retest entry.
Real case: shrinking pushes, a break and no retest, NIFTY 50 hourly, July 2026
Step 1 of 5
Three pushes, each smaller
Between 2 and 7 July 2026, NIFTY makes three hourly pushes to new highs of about 395, 206 and 148 points. The last high is 24,530 on 7 July. Momentum is fading.
- What to observe
- Shrinking pushes: a warning.
- Condition
- Manage longs; do not short yet.
Ways to Trade a Reversal
| Approach | Entry | Trade-off |
|---|---|---|
| Anticipate | At the suspected top on exhaustion signs | Best price; lowest probability; many false starts |
| Break | On the close below the last higher low | Confirmed by structure; stop is wide |
| Retest | On the first pullback after the break (the lower high) | Clear invalidation; may be missed if there's no pullback |
Do Shrinking Pushes Predict Reversals? Our Test
JustWolves tested the best-known exhaustion sign, shrinking pushes, on about six months of real 1H candles for NIFTY 50, EUR/USD, GBP/USD, USD/JPY and gold, with downtrends tested on mirrored prices. We found every sequence of three higher highs with rising lows between them (five-candle swing points), and split them into sequences where each push was smaller than the last and all others. Then we checked which came first: a close below the last higher low (a structure break) or another new high.
| Push pattern | Cases | Structure broke first | New high first |
|---|---|---|---|
| Each push smaller than the last | 33 | 27% | 70% |
| All other three-push sequences | 265 | 45% | 54% |
The result runs against the usual story. Trends with three shrinking pushes went on to make another new high 70% of the time, more often than other trends, not less. The sample is small, so we would not claim shrinking pushes are bullish. But there is no sign that they predict a reversal.
That makes this lesson's warning box the most important idea here: exhaustion is not a sell signal. A slowing trend can keep grinding higher for a long time. What changed the odds in our tests across this course was structure: a close below the last higher low, followed by a lower high. Use exhaustion signs to tighten stops, take partial profits and stop adding to trend positions; use the structure break to decide whether the trend is over.
Step by Step: A Retest Entry
Bearish reversal
Step 1: Note exhaustion
Shrinking pushes, long upper wicks, deeper pullbacks.
Step 2: Mark the last higher low
The level that defines the uptrend.
Step 3: Wait for the break
A candle closes below it.
Step 4: Wait for the retest
Price bounces toward the broken level and stalls, forming a lower high.
Step 5: Enter and manage
Short on a bearish candle; stop above the lower high; target the next support.
Practical Example
Hypothetically, a pharma stock rises from ₹1,200 to ₹1,480 in three pushes: ₹1,200 to ₹1,360, ₹1,320 to ₹1,440, and ₹1,410 to ₹1,480. The pushes shrink from ₹160 to ₹120 to ₹70, and the last high has a long upper wick. The last higher low is ₹1,410.
Two weeks later, the stock closes at ₹1,392, below ₹1,410. It bounces to ₹1,418 and prints a bearish engulfing candle. Sana shorts stock futures at ₹1,405 with a stop at ₹1,432 and a target of ₹1,330, the previous pullback low: ₹27 of risk for ₹75 of reward.
Using Exhaustion to Manage a Trend Trade
If you are already in a trend trade, exhaustion signs are useful for management rather than for reversing. A simple framework:
| Sign | Management response |
|---|---|
| Each push smaller than the last | Stop adding new positions in the trend's direction |
| Long wick against the trend at a new extreme | Consider taking partial profit |
| Pullbacks getting deeper | Move the stop to just beyond the last swing |
| Close beyond the last swing (structure break) | Exit the remaining trend position |
This approach accepts that you will give back some profit at most turns. In exchange, you stay in the trend through the many exhaustion warnings that come to nothing, and exit on objective evidence when the structure finally changes.
Reversals on Different Timeframes
A reversal on one timeframe is often a pullback on the next one up. A structure break on the 1-hour chart may be nothing more than a dip within a daily uptrend, and a daily reversal can be a pullback in a weekly trend. Before trading a reversal, check the next higher timeframe:
- If the higher timeframe is also turning or at a major level, the reversal has room to develop.
- If the higher timeframe trend is strong and far from resistance, expect the reversal to be a pullback, and keep targets modest.
- If you cannot tell, reduce size. Reversal trades already fight the prior trend.
Common Mistakes
- Shorting a strong trend because it 'has gone up too much'.
- Treating one big red candle as a reversal.
- Ignoring the higher timeframe: a daily reversal inside a weekly uptrend may only be a pullback.
- Adding to losing counter-trend trades.
- No defined invalidation for the reversal idea.
Professional Insight
Professional traders tend to use exhaustion to manage existing trend positions rather than to open new counter-trend ones. When they do trade reversals, most wait for structure to change, accepting a worse price in exchange for evidence.
Risk Considerations
- Many breaks of structure fail and the trend resumes.
- Reversal trades fight the prior trend, so position size conservatively.
- Sharp reversals may never retest; accept missing some.
Important Terminology
| Term | Meaning |
|---|---|
| Momentum | How forcefully price is moving in one direction. |
| Exhaustion | Signs a trend is losing force. |
| Climactic candle | An unusually large candle late in a trend. |
| Break of structure | A close beyond the swing that defined the trend. |
| Lower high | A bounce that fails below the prior high, confirming a downtrend. |
How do I spot a trend reversal?
Look for exhaustion first, then wait for price to close beyond the last swing that defined the trend, ideally followed by a lower high (or higher low).
What is momentum in price action?
How forcefully price moves: large candles, long swings and shallow pullbacks in the trend's direction show strong momentum.
What are signs of trend exhaustion?
Shrinking pushes, long wicks against the trend, deeper pullbacks and climactic candles without follow-through.
Should I try to pick tops and bottoms?
Most traders find it costly. Waiting for a break of structure and a retest gives up some price for much clearer evidence.
What is the difference between a pullback and a reversal?
A pullback holds the last swing; a reversal breaks it.
Do smaller and smaller pushes mean a trend is about to reverse?
Not in our data. On real 1H charts, trends with three shrinking pushes made another new high before breaking structure 70% of the time. Shrinking pushes are a reason to manage risk, not a reason to trade against the trend.
What confirms a trend reversal?
A close beyond the last swing that defined the trend, such as the last higher low in an uptrend, followed by a lower high on the next bounce. Exhaustion signs alone are not confirmation.
What if a reversal never retests the broken level?
Then there is no retest entry, and the trade is missed. In a real NIFTY example from July 2026, a close below the last higher low was followed by a gap down and a fall of about 500 points without any return to the broken level. Missing such moves is a normal cost of waiting for confirmation.
Practical Exercise
Study five trend endings.
Your task
Step 1: Find five major tops
On daily charts of liquid stocks or indices.
Step 2: Measure the last three pushes
Did they shrink?
Step 3: Mark the break
When did price close below the last higher low?
Step 4: Check the retest
Did a lower high form, and where?
Check Your Understanding
Which shows strong upward momentum?
Related Lessons
Previous: Pullbacks and Retracements. Next: Price Rejection. See also Market Trends.