
Risk-Reward Ratio Explained: Break-Even Win Rates and Realistic Targets
JustWolves is an educational platform and is not a SEBI-registered investment advisor. Trading financial instruments involves significant risk of loss and may not be suitable for all investors. Past performance is not indicative of future results. Read our full disclaimer →
What you'll learn
- Risk-reward ratio = distance to target ÷ distance to stop
- Break-even win rate = 1 ÷ (1 + reward-to-risk); at 1:2 it is about 33%
- Win rate and risk-reward only mean something together
- Larger targets are reached less often, so a bigger ratio isn't automatically better
- Targets must come from the chart, not from the ratio you'd like
In this article · 15 sections
Before you enter a trade you should know two distances: how far price can move against you before you're wrong, and how far it might reasonably move in your favour. The relationship between them, the risk-reward ratio, tells you how often you need to be right to make money. It is one of the simplest numbers in trading and one of the most misunderstood.
What You Will Learn
- How to calculate the risk-reward ratio for any trade
- The win rate each ratio needs just to break even
- Why a high ratio and a high win rate rarely come together
- How to set targets the chart supports
Before You Start
Read Risk Management: Why It Comes First and Position Sizing and the 1% Rule first. You should be comfortable placing a stop-loss on a chart and working with percentages.
What Is the Risk-Reward Ratio?
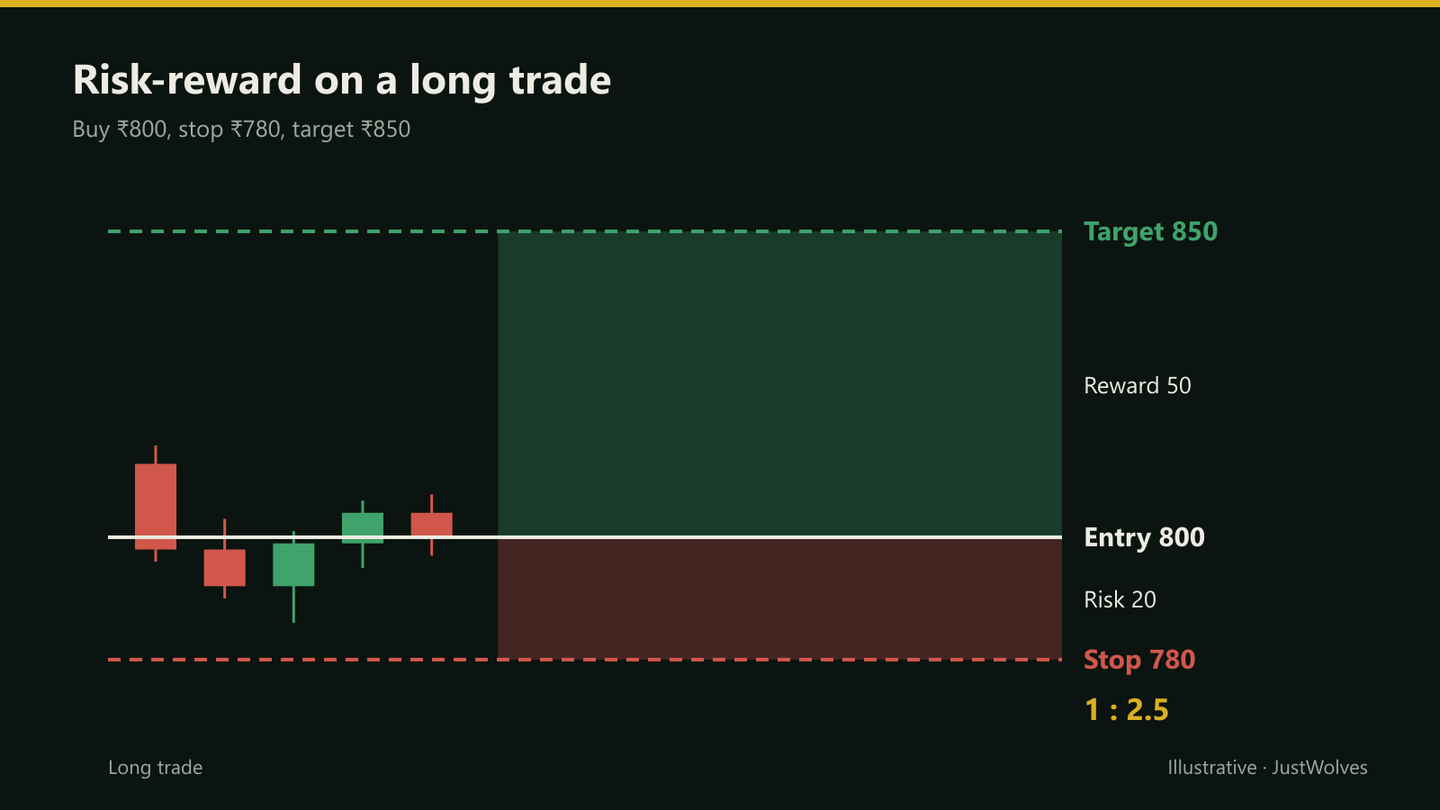
The risk-reward ratio compares what you stand to lose if your stop-loss is hit with what you stand to gain if your target is hit. Traders usually write it as 1:R, meaning you risk 1 to make R.
Example: you buy a stock at ₹800 with a stop at ₹780 and a target at ₹850. You risk ₹20 to make ₹50, so the trade is 1:2.5.
The Break-Even Win Rate
If every winner makes R and every loser costs 1, the strategy breaks even when win rate = 1 ÷ (1 + R). Below that win rate it loses money; above it, it makes money (before costs).
| Risk-reward | Break-even win rate | In plain terms |
|---|---|---|
| 1:1 | 50.0% | Must win half your trades |
| 1:1.5 | 40.0% | Can lose 6 in 10 |
| 1:2 | 33.3% | Can lose 2 in 3 |
| 1:2.5 | 28.6% | Can lose about 7 in 10 |
| 1:3 | 25.0% | Can lose 3 in 4 |
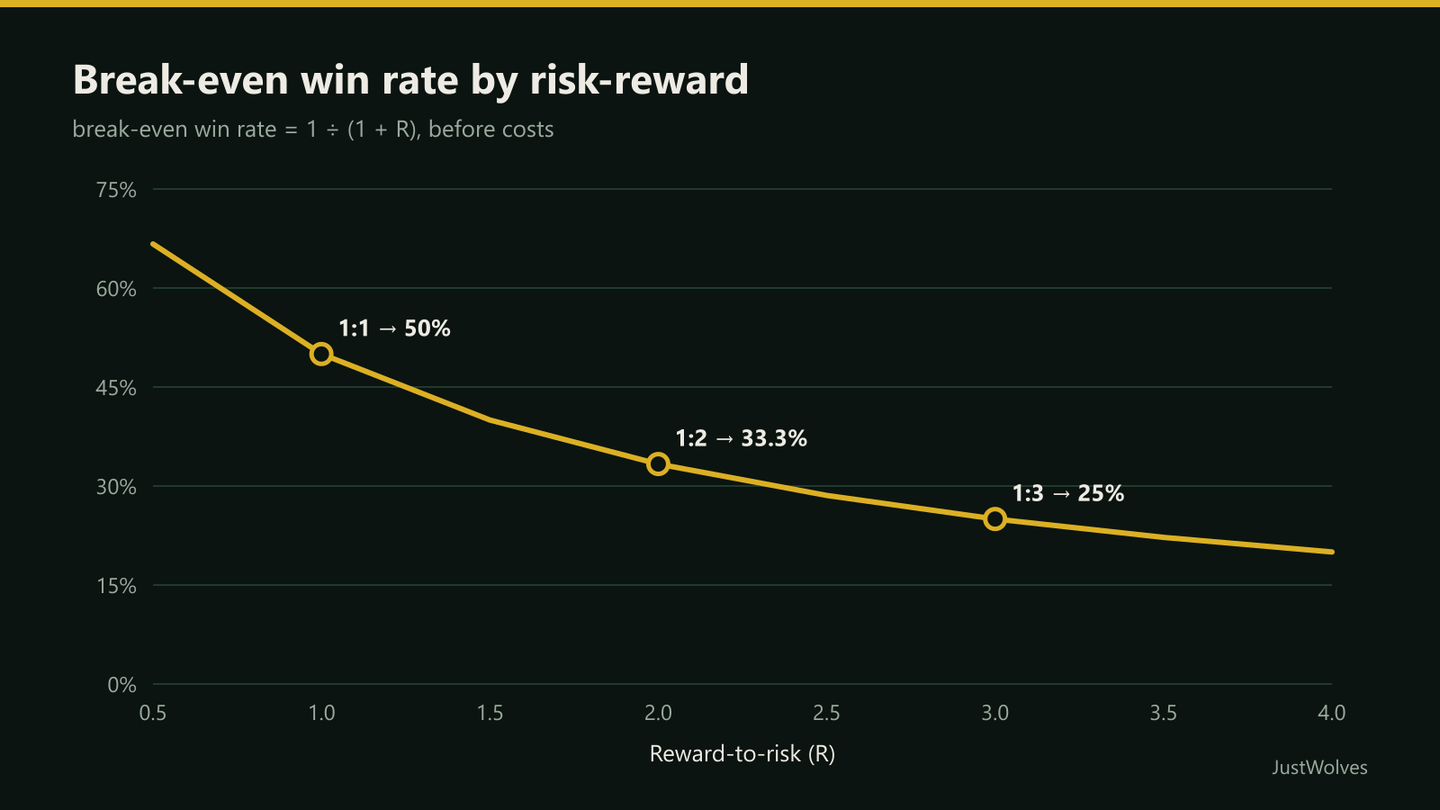
This is why a strategy that loses more often than it wins can still be profitable, and why one that wins most of the time can still lose money.
Win Rate and Risk-Reward Work Together
Neither number means anything on its own. Here are four strategies, each measured per trade in units of risk (R):
| Win rate | Risk-reward | Average result per trade |
|---|---|---|
| 60% | 1:1 | +0.20R |
| 40% | 1:2 | +0.20R |
| 30% | 1:3 | +0.20R |
| 70% | 1:0.5 | +0.05R |
The first three strategies have very different personalities but the same long-run result. The fourth wins seven times in ten and still barely makes money, because its winners are half the size of its losers. A single slip in execution or a little extra cost would turn it into a losing system.
Why a Bigger Ratio Isn't Automatically Better
It is tempting to aim for 1:5 on every trade. The problem is that a target five times further away than your stop is reached far less often than one twice as far. Moving the target out doesn't change where the market is likely to go; it only changes how often you get paid.
In practice, ratio and win rate pull against each other. The goal isn't the biggest ratio, but a combination of ratio and win rate that produces a positive average result and that you can actually follow.
How to Set Targets the Chart Supports
Planning a trade's risk-reward
Step 1: Set the stop where you are proven wrong
Beyond the swing point or level your trade depends on, as in Lesson 12.01.01.
Step 2: Find the first obstacle
Identify the nearest level where price is likely to stall: a previous high or low, a support or resistance zone, a round number.
Step 3: Measure the ratio to that obstacle
Use the distance to the first obstacle, not to a hopeful level beyond it.
Step 4: Decide whether the trade is worth it
If the ratio to the first obstacle is below your minimum (many traders use about 1:1.5 to 1:2), skip the trade rather than stretching the target.
Real Prices: Four Targets on One Trade
The trade diagram in this lesson is hypothetical. The chart below puts four different targets on one real trade, Bharti Airtel in October and November 2026, to show the trade-off between the size of a target and the chance of reaching it.
Real prices: one trade, four possible targets, Bharti Airtel, October–November 2026
Step 1 of 4
The trade
Bharti Airtel breaks out on 27 October 2026 and closes at ₹1,978.8. With a stop below the recent base at about ₹1,905, the risk is ₹73.8 a share: 1R.
- What to observe
- The risk is fixed; the reward depends on where the target goes.
- Condition
- Four traders pick 1R, 1.5R, 2R and 3R targets.
Practical Example
Nifty is trading at 24,500 after pulling back to a support zone around 24,450. A trader plans a long trade with the stop at 24,410, just below the zone: 90 points of risk.
The previous swing high sits at 24,680, which is 180 points away. That gives 1:2 to the first obstacle. Beyond it, the next resistance is around 24,900 (1:4.4), but price has to get through 24,680 first.
A sensible plan takes the trade with the main target at 24,680, perhaps closing part of the position there and trailing the rest (Lesson 12.02.02 covers this). Planning the trade around 24,900 alone would assume price ignores the level in between.
Bigger Targets on Real Trades: Our Test
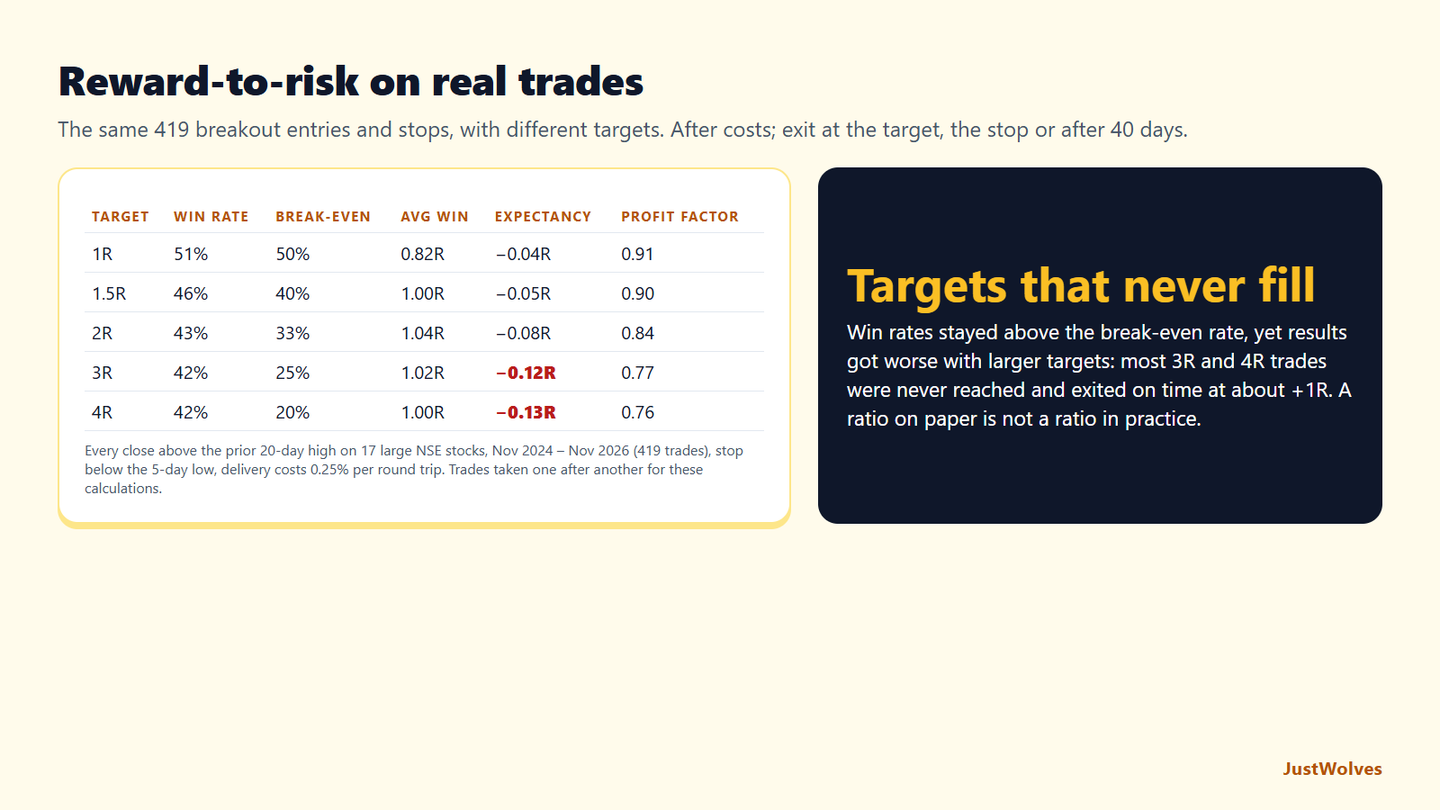
JustWolves tested this lesson's trade-off on the 419 trades of a simple breakout strategy on 17 large NSE stocks (November 2024 to November 2026): same entries, same stops below the previous five days' low, and targets of 1R, 1.5R, 2R, 3R and 4R. Trades not reaching the target or stop were closed after 40 trading days. Delivery costs of 0.25% per round trip were included.
| Target | Win rate | Break-even win rate | Average win | Expectancy | Profit factor |
|---|---|---|---|---|---|
| 1R | 51% | 50% | 0.82R | −0.04R | 0.91 |
| 1.5R | 46% | 40% | 1.00R | −0.05R | 0.90 |
| 2R | 43% | 33% | 1.04R | −0.08R | 0.84 |
| 3R | 42% | 25% | 1.02R | −0.12R | 0.77 |
| 4R | 42% | 20% | 1.00R | −0.13R | 0.76 |
The break-even maths was satisfied, yet results got worse. At every target, the win rate was above this lesson's break-even win rate: 42% against a 20% break-even at 4R, for example. But the average win barely changed, staying around 1R whatever the target, because most trades never reached a 3R or 4R target and were closed after 40 days at a modest gain. The win rate counted those as wins, but they were not 3R wins.
This is the "realistic targets" section of this lesson, measured. A ratio written on the plan is only real if the market regularly travels that far. For these breakouts, the typical move was about 1R to 2R; setting a 4R target did not make the trades bigger, it only gave back more of the moves that turned around.
Use the ratio you actually achieve. The useful numbers for expectancy are the realised average win and loss, not the planned ratio. In this stream, the realised ratio was about 1:1 at every target above 1.5R. Checking that number in your own journal is the quickest way to tell whether your targets are realistic.
Common Mistakes
- Judging a strategy by win rate alone. A 70% win rate means nothing without the size of the wins and losses.
- Stretching targets to hit a ratio. The market doesn't know your preferred ratio.
- Moving the stop further away during the trade. That changes the ratio after you've committed to it, always for the worse.
- Taking profit early but letting losses run. It quietly turns a 1:2 plan into 1:0.5 in practice.
- Ignoring costs. Brokerage and slippage raise the break-even win rate, especially for small intraday targets.
Professional Insight
Professional traders track their *realised* risk-reward, the average winner divided by the average loser from their trade journal, not the ratio they planned. The gap between the two is one of the most useful things a journal reveals: if you plan 1:2 but realise 1:1.1, the problem is in how you manage open trades, not in your entries.
Risk Considerations
- Win rates drift. A win rate measured on 20 trades is unreliable; judge it over 100 or more (Lesson 12.04.04).
- Slippage on stops makes average losses a little bigger than planned, which raises the break-even win rate.
- Changing market conditions can lower a strategy's win rate while its ratio stays the same.
Important Terminology
| Term | Meaning |
|---|---|
| Risk-reward ratio (1:R) | The potential loss to the stop compared with the potential gain to the target. |
| Reward-to-risk (R) | Distance to target divided by distance to stop. 1:2 means R = 2. |
| Break-even win rate | The win rate at which a strategy neither makes nor loses money: 1 ÷ (1 + R), before costs. |
| Expectancy | The average result per trade: (win rate × average win) − (loss rate × average loss). |
| Realised risk-reward | Average winner divided by average loser from your actual trades, as opposed to the ratio you planned. |
| First obstacle | The nearest level where price is likely to stall; a realistic first target. |
What is a good risk-reward ratio?
Many traders look for at least 1:1.5 to 1:2, but there is no universal answer. A good ratio is one that, combined with your realistic win rate, produces a positive average result after costs.
Is 1:2 risk-reward profitable?
Only if your win rate is above about 33%, and a little higher once costs are included. Below that, a 1:2 strategy still loses money.
How do I calculate risk-reward?
Divide the distance from entry to target by the distance from entry to stop. Buying at ₹100 with a stop at ₹95 and a target at ₹110 gives ₹10 ÷ ₹5 = 1:2.
Why do traders with high win rates still lose money?
Usually because their losses are much bigger than their wins, often from moving stops or holding losers while taking profits quickly. A 70% win rate at 1:0.4 loses money.
Is a higher risk-reward ratio always better?
No. In our test on 419 real NSE breakout trades, targets of 3R and 4R were rarely reached; the average win stayed near 1R and expectancy got worse (−0.12R to −0.13R) than with 1R to 1.5R targets.
What is the break-even win rate for a 1:2 trade?
One in three, or about 33%, before costs: win rate = 1 ÷ (1 + reward-to-risk). Costs raise it slightly. In our NSE data, a 2R target won 43% of the time, but many wins were smaller than 2R, so the trades still lost money.
Practical Exercise
Calculate the risk-reward and break-even win rate for each planned trade, then decide which you would take if your minimum is 1:1.5.
Your task
Step 1: Trade A (long)
Entry ₹500, stop ₹490, target ₹530.
Step 2: Trade B (long)
Entry ₹1,200, stop ₹1,170, target ₹1,230.
Step 3: Trade C (short)
Entry 24,600, stop 24,660, target 24,480.
Check Your Understanding
Entry ₹200, stop ₹190, target ₹230. What is the risk-reward?
Related Lessons
Previous: Position Sizing and the 1% Rule. Next: Lesson 12.01.05, Win Rate and Expectancy.