
Multi-Timeframe (Top-Down) Analysis for Price Action Traders
JustWolves is an educational platform and is not a SEBI-registered investment advisor. Trading financial instruments involves significant risk of loss and may not be suitable for all investors. Past performance is not indicative of future results. Read our full disclaimer →
What you'll learn
- Use three timeframes: one for trend, one for setups and levels, one for entries
- A factor of about four to six between them keeps each view distinct
- Trade in the direction of the higher timeframe unless you have a strong reason not to
- Higher-timeframe levels matter more than lower-timeframe ones
- When timeframes conflict, wait, reduce size or skip
In this article · 18 sections
Every timeframe tells a different story: a daily uptrend, a 1-hour pullback, a 5-minute downtrend. Multi-timeframe analysis puts these stories in order so you trade with the bigger picture and time your entries on the smaller one. This lesson gives you a general top-down method that works for stocks, indices and forex.
What You Will Learn
- Why using several timeframes helps
- How to choose a set of timeframes for your style
- The top-down reading process
- What to do when timeframes disagree
Before You Start
Read Swing Highs and Swing Lows first. For forex-specific and SMC versions of this workflow, see Top-Down Forex Analysis and Multi-Timeframe SMC Analysis.
Why Use Several Timeframes?
A single timeframe gives either context or precision, rarely both. Higher timeframes show the main trend and the most significant levels, but entries there need wide stops. Lower timeframes allow precise entries and tighter stops, but on their own they're noisy and easy to misread.
Combining them gives you direction from the higher timeframe and timing from the lower one.
Choosing Your Timeframes
| Style | Trend | Setup and levels | Entry |
|---|---|---|---|
| Position / long-term swing | Weekly | Daily | 4-hour |
| Swing trading | Daily | 4-hour or 1-hour | 1-hour or 15-minute |
| Intraday | Daily or 1-hour | 15-minute | 5-minute |
For Indian intraday traders in stocks and Nifty, a daily/15-minute/5-minute set is common. Whichever you choose, keep it fixed.
The Top-Down Process
From the top
Step 1: Trend timeframe
Classify the trend (lesson 04.01.02) and mark the major support and resistance levels.
Step 2: Setup timeframe
Look for a setup in the trend's direction: a pullback to support in an uptrend, a range near a key level, a pattern forming.
Step 3: Entry timeframe
When price reaches your setup level, look for a trigger: a rejection candle, a break of a minor swing, a small pattern.
Step 4: Risk
Stop beyond the entry-timeframe swing or the setup level; target the next higher-timeframe level.
Step 5: Record
Note what each timeframe showed at the time of the trade.
The Process on One Chart
The chart below is the 5-minute chart from this lesson's practical example, with the daily support level drawn on it. Step through it to see how each timeframe does its own job: the daily chart gives direction and location, the pullback brings price to the level, and the 5-minute chart gives the trigger, the stop and the timing.
Daily support, 15-minute pullback, 5-minute entry
Step 1 of 5
Daily chart: direction and level
The daily trend is up and there is support near 24,350. That is the only direction this trader will look for today: longs near support.
- What to observe
- Direction and location come from the highest timeframe.
- Condition
- Longs only, and only near 24,350.
Real Case: A Top-Down Trade That Lost
The chart below uses real NIFTY 50 hourly candles from November 2026, with the daily level drawn on it. Every timeframe agreed, the entry followed the method exactly, and the trade still lost. Step through it to see why that is normal, and what the higher-timeframe level was doing all along.
Real case: a trade with the daily trend that still lost, NIFTY 50, November 2026
Step 1 of 4
Daily: a strong uptrend
NIFTY has rallied about 2,800 points from its October low. On the daily chart the trend is clearly up, and the prior daily highs at 25,030–25,084 now sit below price as the nearest higher-timeframe level.
- What to observe
- Direction and level from the daily chart.
- Condition
- Longs only.
Stacking Levels Across Timeframes
Levels from different timeframes often sit close together. A daily support level, a 1-hour swing low and a round number within a few points of each other form a zone that many participants are watching, which makes it a stronger place to look for a trade than any single level. Mark higher-timeframe levels in a heavier line or a different colour so they stand out when you zoom in. When you plan targets, check the higher timeframe too: a 15-minute target that sits just beyond a daily resistance level is unlikely to be reached cleanly, so aim just before the higher-timeframe level instead.
When Timeframes Disagree
- Higher up, lower down: usually a pullback. Wait for the lower timeframe to turn back in the higher timeframe's direction near a level.
- Higher timeframe ranging: trade the range edges, or wait for a breakout.
- Higher timeframe just broke its structure: the trend is in question. Reduce size or wait for a new trend to form.
- No agreement at all: no trade.
Does Trading with the Higher Timeframe Help? Our Test
JustWolves tested the core rule of this lesson on about six months of real 1H candles for NIFTY 50, EUR/USD, GBP/USD, USD/JPY and gold, with the daily chart as the higher timeframe.
Entry trigger (1H): after at least three falling closes, a candle closes above the previous candle's high (or the reverse for shorts). This is a simple version of the pullback-and-resume trigger in this lesson.
Higher-timeframe trend (daily): the last completed daily close above a rising 20-day average (uptrend) or below a falling one (downtrend).
We measured where price was 12 and 24 hours after each trigger, in units of the average 1H candle range, and split the triggers by whether they agreed with the daily trend.
| Trigger | Cases | Right way after 24h | Average move after 24h |
|---|---|---|---|
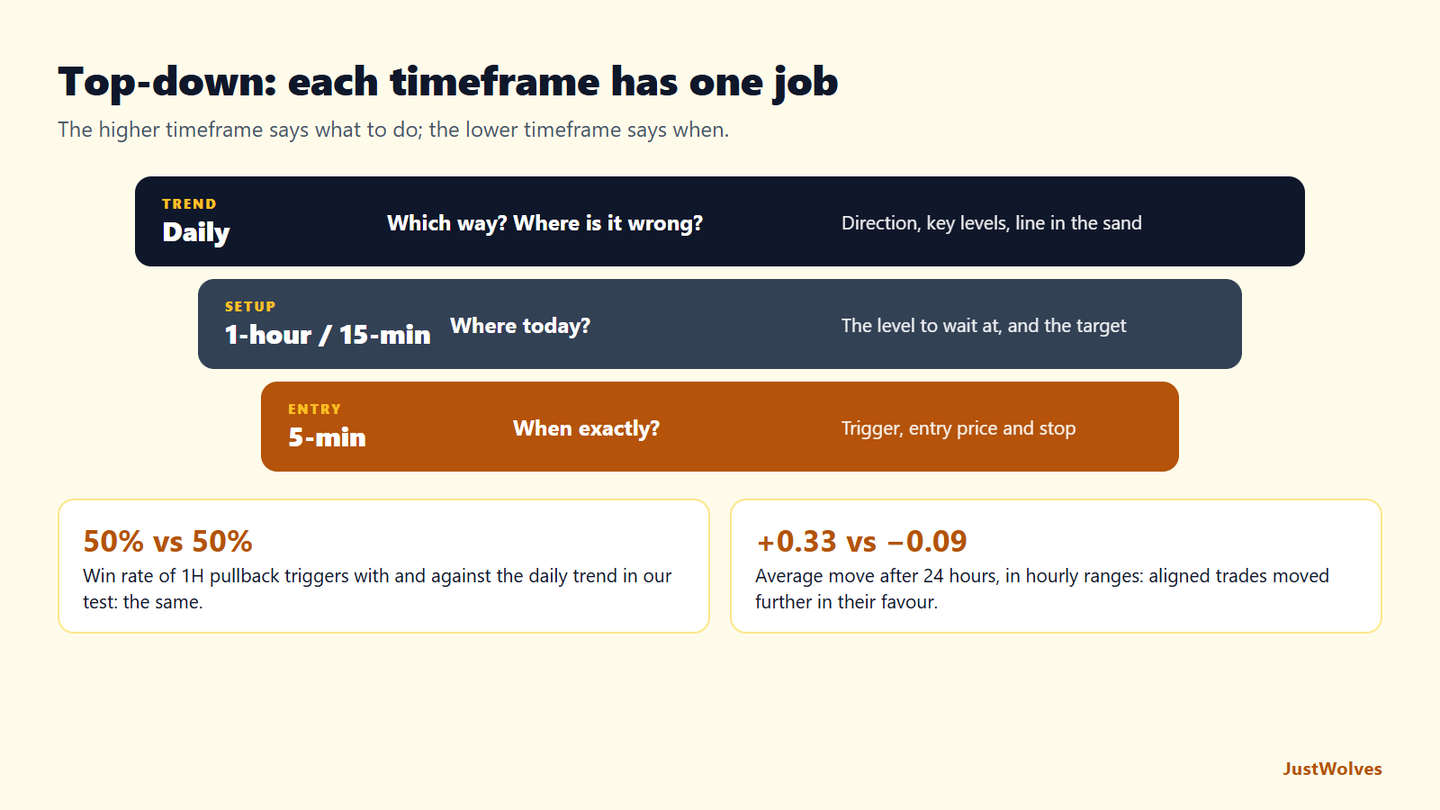
| With the daily trend | 151 | 50% | +0.33 candle ranges |
| Against the daily trend | 167 | 50% | −0.09 candle ranges |
The result is more subtle than "trade with the trend and you will win more". The win rate was the same, 50%, whichever way the trigger pointed. What changed was the size of the moves. Triggers with the daily trend gained a third of a candle range on average after 24 hours; triggers against it lost a little. Winning trades with the trend tended to run further, and losing trades did less damage.
This matters for how you trade. Trading with the higher timeframe is not about being right more often; it is about letting your winners be bigger. That fits with the targets in this lesson: aim for the next higher-timeframe level, and give trend-aligned trades room to reach it. Counter-trend trades need smaller targets, if you take them at all.
Our test of a different trigger, the market structure shift used in Smart Money Concepts, found the same direction of effect, with trend-aligned triggers clearly ahead (Multi-Timeframe SMC Analysis). The trigger itself was close to a coin flip in both tests. The higher timeframe, the level and the reward-to-risk carry most of the weight.
Practical Example
Hypothetically, an intraday trader uses daily, 15-minute and 5-minute charts for Nifty futures. The daily trend is up, with support at 24,350. On the 15-minute chart, price pulls back from 24,520 towards 24,360 during the morning.
At 24,365, the 5-minute chart prints a strong bullish candle that closes above a minor swing high. Meera buys at 24,375 with a stop at 24,330, below the 5-minute swing low and the daily support, and targets the morning high at 24,520: 45 points of risk for 145 points.
A Daily Top-Down Routine
Multi-timeframe analysis works best as a fixed routine, done before the session starts rather than in reaction to a moving chart. A simple version for an intraday trader:
- Trend timeframe (about 10 minutes): classify the daily trend with the two-and-two swing rule. Mark the nearest daily support and resistance and the line in the sand.
- Setup timeframe (about 10 minutes): on the 15-minute or 1-hour chart, note where price is relative to those levels and which of them is likely to be reached today.
- Write the plan: for example, "Daily up. Look for longs only between 24,340 and 24,360. Target 24,520. No trades if price closes below 24,330 on the 15-minute chart."
- Entry timeframe (during the session): open the 5-minute chart only when price is near your level, and wait for the trigger you wrote down.
The written plan is the important part. It stops a lower-timeframe move from changing your mind about the direction while you are watching it.
| Timeframe | Question | Output |
|---|---|---|
| Trend (highest) | Which way, and where is it wrong? | Direction, key levels, line in the sand |
| Setup (middle) | Where today? | The level or zone to wait at, and the target |
| Entry (lowest) | When exactly? | Trigger, entry price and stop |
Timeframes and Indian Market Hours
The NSE cash and F&O session runs from 9:15 am to 3:30 pm IST, about 6 hours 15 minutes. That shapes which timeframes are useful. A 1-hour chart gives only six or seven candles a day, so for intraday trading the 15-minute chart usually serves as the setup timeframe, with the daily chart for trend. The 4-hour chart is awkward on Indian equities, because a session does not divide into 4-hour candles evenly.
Overnight gaps also matter. A daily support level can be skipped entirely by a gap at the open. Before the session, check where the pre-open is pointing and whether your daily level is still in play. For forex and gold, which trade almost around the clock, the usual 4-hour and 1-hour sets work without these issues.
Practise on a Real Chart
The chart below is real NIFTY 50 data. Use the timeframe buttons to read it top-down: classify the trend on the daily view, mark the nearest daily level, then switch to the hourly view and find where a pullback reached that level. Write the plan before you look at what happened next.
Practice chart: NIFTY 50 daily and hourly
Loading historical candles…
Common Mistakes
- Starting on the lowest timeframe and looking for reasons afterwards.
- Using too many timeframes.
- Timeframes too close together, such as 5- and 3-minute.
- Ignoring higher-timeframe levels just above or below your entry.
- Switching timeframes mid-trade to justify holding.
Professional Insight
Experienced traders often say the higher timeframe tells you what to do and the lower timeframe tells you when. Keeping that division of labour strict prevents the most common multi-timeframe error: letting a convincing lower-timeframe signal overrule the bigger picture.
Risk Considerations
- Lower-timeframe stops are tighter but hit more often.
- Higher-timeframe trends can turn while you're waiting for an entry.
- Overnight gaps in stocks and indices affect daily-timeframe setups.
Important Terminology
| Term | Meaning |
|---|---|
| Top-down analysis | Reading charts from higher to lower timeframes. |
| Trend timeframe | The timeframe that defines direction. |
| Setup timeframe | Where you find the trade idea and levels. |
| Entry timeframe | Where you time the entry. |
| Trigger | The signal that starts the trade. |
What is multi-timeframe analysis?
Using several chart timeframes together: a higher one for trend and key levels, and lower ones for setups and entry timing.
Which timeframes should I use for swing trading?
A common set is daily for trend, 4-hour or 1-hour for setups, and 1-hour or 15-minute for entries.
Which timeframes suit intraday trading in India?
Many intraday traders use daily for context with 15-minute and 5-minute charts for setups and entries.
What if the timeframes disagree?
Usually it's a pullback. Wait for the lower timeframe to align, reduce size, or skip the trade.
How many timeframes should I use?
Three is enough for most traders. More tends to create conflict and confusion.
Do trades with the higher-timeframe trend win more often?
In our test on six months of real 1H data with the daily trend as the filter, trend-aligned pullback triggers won as often as counter-trend ones, about 50%. But they moved further in the trade's favour on average, so they produced better results.
Which timeframes should Indian intraday traders use?
Daily for trend and key levels, 15-minute for setups and 5-minute for entries is a common set. A 1-hour chart gives only six or seven candles per NSE session, so it is less useful as a setup timeframe for intraday trading.
Can a trade with the higher-timeframe trend still lose?
Yes, often. In a real NIFTY example from November 2026, an hourly pullback entry in a strong daily uptrend was stopped out the next day. Our data found trend-aligned trades won about as often as counter-trend ones, but moved further when they worked.
Practical Exercise
Do one top-down analysis.
Your task
Step 1: Choose a set
For example daily, 1-hour, 15-minute.
Step 2: Trend timeframe
Trend and two key levels.
Step 3: Setup timeframe
Is a setup forming in the trend's direction?
Step 4: Entry timeframe
Write the trigger, stop and target you'd use.
Check Your Understanding
The higher timeframe is mainly used for:
Related Lessons
Previous: Swing Highs and Swing Lows. Next module: Key Levels, starting with What Is Support and Resistance?. See also Top-Down Forex Analysis in the Forex course.