
Trendlines and Price Channels: How to Draw and Trade Them
JustWolves is an educational platform and is not a SEBI-registered investment advisor. Trading financial instruments involves significant risk of loss and may not be suitable for all investors. Past performance is not indicative of future results. Read our full disclaimer →
What you'll learn
- An uptrend line connects rising swing lows; a downtrend line connects falling swing highs
- Two points draw a line; a third touch confirms it
- A channel adds a parallel line through the opposite swings
- Trade bounces in the trend's direction and treat a decisive close through the line as a warning
- Trendlines are subjective; draw them consistently and don't force them
In this article · 17 sections
A trendline is the oldest and simplest tool in technical analysis: a straight line along the lows of an uptrend or the highs of a downtrend. It turns a trend into something you can see and measure, showing where pullbacks may stop and when the trend may be weakening. This lesson covers how to draw trendlines and channels properly and how to trade them without forcing them.
What You Will Learn
- How to draw valid trendlines
- How to build a price channel
- How to trade trendline bounces and breaks
- Common mistakes that make trendlines unreliable
Before You Start
Read Swing Highs and Swing Lows and Dynamic Support and Resistance first.
Drawing a Trendline
- Uptrend line: connect two or more rising swing lows, drawn beneath price.
- Downtrend line: connect two or more falling swing highs, drawn above price.
- Confirmation: two points define any line; a third touch that holds makes it a confirmed trendline.
- Wicks or bodies: choose one method and stick with it. Many traders use wicks, adjusting slightly to touch the most points.
Price Channels
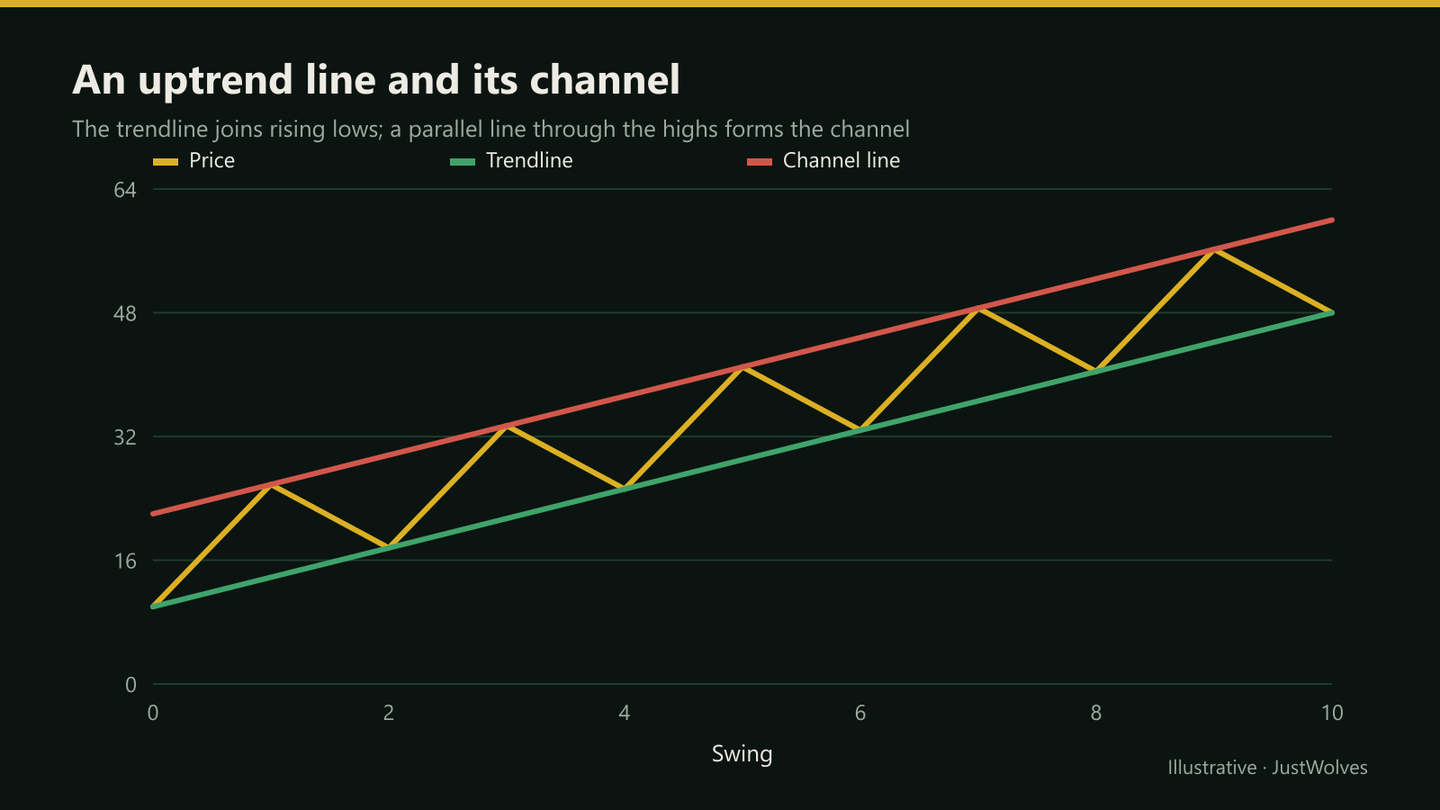
Once you have a trendline, draw a parallel line through the swing highs (for an uptrend) or lows (for a downtrend). The two lines form a channel. In a rising channel, traders look to buy near the lower line and take profit near the upper one; a move that fails to reach the upper line can be an early sign the trend is losing strength.
Trading Trendlines
| Situation | Common approach |
|---|---|
| Price pulls back to a confirmed trendline | Look for a bullish reaction to buy (uptrend), with a stop below the line and the last swing low |
| Price reaches the channel's upper line | Take partial profit; avoid new longs there |
| Decisive close through the trendline | Stop taking with-trend trades; watch for a range or reversal |
| Break, then retest from the other side | Treat the line as resistance (or support); a classic role reversal |
A Trendline Trade from Start to Finish
The chart below follows the Bank Nifty example in this lesson: the line drawn from two rising lows, the third touch with a horizontal level, the trade, and the later break. Step through it and pay attention to the last step: what a break does and does not tell you.
A trendline bounce, then a break
Step 1 of 6
Two rising lows draw the line
Swing lows at 50,200 and 51,100 are joined and the line is extended to the right. Two points can draw any line, so it is not yet confirmed.
- What to observe
- A rising line under price.
- Condition
- Wait for a third touch.
Real Case: A Steep Trendline on NIFTY 50
The chart below uses real NIFTY 50 hourly candles from November 2026. It shows a steep trendline doing exactly what this lesson warns about: a third touch that held, a break two hours later, and then a new high anyway.
Real case: a steep trendline, a third touch and a break, NIFTY 50 hourly, November 2026
Step 1 of 4
Two rising lows draw the line
NIFTY makes a swing low at 23,737 on 4 November and another at 24,388 on 6 November. Joined and extended, the line rises about 59 points per hour, roughly half an average hourly range: a steep line.
- What to observe
- A rising trendline, steep by this lesson's angle check.
- Condition
- Wait for a third touch.
Timeframes, Scales and Markets
Trendlines on higher timeframes are watched by more traders and tend to matter more than lines on 5-minute charts. On long-term charts, especially of stocks that have risen many times over, a logarithmic price scale can give cleaner trendlines than a linear one, because it shows percentage moves rather than rupee moves; check which scale your platform is using before comparing lines. On Indian stocks and indices, overnight gaps often jump straight through a trendline, so judge breaks by closing prices and be prepared for your stop to fill beyond the line.
Do Trendlines Hold? Our Test
JustWolves drew trendlines automatically on about six months of real 1H candles for NIFTY 50, EUR/USD, GBP/USD, USD/JPY and gold. Every pair of consecutive rising five-candle swing lows, 5 to 60 candles apart, became a trendline (and the same on mirrored prices for downtrend lines). On the third touch, we recorded whether the line held (price bounced one average candle range) or broke (a candle closed clearly through it). As a control, we tested the same line shifted one average range lower, where nothing should be special.
| Line | Cases | Held |
|---|---|---|
| Trendline through two swing lows | 734 | 51% |
| Placebo: same line one average range lower | 977 | 46% |
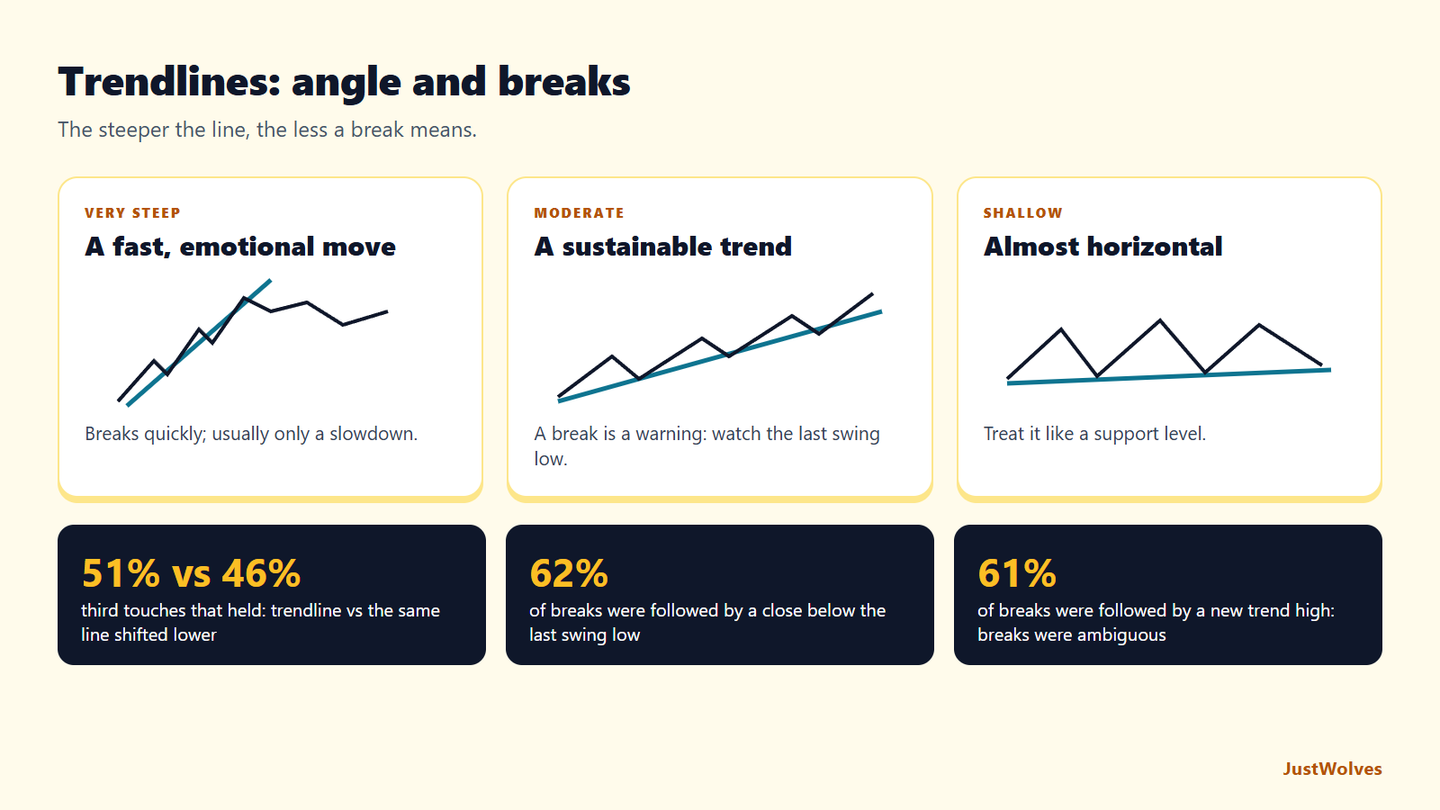
The real trendline held a little more often than the shifted placebo line, 51% against 46%. That is a small edge, and on its own about a coin flip. It supports this lesson's Professional Insight: trendlines are best used as a secondary tool, confirmed by horizontal levels and structure, not as a signal.
What Happens After a Trendline Breaks?
We also followed every first close through a trendline that had not yet broken the last swing low.
| What happened next | Share of breaks |
|---|---|
| Closed below the last swing low within 24 candles | 62% |
| Made a new trend high within 48 candles | 61% |
A trendline break was followed by a structure break about six times in ten, and by a new trend high about six times in ten as well. Many breaks led to both: a dip below the swing low and then a new high. In other words, a trendline break mostly told us that the trend had become less orderly. That is exactly what this lesson's tip says: a break shows the trend has slowed; it does not prove a reversal. Stop adding to trend trades after a break, but let the swing structure decide whether the trend is over.
Step by Step: A Trendline Bounce
Uptrend example
Step 1: Draw the line
Through at least two rising swing lows; wait for a third touch.
Step 2: Check context
Higher timeframe agrees; horizontal support near the line is a bonus.
Step 3: Wait for a reaction
A bullish candle at or just above the line.
Step 4: Enter and stop
Buy after the close; stop below the line and the candle's low.
Step 5: Target
The recent high or the channel's upper line.
Practical Example
Hypothetically, Bank Nifty's daily chart shows rising lows at 50,200 and 51,100, joined by a trendline. A third pullback reaches the line near 51,900 and prints a bullish engulfing candle. A horizontal level at 51,850 sits just below.
Sana buys Bank Nifty futures at 52,050, with a stop at 51,700, below the line and the level, targeting the recent high at 52,800: 350 points of risk for 750 points. Two weeks later, a close at 52,300, back below the trendline, tells her the trend has slowed, and she stops looking for new longs.
Steep, Normal and Shallow Trendlines
The angle of a trendline tells you a lot about how long it is likely to last. A very steep line describes a sharp, fast move that cannot be sustained; price usually breaks it quickly and then continues at a slower pace, so the break means little. A very shallow line is almost horizontal and behaves more like a support level. Lines in between are the ones that describe a sustainable trend.
A practical check is to compare the line's rise with the market's normal movement. If the line rises by more than about one average candle range per candle, it is too steep to rely on. Redraw it from a later swing low, or wait for a more measured trend.
| Angle | What it usually means | How to treat a break |
|---|---|---|
| Very steep | A fast, emotional move | Expected; often just a slowdown |
| Moderate | A sustainable trend | A warning; watch the last swing low |
| Shallow | A slow grind, near horizontal | Treat the line like a support level |
Drawing Tips That Keep Lines Objective
- Use confirmed swing points only. Use the five-candle swing rule from the Swing Highs and Swing Lows lesson, so you are not choosing points to fit a line you already want.
- Draw from left to right. Draw the line when the second swing is confirmed, and do not move it afterwards. Note the date you drew it.
- Allow small overshoots. As with horizontal levels, price often wicks through a line before bouncing. Judge breaks by closes, with a buffer of a fraction of an average candle range.
- One line per trend. If you need to redraw after a clear break, start a new line from the new swings and treat it as a new trend.
Common Mistakes
- Forcing lines through points that don't really line up.
- Redrawing the line after every break so it 'still holds'.
- Very steep lines, which break quickly and mean little.
- Ignoring the timeframe: a 5-minute trendline isn't a daily trendline.
- Calling a reversal on every break.
Professional Insight
Trendlines are among the most subjective tools in price action: two traders rarely draw exactly the same line. Professionals compensate by treating trendlines as secondary, confirming them with horizontal levels and swing structure rather than relying on them alone.
Risk Considerations
- Subjectivity: your line may not be the one others watch.
- Overshoots can trigger stops placed exactly at the line.
- Gaps in indices and stocks can jump through trendlines.
Important Terminology
| Term | Meaning |
|---|---|
| Trendline | A straight line joining swing lows (uptrend) or highs (downtrend). |
| Channel | A trendline plus a parallel line through the opposite swings. |
| Touch | A swing that reaches the line and reacts. |
| Break | A decisive close through the line. |
| Retest | Price returning to a broken line from the other side. |
How do I draw a trendline?
Join at least two rising swing lows for an uptrend, or two falling swing highs for a downtrend; a third touch confirms it.
Should trendlines use wicks or bodies?
Either, as long as you're consistent. Many traders use wicks and adjust slightly to fit the most touches.
What is a price channel?
A trendline plus a parallel line through the opposite swings, framing the trend's range.
What does a trendline break mean?
The trend has slowed. Confirm a reversal with horizontal structure, such as a break of the last higher low.
How steep should a trendline be?
Moderate. Very steep lines break quickly and are less meaningful.
How reliable are trendlines?
Modestly. In our test on real 1H data, automatically drawn trendlines held on the third touch 51% of the time, against 46% for the same line shifted lower. That is a small edge, best used together with horizontal levels and swing structure.
Does a trendline break mean the trend has reversed?
Not on its own. In our data, after a trendline break, price closed below the last swing low within 24 candles in 62% of cases, but also made a new trend high within 48 candles in 61%. A break mainly signals that the trend has slowed.
Why do steep trendlines break so often?
Because they describe a pace the market cannot keep. In a real NIFTY example from November 2026, an hourly trendline rising about 59 points per hour broke soon after its third touch, and the index still made a new high two sessions later.
Practical Exercise
Draw and test trendlines.
Your task
Step 1: Find three trending charts
Daily charts of Nifty, Bank Nifty or stocks.
Step 2: Draw trendlines
Using wicks, through at least two swings.
Step 3: Add channels
Parallel lines through the opposite swings.
Step 4: Review touches and breaks
How many touches held, and what happened after the break?
Check Your Understanding
An uptrend line connects:
Related Lessons
Previous: Dynamic Support and Resistance. Next: Supply and Demand Zones. See also the Breakout Trading course.