
Pullbacks and Retracements: Buying Dips in a Trend
JustWolves is an educational platform and is not a SEBI-registered investment advisor. Trading financial instruments involves significant risk of loss and may not be suitable for all investors. Past performance is not indicative of future results. Read our full disclaimer →
What you'll learn
- A pullback is a temporary move against the trend; it offers a better entry price in the trend's direction
- Common reference levels: 38.2%, 50% and 61.8% retracements, moving averages and prior support
- Healthy pullbacks are slower and smaller than the impulse moves
- A pullback becomes a reversal when it breaks the last swing that defined the trend
- Enter after evidence the pullback is ending, not just because price reached a level
In this article · 16 sections
Buying a breakout means buying at the top of the latest move. Buying a pullback means waiting for the trend to pause and dip, then joining it at a better price with a tighter stop. Pullback trading is one of the most widely used approaches in price action. This lesson covers how deep pullbacks tend to go, where to look for entries, and how to tell a pullback from the start of a reversal.
What You Will Learn
- What pullbacks and retracements are
- Common reference levels for pullback entries
- How healthy pullbacks look compared with reversals
- A step-by-step pullback entry
Before You Start
Read Consolidation and Trading Ranges and Dynamic Support and Resistance first.
Pullbacks and Retracements
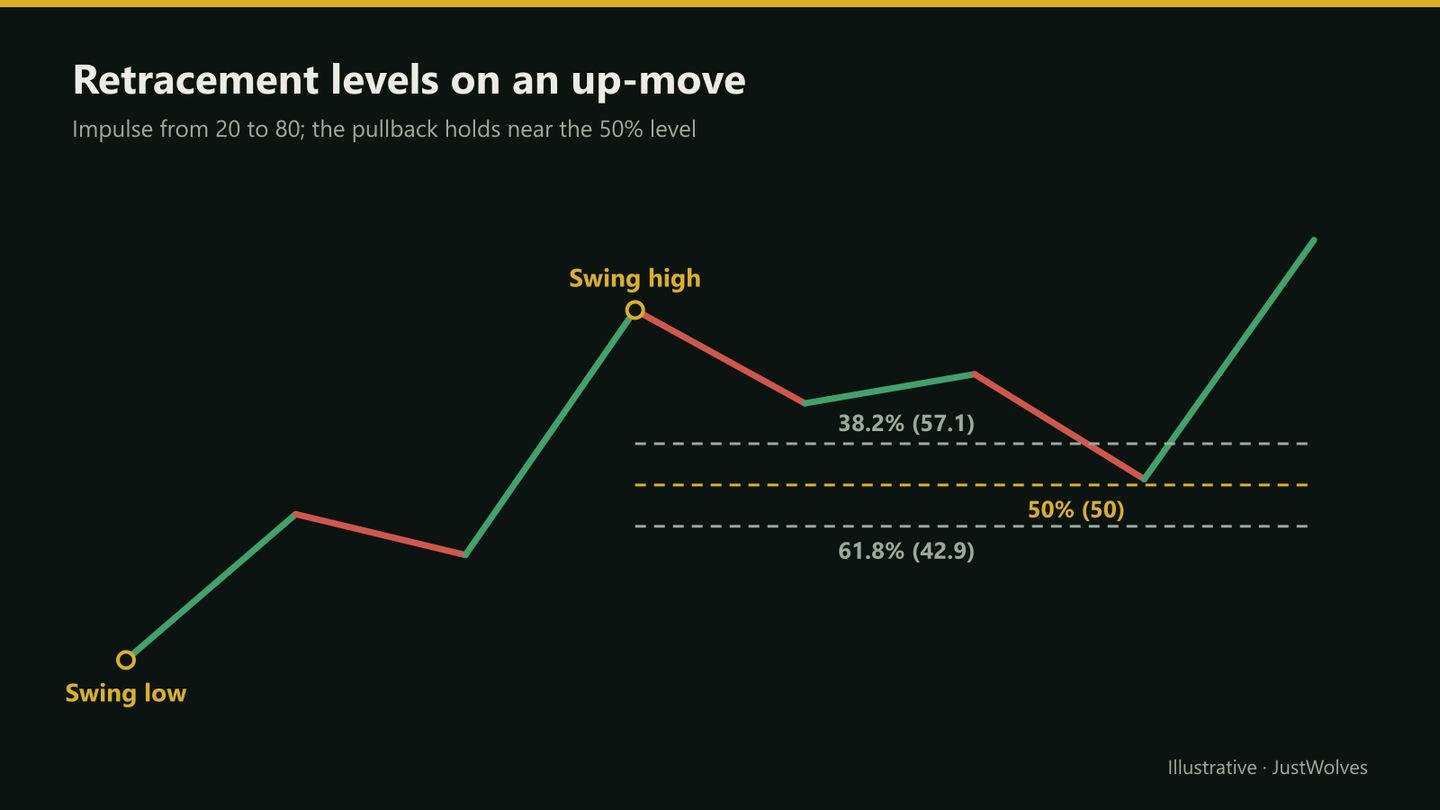
A pullback (or retracement) is a temporary move against the prevailing trend: a dip in an uptrend or a bounce in a downtrend. Trends rarely move in a straight line; they alternate between impulse moves in the trend's direction and pullbacks against it. Each pullback that holds above the previous low creates the next higher low.
How Deep Do Pullbacks Go?
Traders measure pullbacks as a percentage of the preceding impulse, often with a Fibonacci retracement tool. The most watched levels are 38.2%, 50% and 61.8%. Shallow pullbacks (around 38.2%) tend to occur in strong trends; deeper ones (61.8% and beyond) in weaker trends.
A Pullback Entry, Step by Step
The chart below follows the Nifty example in this lesson. Step through it to see the impulse, the confluence zone formed by a Fibonacci level, an old resistance level and a moving average, and the reaction that triggers the entry.
A pullback into a confluence zone
Step 1 of 5
The impulse
Nifty rallies from 23,800 to 24,600 on large candles that close near their highs. On the way it breaks an earlier resistance level at 24,180–24,220.
- What to observe
- A strong, clean move: the trend is up.
- Condition
- Wait for a pullback.
Real Case: A Two-Leg Pullback on NIFTY 50
The chart below uses real NIFTY 50 daily candles from May and June 2025, with retracement levels measured from the real impulse. Step through it to see a 55% pullback, a second leg that tested patience, and the trend resuming.
Real case: a two-leg pullback, NIFTY 50, May–June 2025
Step 1 of 5
The impulse
From a low of 23,936 on 9 May 2025, NIFTY surges to 25,116 by 15 May: 1,180 points in five sessions.
- What to observe
- A strong, fast move.
- Condition
- Wait for the pullback.
Healthy Pullback or Reversal?
| Healthy pullback | Possible reversal |
|---|---|
| Smaller, slower candles than the impulse | Large, fast candles against the trend |
| Holds above the last higher low | Closes below the last higher low |
| Lower volume than the impulse | Rising volume against the trend |
| Reaches a level and stalls | Cuts through several levels without pausing |
How Deep Do Pullbacks Really Go? Our Test
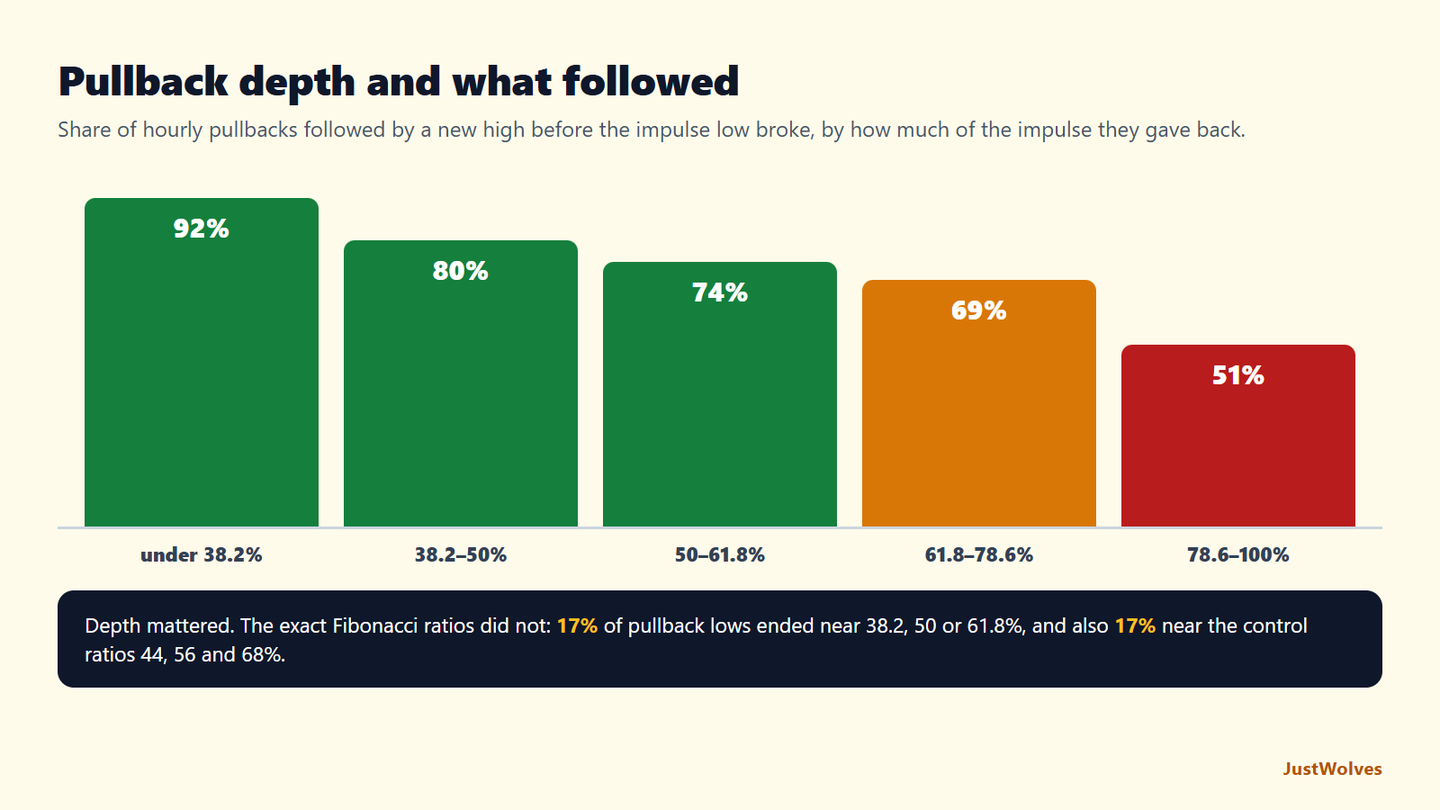
JustWolves measured every pullback after an impulse on about six months of real 1H candles for NIFTY 50, EUR/USD, GBP/USD, USD/JPY and gold, using five-candle swing points and testing downtrends on mirrored prices. Impulse: from a swing low to the next swing high, at least three average candle ranges long. Pullback depth: how much of the impulse the next swing low gave back. Continuation: price made a new high above the impulse before closing below the impulse's starting low.
| Pullback depth | Share of pullbacks | New high before the impulse low broke |
|---|---|---|
| Under 38.2% | 29% | 92% |
| 38.2% to 50% | 19% | 80% |
| 50% to 61.8% | 14% | 74% |
| 61.8% to 78.6% | 21% | 69% |
| 78.6% to 100% | 17% | 51% |
Two clear lessons come out of this.
Deeper pullbacks were weaker. After pullbacks of less than half the impulse, the trend made a new high about 80–90% of the time before failing. After pullbacks of more than 78.6%, it was a coin flip. Some of this is simple geometry, since a shallow pullback leaves price closer to the high, but it matches this lesson's guidance: shallow pullbacks belong to strong trends, and very deep ones are often the start of a reversal.
The Fibonacci ratios were not special. We counted how many pullback lows ended within two percentage points of 38.2%, 50% or 61.8%, and compared that with ratios chosen to be between them (44%, 56% and 68%). Both counts were 17%. Pullbacks did not cluster at Fibonacci levels any more than at arbitrary ratios. That is why this lesson's tip matters: a Fibonacci level is useful as a way to describe depth and to find confluence with real levels, not as a price where pullbacks are drawn to stop.
Step by Step: A Pullback Entry
Uptrend example
Step 1: Confirm the trend
Higher highs and higher lows on your trend timeframe.
Step 2: Mark the pullback zone
Retracement levels, prior support and moving averages; look for overlap.
Step 3: Wait for the pause
Price reaches the zone and slows.
Step 4: Trigger
A bullish reversal candle, or a break of a minor swing high on a lower timeframe.
Step 5: Risk
Stop below the pullback low (or the zone); target the prior high and beyond.
Three Pullback Shapes
- Simple dip: a few candles straight down into a level, then a reversal. Common in strong trends and the easiest to read.
- Two-leg pullback: a dip, a small bounce that fails, then a second dip that often reaches a deeper level. Many traders wait for the second leg rather than buying the first.
- Sideways pullback: price stalls in a small range instead of retracing, letting the moving average catch up. Entries come on the break of that small range in the trend's direction.
Knowing these shapes helps with patience. If the first dip doesn't reach your zone and the bounce is weak, a second leg is a real possibility, and buying the first dip may mean a stopped-out trade just before the actual turn. Recording which shape you're seeing also makes your journal more useful when you review results.
Practical Example
Hypothetically, Nifty rallies from 23,800 to 24,600 in two weeks. The 50% retracement is 24,200 and the 61.8% is 24,106. An earlier resistance level sits at 24,180–24,220, and the 20-day moving average is near 24,210.
Price pulls back on smaller candles to 24,215 and prints a hammer. Ritu buys Nifty futures at 24,260 with a stop at 24,140, below the zone, targeting 24,600: 120 points of risk for 340 points. If Nifty had closed below 24,100, she would have treated the pullback as a possible reversal.
Where Is the Pullback Wrong?
Every pullback trade needs a point where the idea is clearly wrong. There are three common choices, from tightest to widest:
- Below the reaction candle: the tightest stop. Good reward-to-risk, but it is often hit by a second leg of the pullback.
- Below the confluence zone: the choice in this lesson's example. If the whole zone fails, the pullback idea has failed.
- Below the impulse low: the widest. If price closes below where the impulse started, the trend structure is broken, which our data treats as the end of the pullback.
The table above suggests a practical rule. Once a pullback passes about 78.6% of the impulse, the odds of a new high have fallen to roughly even. Many traders stop treating the move as a pullback at that point, even before the impulse low breaks.
| Question | Stronger | Weaker |
|---|---|---|
| How deep? | Under 50% of the impulse | Over 78.6% |
| How fast? | Smaller candles than the impulse | Large candles against the trend |
| Where did it stop? | At a real level, ideally with confluence | In open space |
| Higher timeframe? | Trend in the same direction | Higher timeframe at resistance |
Common Mistakes
- Buying the first red candle in an uptrend.
- Treating Fibonacci levels as exact.
- Buying pullbacks in a trend that has already broken.
- Stops too tight inside the pullback zone.
- Averaging down as a pullback deepens.
Professional Insight
Many professional trend traders describe their job as waiting for pullbacks in strong markets. The entry is less important than the selection: a pullback in a clear trend, at a level that several tools agree on, with a defined invalidation point.
Risk Considerations
- Some pullbacks become reversals; the stop handles that.
- Shallow pullbacks in strong trends may not reach your level; you'll miss some moves.
- News can turn a pullback into a sharp drop.
Important Terminology
| Term | Meaning |
|---|---|
| Pullback | A temporary move against the trend. |
| Retracement | A pullback measured as a percentage of the prior move. |
| Fibonacci levels | Common retracement levels: 38.2%, 50%, 61.8%. |
| Impulse | A strong move in the trend's direction. |
| Confluence | Several levels or tools agreeing on one area. |
What is a pullback in trading?
A temporary move against the trend, such as a dip in an uptrend, which offers a chance to enter in the trend's direction at a better price.
How deep do pullbacks usually go?
Often between 38.2% and 61.8% of the prior move, with shallower pullbacks in stronger trends.
How do I know a pullback is over?
Look for a reversal candle or a lower-timeframe break of structure at a level, ideally with falling volume during the pullback.
What is the difference between a pullback and a reversal?
A pullback holds the trend's last swing; a reversal breaks it and starts a new trend structure.
Should I use Fibonacci for pullbacks?
It's a useful reference, best combined with prior support or resistance and moving averages.
Do pullbacks stop at Fibonacci levels?
Not more often than at other ratios in our data. On real 1H charts, 17% of pullback lows ended within two percentage points of 38.2%, 50% or 61.8%, exactly the same as for control ratios of 44%, 56% and 68%.
How deep can a pullback go before the trend is in doubt?
In our 1H data, pullbacks of less than half the impulse were followed by a new high 80–90% of the time, while pullbacks deeper than 78.6% were followed by a new high only about half the time.
What is a two-leg pullback?
A pullback that dips, bounces without making a new high, then dips again before the trend resumes. In a real NIFTY example from May–June 2025, the first leg reached 24,462 (a 55% retracement), a second leg held at 24,502, and the index then made new highs.
Practical Exercise
Measure ten pullbacks.
Your task
Step 1: Find ten pullbacks
In clear daily uptrends.
Step 2: Measure depth
As a percentage of the prior impulse.
Step 3: Note confluence
Was there a prior level or MA at the turn?
Step 4: Summarise
What depth was most common in your sample?
Check Your Understanding
A pullback is:
Related Lessons
Previous: Consolidation and Trading Ranges. Next: Reversals, Momentum and Exhaustion. See also Dynamic Support and Resistance.