
Reversal Chart Patterns: Head and Shoulders, Double Tops and Bottoms
JustWolves is an educational platform and is not a SEBI-registered investment advisor. Trading financial instruments involves significant risk of loss and may not be suitable for all investors. Past performance is not indicative of future results. Read our full disclaimer →
What you'll learn
- Reversal patterns show a trend failing to continue, then breaking its structure
- Head and shoulders: three peaks with the middle highest; the neckline joins the two troughs
- Double top: two similar highs with a trough between; the trough is the confirmation level
- A pattern is only complete on a close through the neckline; before that it's a possibility
- The measured-move target is the pattern's height projected from the break; treat it as a guide
In this article · 17 sections
Chart patterns are recurring shapes that price makes as trends end or pause. Reversal patterns are the shapes associated with a trend running out: the market tries to continue, fails, and finally breaks the level that held the trend together. This lesson covers the most widely followed reversal patterns, the head and shoulders and the double top and bottom, and how to trade them with defined risk.
What You Will Learn
- How head and shoulders and double tops and bottoms form
- Where the neckline is and why it matters
- How to measure a pattern target
- Entry, stop and common failure points
Before You Start
Read Reversals, Momentum and Exhaustion and Volume Analysis first.
Why Reversal Patterns Form
In an uptrend, each new high is followed by a higher low. A reversal pattern records the moment that sequence fails: a push makes no new high (or only a marginal one), and the next decline breaks the low that supported the trend. The patterns in this lesson are simply common shapes that failure takes. They're the same idea as the break of structure in the previous module, drawn with names.
Head and Shoulders
A head and shoulders top has three peaks: a left shoulder, a higher head, and a lower right shoulder. The neckline connects the troughs between them. It can be horizontal or sloped.
The right shoulder is the important part: it's the first rally that fails to make a new high, a lower high. The pattern completes when price closes below the neckline.
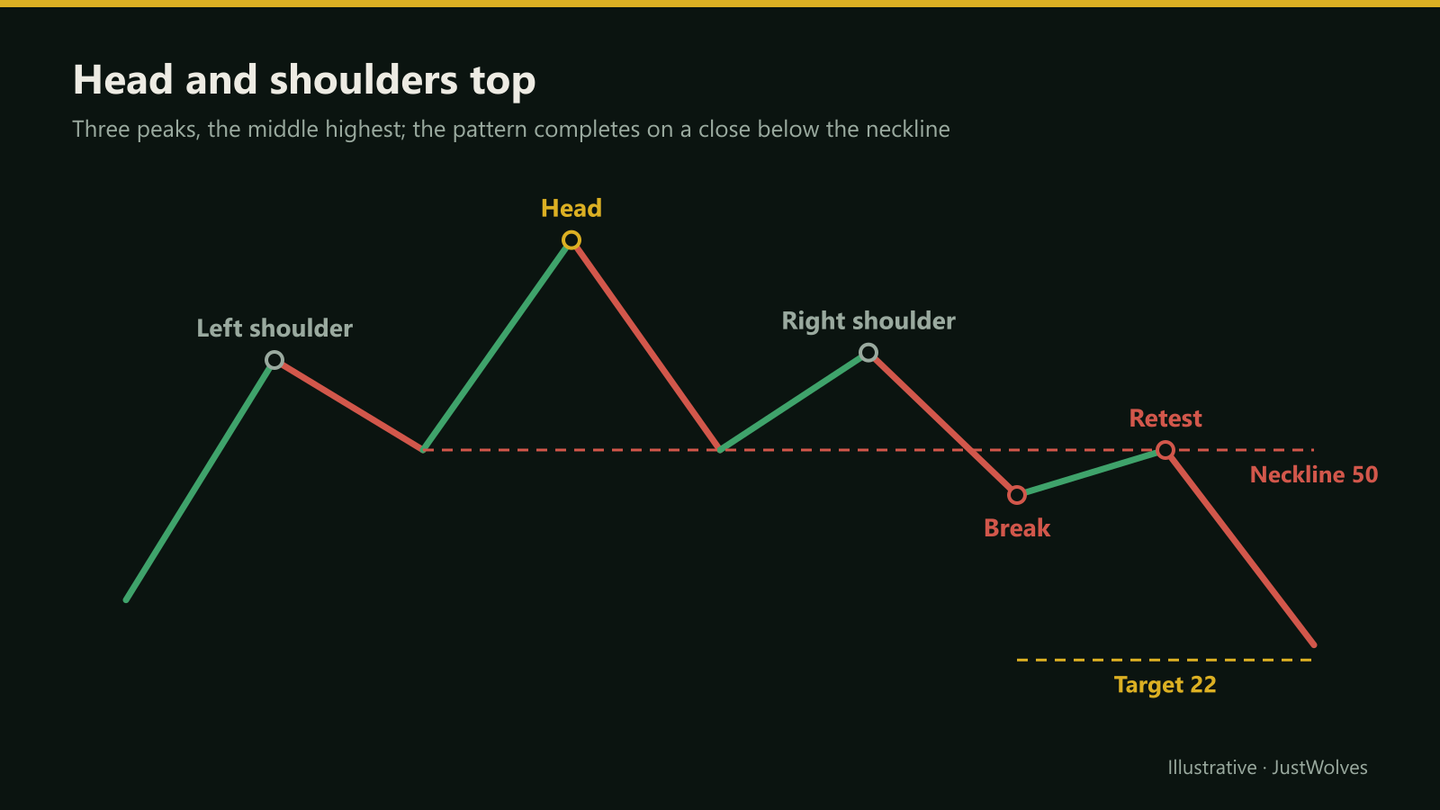
The inverse head and shoulders is the mirror image at the end of a downtrend: three troughs with the middle lowest, completing on a close above the neckline.
Double Tops and Double Bottoms
A double top forms when price reaches a high, pulls back to a trough, rallies to roughly the same high and fails again. The trough between the two highs is the confirmation level: a close below it completes the pattern.
A double bottom is the mirror: two similar lows with a peak between them, confirmed by a close above that peak. The second test often comes with a liquidity sweep slightly beyond the first low, which some traders treat as a stronger version of the pattern.
Measuring the Target
The common measured-move method takes the height of the pattern, from the head (or the tops) to the neckline, and projects it from the break point. It's a guide to where the move might reach, not a prediction. Many traders take partial profit at the next support level if it comes first.
Trading a Reversal Pattern
| Element | Common approach |
|---|---|
| Context | A clear prior uptrend; the pattern forms at or near resistance |
| Entry | On the close below the neckline, or on a retest of the neckline from below |
| Stop | Above the right shoulder (wider) or above the retest high (tighter) |
| Target | Measured move, or the next support level if nearer |
| Volume | Often lighter on the right shoulder and heavier on the break |
A Head and Shoulders, Step by Step
The chart below follows the cement stock example in this lesson. Step through it to see each part of the pattern form, the neckline break that completes it, and the retest entry with two targets.
Head and shoulders: from left shoulder to first target
Step 1 of 5
Left shoulder and head
In an uptrend, the stock peaks at 1,180 (the left shoulder), dips to about 1,120, rallies to a higher peak at 1,240 (the head) and dips back to about 1,120.
- What to observe
- A new high, but the dips are holding at the same level.
- Condition
- Nothing to do yet.
How Do Reversal Patterns Perform? Our Test
JustWolves detected these patterns mechanically on about six months of real 1H candles for NIFTY 50, EUR/USD, GBP/USD, USD/JPY and gold, using five-candle swing points, with bottoms tested as mirrored tops.
Double top: two swing highs within half an average candle range of each other, with a pattern height of at least two average ranges. Head and shoulders: three swing highs with the middle one highest. Confirmation: a close below the trough (or the lower of the two troughs, for the neckline) within 30 candles, before any new high. Trade: short at the confirming close, stop just above the second top or the right shoulder. As a baseline, we used every close below the low between two swing highs that were not level: an ordinary break of structure.
| Pattern | Trades | Winners at 1.5R | Average at 1.5R | Average at the measured target |
|---|---|---|---|---|
| Double top or bottom | 142 | 39% | −0.01R | −0.06R |
| Head and shoulders (and inverse) | 136 | 36% | −0.10R | −0.01R |
| Baseline: any break between two swing highs | 517 | 32% | −0.19R | n/a |
Both patterns did better than an ordinary break of structure: more winners and smaller average losses. That supports the idea at the heart of this lesson: a failed new high (the second top or the right shoulder) before the break adds information. But neither pattern was profitable on its own with these simple rules; both were close to break-even before costs.
This fits the lesson's Professional Insight. The shape matters less than the structure under it, and the context around it: a prior trend to reverse, a pattern at higher-timeframe resistance, and a reasonable target. Our mechanical version had none of those filters. If you trade these patterns, the filters are where you should expect any edge to come from, and the measured target should be treated as a guide, with partial profits at the first support.
Practical Example
Hypothetically, a cement stock rallies to a left shoulder at ₹1,180, a head at ₹1,240 and a right shoulder at ₹1,190, with troughs near ₹1,120 forming a flat neckline. The pattern's height is ₹120.
The stock closes at ₹1,108, below the neckline, on above-average volume, then bounces to ₹1,122 and stalls. Meera shorts stock futures at ₹1,115 with a stop at ₹1,145, above the retest, and a first target at ₹1,040, a prior support, before the measured target at ₹1,000. Risk is ₹30; reward to the first target is ₹75.
Measuring Targets: Worked Examples
| Pattern | Height | Break point | Measured target |
|---|---|---|---|
| Head and shoulders top: head 1,240, neckline 1,120 | 120 | 1,120 | 1,000 |
| Double top: tops 2,480, trough 2,400 | 80 | 2,400 | 2,320 |
| Double bottom: lows 520, peak 556 | 36 | 556 | 592 |
| Inverse head and shoulders: head 23,600, neckline 24,100 | 500 | 24,100 | 24,600 |
For a sloped neckline, measure the height vertically from the head to the neckline directly below it, and project that distance from the point where price actually broke the neckline. Many traders take part of the position off at the first support or resistance level on the way, as in this lesson's example, and let the rest run towards the measured target with the stop moved to breakeven.
When the Pattern Fails
A pattern fails when price closes back above the neckline (for a top) after the break, or makes a new high above the head. Failed patterns can move sharply, because traders who shorted the break are forced to buy back. Some traders treat a failed head and shoulders as a signal in the opposite direction. Whatever you do, the stop above the right shoulder or the retest high is what limits the damage, so never move it further away once the trade is on.
Common Mistakes
- Shorting before the neckline breaks.
- Seeing patterns in sideways noise with no prior trend to reverse.
- Treating the measured target as certain.
- Stops too close to the neckline, where retests often reach.
- Ignoring the higher timeframe: a daily top inside a strong weekly uptrend often fails.
Professional Insight
Experienced traders tend to care less about the textbook shape and more about the structure underneath it: a lower high, then a break of the last higher low. If you can see that, the name of the pattern matters little. If you can't, a perfect-looking shape doesn't help.
Risk Considerations
- Failed patterns can reverse sharply as trapped traders exit.
- Wide patterns need wide stops; reduce position size.
- Gaps can skip the neckline entirely.
Important Terminology
| Term | Meaning |
|---|---|
| Head and shoulders | Three peaks with the middle highest; a bearish reversal pattern. |
| Neckline | The line connecting the pattern's troughs (or peaks). |
| Double top | Two similar highs with a trough between them. |
| Measured move | Pattern height projected from the break. |
| Retest | A return to the broken neckline from the other side. |
What is a head and shoulders pattern?
A reversal pattern with three peaks, the middle one highest, that completes when price closes below the neckline joining the troughs.
How do I trade a double top?
Wait for a close below the trough between the two highs, then enter on the close or a retest, with a stop above the retest or the tops.
How is the head and shoulders target calculated?
Measure from the head to the neckline and project that distance from the break point.
How reliable are reversal patterns?
They fail often enough that a stop is essential. Reliability varies with context, so test them on your own markets.
What is an inverse head and shoulders?
The mirror pattern at the end of a downtrend, completing on a close above the neckline.
How reliable is the head and shoulders pattern?
Modestly. In our test on real 1H data, mechanically detected head and shoulders patterns won 36% of trades with a 1.5R target, slightly better than an ordinary break of structure (32%) but still close to break-even. Context and partial profits matter.
Is a double top better than a normal break of structure?
In our data, yes, slightly: double tops and bottoms won 39% of 1.5R trades against 32% for ordinary structure breaks, and their average result was close to break-even rather than a clear loss.
Practical Exercise
Find and grade five patterns.
Your task
Step 1: Find five patterns
Head and shoulders or double tops/bottoms on daily charts.
Step 2: Check context
Was there a clear prior trend?
Step 3: Mark the neckline
And the measured target.
Step 4: Record outcome
Did price reach the target, the next support, or reverse?
Check Your Understanding
In a head and shoulders top, the head is:
Related Lessons
Previous module: Volume Analysis. Next: Continuation Patterns. Trading the breakouts of these patterns is covered in the Breakout Trading course.