
Continuation Patterns: Triangles, Flags, Pennants and Wedges
JustWolves is an educational platform and is not a SEBI-registered investment advisor. Trading financial instruments involves significant risk of loss and may not be suitable for all investors. Past performance is not indicative of future results. Read our full disclaimer →
What you'll learn
- Continuation patterns are pauses within a trend that often resolve in the trend's direction
- Flags and pennants follow a sharp move (the pole) and are short, tight consolidations
- Triangles are drawn with converging trendlines; ascending, descending and symmetrical forms differ in which side is flat
- Wedges slope against the trend; a rising wedge in an uptrend is often read as a warning
- Trade the close outside the pattern, with the stop back inside it
In this article · 15 sections
Most of the time, trends pause before they continue. Those pauses often take recognisable shapes: a small channel sloping against the trend after a sharp move, or a contracting triangle as highs and lows converge. These are continuation patterns. This lesson covers the main ones, how to draw them, and how to trade the breakout without assuming every pause will resolve in the trend's favour.
What You Will Learn
- How flags and pennants form
- The three types of triangle
- How wedges differ, and why some are warnings
- Entries, stops and measured targets
Before You Start
Read Reversal Chart Patterns and Trendlines and Price Channels first.
Flags and Pennants
A flag starts with a sharp, near-vertical move called the pole. Price then drifts in a small channel against the trend, usually on lighter volume. A bull flag slopes down after a rally; a bear flag slopes up after a drop.
A pennant is similar, but the pause forms a small symmetrical triangle instead of a channel. Both are short: often a handful of candles to a few weeks on a daily chart.
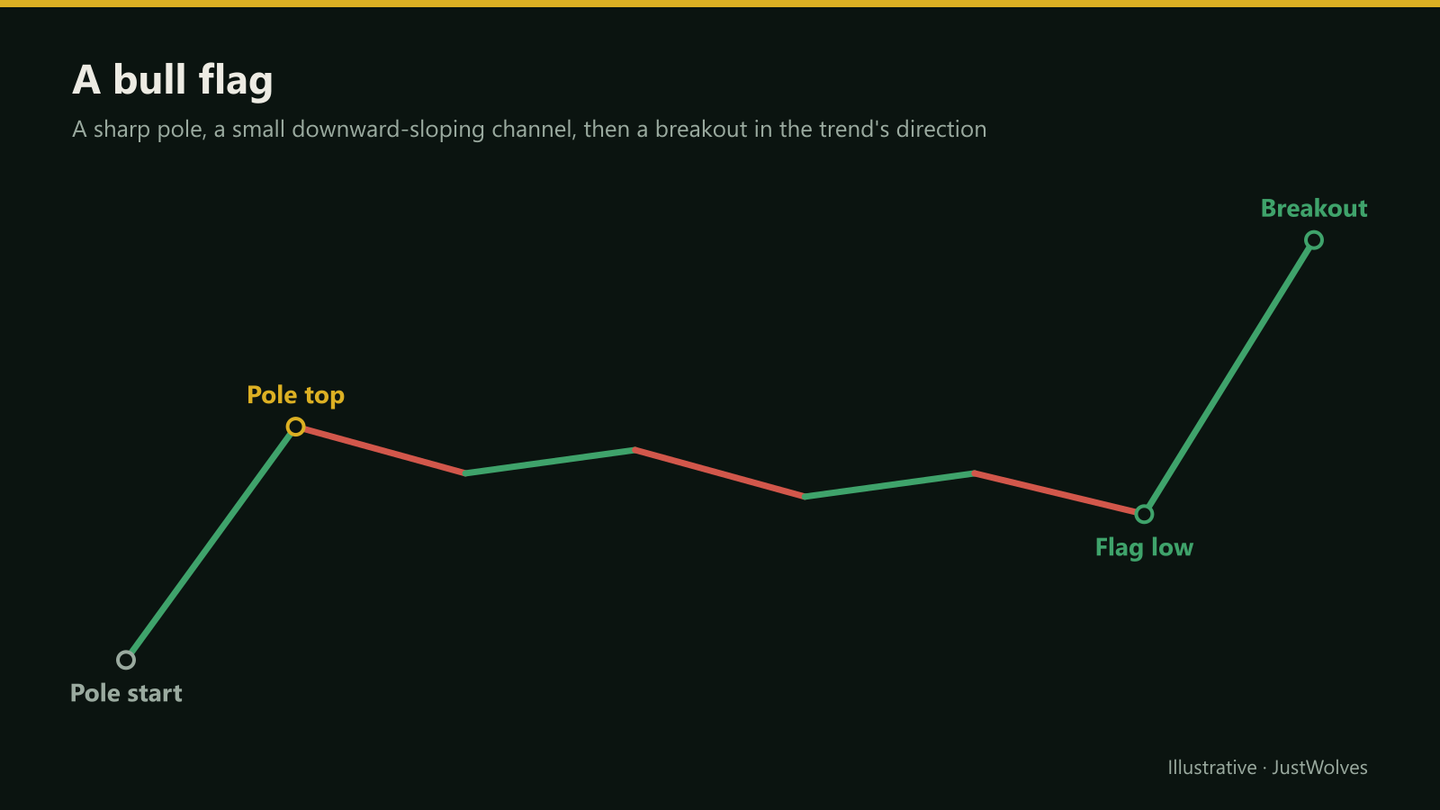
A Bull Flag, Step by Step
The chart below follows the defence stock example in this lesson: the pole, the flag channel, the breakout and the measured move. Step through it and notice how small the stop is compared with the pole.
A bull flag from pole to measured move
Step 1 of 5
The pole
The stock rallies from 240 to 290 in six sessions: a 50-point pole made of strong candles closing near their highs.
- What to observe
- A sharp move is what makes a flag possible.
- Condition
- Watch for a tight pause.
Triangles
| Type | Shape | Usual reading |
|---|---|---|
| Ascending | Flat top, rising lows | Buyers pressing a fixed resistance; often breaks up |
| Descending | Flat bottom, falling highs | Sellers pressing a fixed support; often breaks down |
| Symmetrical | Falling highs and rising lows | Balanced; usually read in the direction of the prior trend |
Draw triangles with at least two touches on each line. Breakouts that happen well before the apex (the point where the lines meet) are generally considered stronger than those that drift right into it.
Wedges
A wedge has two converging lines that slope in the same direction. A falling wedge slopes down; a rising wedge slopes up.
In an uptrend, a falling wedge is a common continuation pattern (a pullback losing momentum). A rising wedge in an uptrend, where each push makes less progress, is more often read as a sign of exhaustion. Context decides which reading applies.
Trading the Breakout
Bull flag or ascending triangle
Step 1: Confirm the trend
A clear uptrend with a strong move into the pattern.
Step 2: Draw the pattern
Channel or trendlines with at least two touches each.
Step 3: Wait for the close
A candle closes above the upper line, ideally on rising volume.
Step 4: Entry and stop
Enter on the close or on a retest; stop below the last swing low inside the pattern.
Step 5: Target
Pole height (flags) or pattern height (triangles) from the breakout, or the next resistance.
Volume and Duration
Volume often helps separate a healthy pause from a weakening trend. During a flag or triangle, volume usually contracts as fewer participants trade the pause; on the breakout, it typically expands. A breakout from a pattern on thin volume deserves more caution, as covered in Volume Analysis.
Duration matters too. Flags and pennants are usually brief relative to the pole; a flag that keeps drifting for much longer than the pole took to form is often losing its character, and may turn into a deeper pullback or a range. Triangles on daily charts commonly develop over several weeks. When a pattern lasts far longer than is typical for its type on your timeframe, treat it as a range and use the tools from Consolidation and Trading Ranges instead.
Hypothetically, a defence stock rallies from ₹240 to ₹290 in six sessions: a ₹50 pole. It then drifts down in a narrow channel to ₹278 over eight sessions on falling volume.
The stock closes at ₹287, above the channel's upper line, on volume twice the 20-day average. Arjun buys at ₹288 with a stop at ₹276, below the flag low, targeting ₹330: the ₹50 pole added to the ₹280 breakout area. Risk is ₹12 for ₹42 of potential reward.
How Do Flags Perform? Our Test
JustWolves detected flags mechanically on about six months of real 1H candles for NIFTY 50, EUR/USD, GBP/USD, USD/JPY and gold, with bear flags tested on mirrored prices.
Pole: a rise of at least three average candle ranges within six candles. Flag: 3 to 12 candles with no new high, giving back no more than half the pole. Entry: the first close above the flag's high. Stop: just below the flag low. We tested a 1.5R target and the measured move (pole height added to the flag high). As a control, we used every close above the previous eight-candle high, with the same stop and target rule but no pole.
| Setup | Trades | Winners | Average per trade |
|---|---|---|---|
| Flag breakout, 1.5R target | 110 | 34% | −0.16R |
| Flag breakout, measured-move target | 112 | 25% | −0.24R |
| Control: any break of an 8-candle high, 1.5R target | 620 | 37% | −0.08R |
Mechanically detected flags did not beat ordinary breakouts. They won 34% of 1.5R trades against 37% for the control, and reached the full measured move only a quarter of the time. That is a useful corrective to textbook examples, which are chosen because they worked.
Two things are worth taking from this. First, the measured move is an ambitious target; a fixed reward-to-risk target or a partial exit at the next level is more realistic. Second, the lesson's tip that "the pole is the pattern" is right in spirit, but a strong pole alone did not make our breakouts more reliable. The context this lesson describes, a clear trend, a pattern that is short relative to its pole, and expanding volume on the breakout, is where any advantage has to come from, and it should be tested before it is trusted.
Measured Targets for Each Pattern
| Pattern | Height used | Projected from |
|---|---|---|
| Flag or pennant | The pole | The breakout point |
| Ascending or descending triangle | The widest part of the triangle | The breakout point |
| Symmetrical triangle | The widest part of the triangle | The breakout point |
| Wedge | Usually back to the start of the wedge | The breakout point |
A worked example: an ascending triangle on a Nifty stock has a flat top at ₹540 and a first low at ₹500, so its widest part is ₹40. A close above ₹540 gives a measured target of ₹580. A more conservative plan takes half the position off at the next resistance level, and moves the stop to breakeven once that is reached.
Common Mistakes
- Calling any pause a flag without a strong pole.
- Entering inside the pattern before the breakout.
- Forcing trendlines through candle bodies to make a shape fit.
- Ignoring wedge direction relative to the trend.
- Holding after a failed breakout that closes back inside.
Professional Insight
Continuation patterns are popular because they combine a trend, a defined pause and an objective breakout level. Many traders find flags after strong poles the most practical of them, simply because the stop is small relative to the move that preceded it.
Risk Considerations
- Breakouts fail; the Breakout Trading course covers false breakouts.
- Patterns that drag on tend to lose their edge.
- News can break patterns in either direction.
Important Terminology
| Term | Meaning |
|---|---|
| Pole | The sharp move before a flag or pennant. |
| Flag | A small channel sloping against the trend after a pole. |
| Pennant | A small symmetrical triangle after a pole. |
| Triangle | Converging trendlines, one or both sloped. |
| Wedge | Converging lines sloping in the same direction. |
What is a bull flag?
A short, downward-sloping consolidation after a sharp rally, which often resolves with a breakout to the upside.
What is the difference between a flag and a pennant?
A flag is a small parallel channel; a pennant is a small symmetrical triangle. Both follow a sharp pole.
Which way do triangles break?
Ascending triangles more often break up, descending triangles more often down, and symmetrical triangles are usually read in the direction of the prior trend. None of these is guaranteed.
Is a rising wedge bullish or bearish?
It's commonly read as bearish, especially in an uptrend, because each push makes less progress.
How do I set a target for a flag?
Add the pole's height to the breakout point, and check for resistance in between.
How reliable are bull flags?
Less reliable than textbook examples suggest. In our test on real 1H data, mechanically detected flag breakouts won 34% of trades with a 1.5R target, slightly fewer than ordinary breakouts of recent highs (37%), and reached the pole-height target only 25% of the time.
What target should I use for a flag?
The pole height added to the breakout is the classic target, but it was reached only about a quarter of the time in our data. A fixed reward-to-risk target, or a partial exit at the next level, is more realistic.
Practical Exercise
Collect ten patterns.
Your task
Step 1: Find ten patterns
Flags, pennants, triangles or wedges in trending daily charts.
Step 2: Draw them
With at least two touches per line.
Step 3: Record the breakout
Direction and volume relative to average.
Step 4: Check the target
Did price reach the measured move?
Check Your Understanding
A flag needs:
Related Lessons
Previous: Reversal Chart Patterns. Next: Price Action Entry Triggers and Confluence. See also Consolidation and Trading Ranges.