
How to Draw Support and Resistance Levels Correctly
JustWolves is an educational platform and is not a SEBI-registered investment advisor. Trading financial instruments involves significant risk of loss and may not be suitable for all investors. Past performance is not indicative of future results. Read our full disclaimer →
What you'll learn
- Draw only levels that pass at least one of two tests: multiple rejections, or a strong move away
- Mark role-reversal levels where broken support or resistance has been retested
- Keep only levels near current price; three or four is plenty
- Draw zones from the wicks to the bodies of the reaction candles
- A level tells you where to watch; wait for confirmation before acting
In this article · 18 sections
Most traders who struggle with support and resistance don't have too few lines on their chart; they have too many. A chart covered in levels hides the few that matter. This lesson gives you four rules for deciding which levels to draw, a method for drawing them as zones, and a simple confirmation process for trading them.
What You Will Learn
- The four rules for choosing levels
- How to draw zones accurately
- How to keep your chart clean
- A three-step confirmation process for trading levels
Before You Start
Read What Is Support and Resistance? first.
Why Most Traders Get It Wrong
- Too many lines: ten levels mean price is always 'at a level', which tells you nothing.
- Exact lines: price overshoots, and the trader calls a break that isn't one.
- Old, distant levels: a level from two years ago, far from price, doesn't affect today's decision.
Rule 1: Multiple Rejections
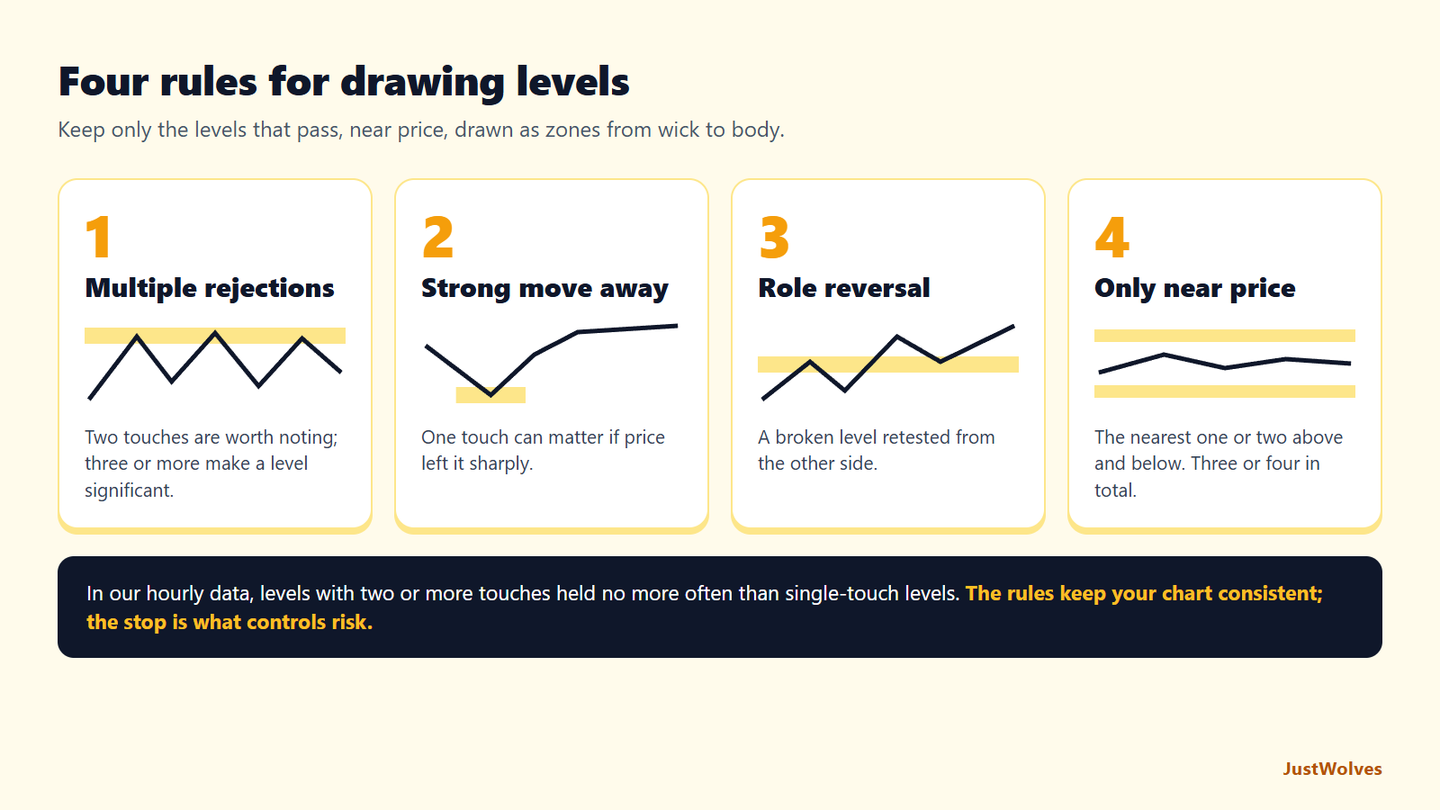
The strongest levels are where price has turned more than once. Two touches make a level worth noting; three or more make it significant. Each rejection shows that traders acted at that price before.
Rule 2: A Strong Move Away
A level touched only once can still matter if price moved away from it strongly: a sharp, sustained rally from a swing low, not a small bounce. The strength of the move suggests significant buying there. Many such levels are later retested.
Rule 3: Role Reversal
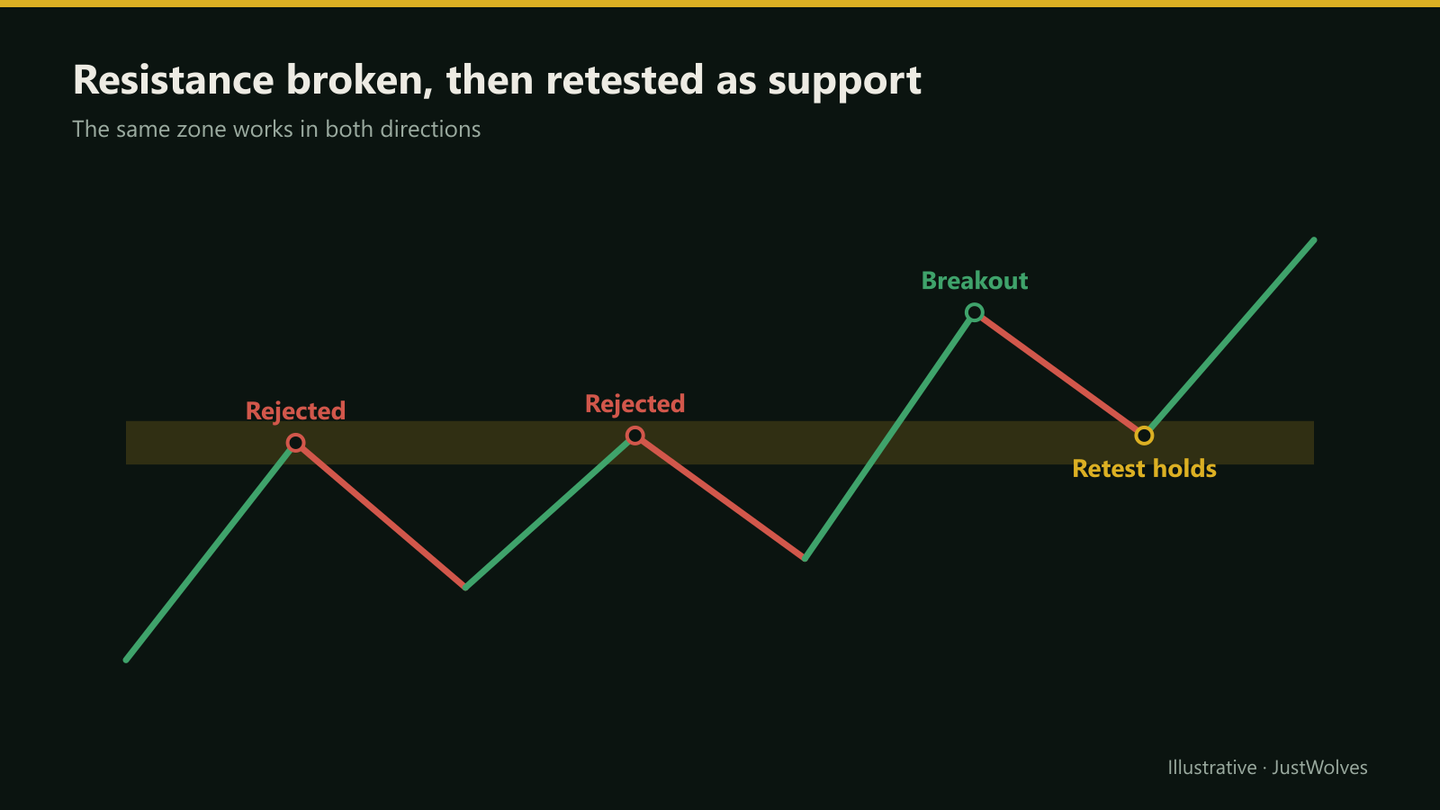
When a level breaks with a decisive close and price later returns to it from the other side, mark it. Retests of broken levels are among the most widely watched setups in price action.
Rule 4: Only Levels Near Price
Keep the nearest one or two levels above and below current price, on your trading timeframe and the one above it. Remove levels price isn't approaching. Distant levels come back into play only when price heads towards them.
Drawing the Zone
Zone method
Step 1: Find the reaction candles
The candles that turned at the level.
Step 2: Outer edge
Use the extreme wicks of those candles.
Step 3: Inner edge
Use the bodies (opens or closes) nearest the level.
Step 4: Check width
If the zone is wider than about one average daily range, it's probably two levels; split it or tighten it.
Step 5: Label it
Timeframe and number of touches, so you remember its strength.
Draw levels on the timeframe above the one you trade first, then refine them on your own timeframe. A daily zone may be 60 points wide on Nifty; on the 1-hour chart you can often see which part of that zone price actually reacted to, and tighten the zone to that area. Keep the higher-timeframe version in mind, though: if price overshoots your tighter zone but stays within the daily one, the level hasn't necessarily failed.
The Four Rules on One Chart
The chart below applies this lesson's rules to the practical example: two levels from multiple rejections, one from a strong move away, and a role reversal that sets up the trade. Step through it and notice that every price in the final plan, entry, stop and target, comes from one of the levels.
Applying the four rules: three levels, one trade
Step 1 of 5
Rule 1: multiple rejections
Price turns down twice near 2,492–2,494 and up three times near 2,412–2,418. Both pass Rule 1. Drawn wick to body, they become zones: resistance 2,480–2,495 and support 2,410–2,430.
- What to observe
- Repeated turns, drawn as zones.
- Condition
- Two levels kept out of many candidates.
Real Case: The Four Rules on NIFTY 50
The chart below applies this lesson's rules to real NIFTY 50 daily candles from September to November 2025: two rejections, a strong move away, a break and a role-reversal retest. Step through it to see which levels the rules keep and how each one was used.
Real case: the four rules on NIFTY 50, September–November 2025
Step 1 of 5
Rule 1: the first rejection
NIFTY reaches 25,449 on 18 September 2025 and turns down. One rejection: worth noting, not yet significant.
- What to observe
- A top at 25,449.
- Condition
- Mark it lightly.
Trading a Level: Three Confirmations
- Location: price is at a level that passes the rules. This is where you start watching, not where you enter.
- Reaction: a reversal candle at the level, such as a hammer or bullish engulfing at support, or a shooting star or bearish engulfing at resistance (see the Candlestick Patterns course).
- Context: the trade agrees with the higher-timeframe trend, or a moving average or other tool supports it.
With all three, enter after the confirming candle closes, with a stop beyond the zone and a target before the next opposing level.
What the Data Says About the Rules
JustWolves tested the first and third rules mechanically on about six months of real 1H candles for NIFTY 50, EUR/USD, GBP/USD, USD/JPY and gold, with resistance tested on mirrored prices. Each level was a five-candle swing point. On the first return to it, the level held if price bounced one average candle range, and broke if a candle closed clearly through it. We compared real levels with placebo lines placed where no level existed.
| Level | Cases | Held |
|---|---|---|
| Single touch | 907 | 56% |
| Two or more touches (Rule 1) | 1,067 | 56% |
| Broken and retested (Rule 3) | 1,592 | 57% |
| Placebo line, no level | 548–1,515 | 57–59% |
Two touches did not make a level hold more often than one, and none of the level types beat the placebo lines. That is an honest and important result: the four rules do not find levels that are more likely to hold. What they do is keep your chart down to a few consistent, objective places to plan around, so that your entries, stops and targets come from the same method every time. That consistency is what makes your results measurable and your risk controlled.
The confirmation process in this lesson matters for the same reason. Waiting for location, reaction and context will not turn a level into a prediction, but it gives you a tighter stop just beyond the reaction, and filters out many trades you would otherwise take on touch alone.
How Wide Should a Zone Be?
The data gives a much clearer answer to this question. On the touches that did hold, price first traded beyond the exact swing price 83% of the time. The median overshoot was a quarter of the average candle range; three in four overshoots were within about half an average candle range, and nine in ten within about 0.8.
So the "Check width" step in this lesson has a practical rule behind it. A zone roughly half an ATR deep (the average true range of your timeframe), drawn from the wick into the bodies, contains most of the noise around a level. The stop belongs beyond the zone, with a further buffer. Zones much wider than one ATR usually combine two levels, as this lesson says, and should be split.
| Item | Daily Nifty example |
|---|---|
| 14-day ATR | 200 points |
| Zone depth (about half an ATR) | about 100 points |
| Stop buffer beyond the zone | 50–100 points |
| Zone wider than one ATR? | Probably two levels: split it |
Practical Example
Hypothetically, on the daily chart of a large FMCG stock, Arvind finds eight possible levels. Applying the rules, he keeps three: support at ₹2,410–₹2,430 (three rejections), resistance at ₹2,560–₹2,580 (strong move away from a swing high), and an old resistance at ₹2,480–₹2,495 that was broken and retested.
Price pulls back to ₹2,488 in an uptrend and prints a bullish engulfing candle. Arvind buys at ₹2,500 after the close, with a stop at ₹2,470 and a target of ₹2,555, just below resistance: ₹30 of risk for ₹55 of reward.
A Weekly Redrawing Routine
The Professional Insight below suggests redrawing levels from scratch each week. A simple routine that takes about ten minutes per chart:
- Delete everything from the trading timeframe and the one above it.
- Start on the higher timeframe. Mark the nearest level above and below price that passes Rule 1, 2 or 3.
- Drop to your trading timeframe. Refine those zones to the area where price actually reacted, and add at most one more level on each side.
- Measure the zones against the current ATR and split any that are too wide.
- Write the plan: for each level, what you would do if price reaches it, and what would make you skip it.
The written plan is what turns levels into decisions. Without it, a level is just a line that is easy to justify after the fact.
Common Mistakes
- Keeping every level 'just in case'.
- Lines instead of zones.
- Entering on touch without a reaction.
- Targets beyond the next opposing level.
- Never removing old levels.
Professional Insight
Experienced traders often redraw levels from scratch each week rather than adding to old drawings. Starting fresh forces you to choose only what's relevant now, and keeps yesterday's assumptions from cluttering today's chart.
Risk Considerations
- Wide zones need wider stops and smaller positions.
- News can cut through any level.
- Round-number levels attract stop runs.
Important Terminology
| Term | Meaning |
|---|---|
| Rejection | Price turning away from a level. |
| Strong move away | A sharp, sustained move from a swing point. |
| Role reversal | A broken level acting in the opposite role. |
| Zone | A price band from wicks to bodies of reaction candles. |
| Confirmation | Evidence, such as a reversal candle, that a level is holding. |
How do I draw support and resistance correctly?
Mark only levels with multiple rejections, a strong move away, or a role reversal, near current price, and draw them as zones from wicks to bodies.
How many support and resistance levels should I draw?
Usually three or four: the nearest one or two above and below current price.
Should I use wicks or bodies?
Both: wicks for the outer edge of the zone, bodies for the inner edge.
Do I enter as soon as price touches a level?
No. Wait for a reaction, such as a reversal candle, and check the trade agrees with the bigger trend.
What makes a level strong?
Several rejections, a strong move away, visibility on higher timeframes, and a clean history of reactions.
Are levels with more touches stronger?
Not in our data. On real 1H charts, swing levels with two or more earlier touches held on the next test 56% of the time, the same as single-touch levels, and no better than placebo lines with no level at all.
How wide should a support or resistance zone be?
About half an ATR of your timeframe is a practical starting point. In our data, three in four overshoots through a level that held were within about half an average candle range. Zones much wider than one ATR usually combine two levels.
What does a real role-reversal retest look like?
Often slightly messy. In a real NIFTY example from November 2025, the retest of a broken resistance zone at 25,330–25,450 dipped to 25,318, a few points below the zone, then closed back above it and rallied.
Practical Exercise
Clean up a chart.
Your task
Step 1: Mark every level you can see
On one daily chart.
Step 2: Apply the four rules
Delete anything that fails.
Step 3: Draw zones
For the three or four that remain.
Step 4: Compare
Which version makes the next decision clearer?
Check Your Understanding
Which rule keeps charts clean?
Related Lessons
Previous: What Is Support and Resistance?. Next: Dynamic Support and Resistance: Moving Averages. Later: Price Rejection at Key Levels.