
Position Sizing and the 1% Rule: How Much to Buy on Every Trade
JustWolves is an educational platform and is not a SEBI-registered investment advisor. Trading financial instruments involves significant risk of loss and may not be suitable for all investors. Past performance is not indicative of future results. Read our full disclaimer →
What you'll learn
- Position size = rupee risk ÷ loss per unit if the stop is hit
- Rupee risk is a fixed share of your account; many traders use 0.5–1%
- Always round the size down, never up
- In F&O you trade whole lots, so if one lot risks more than your limit, skip the trade or use a smaller instrument
- Check the total position value as well as the risk, so one trade doesn't tie up most of your capital
In this article · 13 sections
Position sizing answers one question: how many shares, lots or units should I trade so that, if my stop-loss is hit, I lose exactly the amount I planned? Get this right and every loss is a known, survivable cost. Get it wrong and the best strategy in the world can still empty your account.
What You Will Learn
- The one formula behind every position-size calculation
- What the 1% rule is, and how to choose your own risk per trade
- How to size trades in shares, Nifty futures, options and forex
- What to do when even the smallest lot is too big
Before You Start
Read Risk Management: Why It Comes First first, and make sure you know what a stop-loss is. For the forex example it helps to know what a pip and a lot are; both are explained in the Forex course, module 1.
The Position Sizing Formula
Every calculation in this lesson comes from one line:
There are three inputs:
- Rupee risk: the amount you are willing to lose on this trade. It comes from your account size and your risk percentage.
- Stop distance: how far your stop-loss is from your entry, in points, rupees or pips. It comes from the chart.
- Value of one point per unit: what a one-point move is worth for one share, one lot or one unit. For a share it is ₹1; for a Nifty futures lot of 65 it is ₹65; for a standard forex lot on EUR/USD it is $10 per pip.
The 1% Rule
The 1% rule says: never risk more than 1% of your account on a single trade. On a ₹5,00,000 account that is ₹5,000. It doesn't limit how much you can buy; it limits how much you can lose if the stop is hit.
1% is a common ceiling, not a target. Many professionals risk less, especially on short timeframes where they trade often. As Lesson 12.01.01 showed, at 1% a streak of ten losses costs under 10% of the account; at 5% it costs about 40%.
| Account | 0.5% risk | 1% risk | 2% risk |
|---|---|---|---|
| ₹1,00,000 | ₹500 | ₹1,000 | ₹2,000 |
| ₹2,00,000 | ₹1,000 | ₹2,000 | ₹4,000 |
| ₹5,00,000 | ₹2,500 | ₹5,000 | ₹10,000 |
| ₹10,00,000 | ₹5,000 | ₹10,000 | ₹20,000 |
Step by Step
Sizing any trade
Step 1: Mark your stop-loss on the chart
Put it where your trade idea is proven wrong, for example just beyond the swing low that a long trade depends on.
Step 2: Measure the stop distance
Entry price minus stop price for a long trade (stop minus entry for a short).
Step 3: Calculate your rupee risk
Account size × risk percentage.
Step 4: Divide, then round down
Rupee risk ÷ (stop distance × value per point). Always round down to the nearest whole share or lot.
Step 5: Check the capital it ties up
Multiply the size by the entry price (or margin per lot). If one position would tie up most of your account, reduce it.
Real Prices: Same Risk, Different Sizes
The worked examples in this lesson use round numbers. The chart below applies the formula to two real entries on Reliance Industries in October and November 2025: one with a wide stop and one with a tight stop, each sized to risk exactly 1% of a ₹10 lakh account.
Real prices: two entries, two stops, the same rupee risk, Reliance Industries, October–November 2025
Step 1 of 4
Entry A: a wide stop
On 29 October 2025 Reliance is at ₹1,504.2, well above its breakout level. A trader buying here needs a stop back below the level, about ₹1,412: ₹92 of risk per share. With ₹10,000 of risk (1% of ₹10 lakh), the 1% rule allows 108 shares, about ₹1.6 lakh.
- What to observe
- Wide stop, small position.
- Condition
- The rupee risk is fixed first; the size follows.
Worked Examples
All examples use a ₹5,00,000 account risking 1%, so the rupee risk is ₹5,000. Prices are illustrative.
Example 1: buying shares
You plan to buy a stock at ₹1,240 with a stop at ₹1,210. The stop distance is ₹30 per share, so the size is ₹5,000 ÷ ₹30 = 166.7, rounded down to 166 shares. If the stop is hit you lose ₹4,980. The position is worth about ₹2,05,840, or 41% of the account, so check you are comfortable with that much capital in one stock.
Example 2: Nifty futures
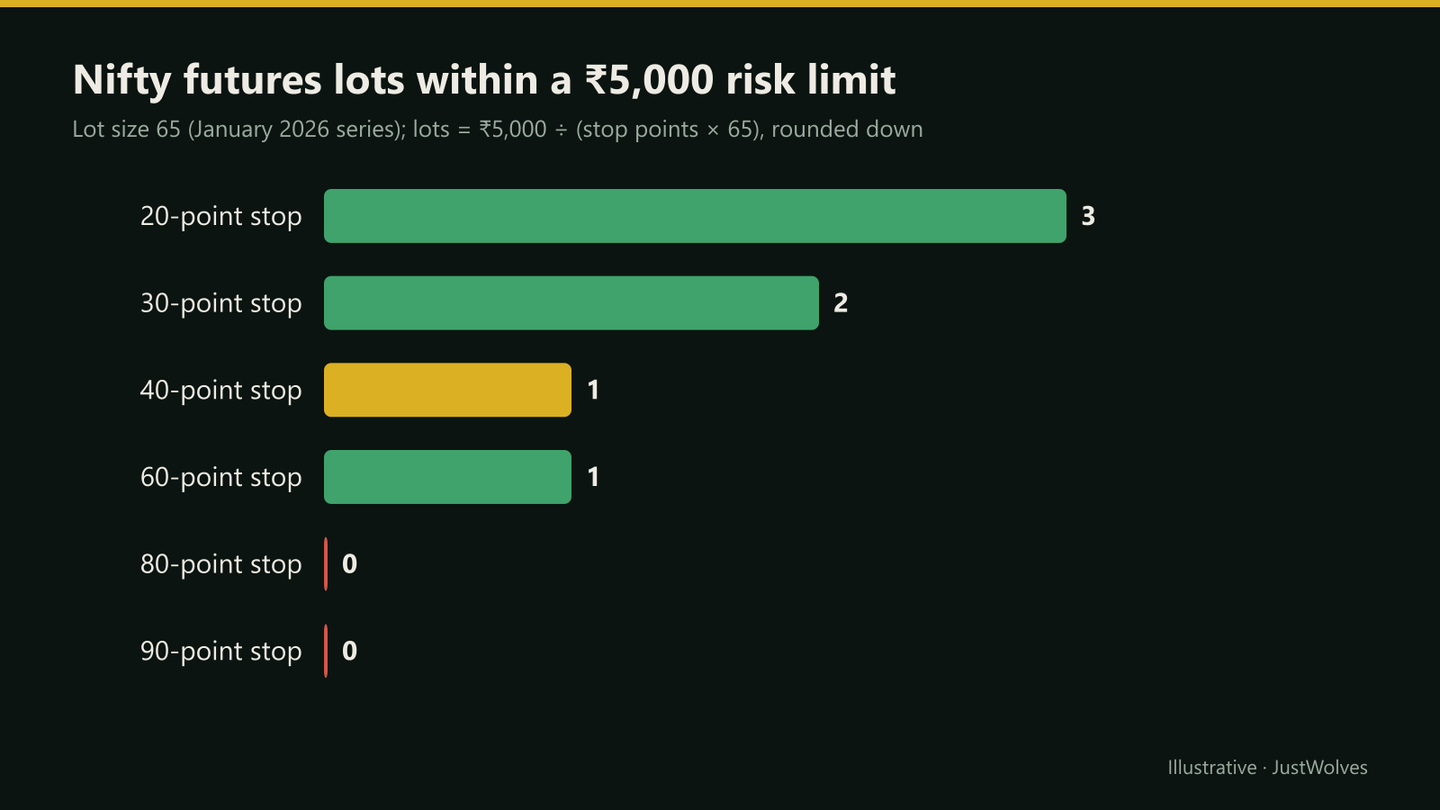
From the January 2026 series a Nifty lot is 65 units (NSE revises lot sizes from time to time, so check the current contract specification). You go long with a stop 40 points away. One lot risks 40 × 65 = ₹2,600. ₹5,000 ÷ ₹2,600 = 1.9, rounded down to 1 lot, risking ₹2,600 (0.52% of the account).
Now suppose the chart puts your stop 90 points away. One lot would risk 90 × 65 = ₹5,850, more than your ₹5,000 limit. You cannot trade 0.85 of a lot. The answer is not to tighten the stop to make the trade fit; it is to skip the trade or use a smaller instrument, such as the underlying shares or a lower-value contract.
Example 3: buying an option
You buy a Nifty call at ₹120 and decide to exit if the premium falls to ₹80. The loss per lot is (120 − 80) × 65 = ₹2,600, so again 1 lot. If you plan to hold without a stop, your risk is the whole premium: 120 × 65 = ₹7,800 per lot, which is more than 1% of this account.
Example 4: forex
On a $10,000 account, 1% is $100. You plan a EUR/USD trade with a stop 25 pips away. On a standard lot (100,000 units) a pip is worth $10, so one standard lot risks $250. $100 ÷ $250 = 0.4 lots, which is four mini lots. On Indian exchange-traded currency contracts the lot size and tick value are different, so take them from the exchange's contract specification and apply the same formula.
| Instrument | Stop distance | Risk per unit or lot | Size |
|---|---|---|---|
| Shares at ₹1,240 | ₹30 | ₹30 per share | 166 shares |
| Nifty futures (lot 65) | 40 points | ₹2,600 per lot | 1 lot |
| Nifty futures (lot 65) | 90 points | ₹5,850 per lot | Skip the trade |
| Nifty call bought at ₹120 | ₹40 premium | ₹2,600 per lot | 1 lot |
What the 1% Rule Means on Real Trades
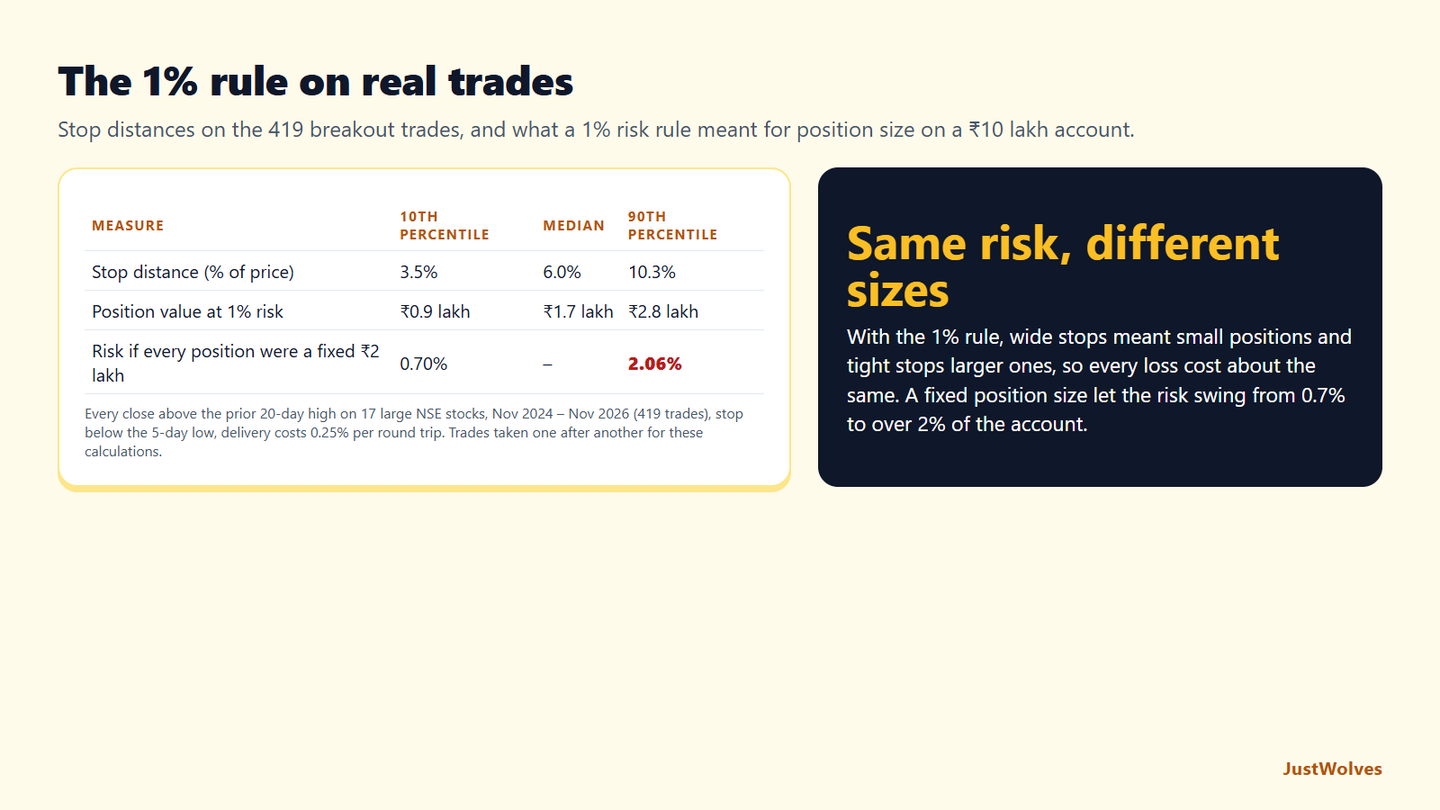
How big are real stop distances, and what positions does the 1% rule produce? JustWolves measured the 419 trades of a simple breakout strategy on 17 large NSE stocks (November 2024 to November 2026), each with a stop below the previous five days' low, and sized every one for a ₹10 lakh account risking 1% (₹10,000). For comparison, we also calculated the risk each trade would have carried with a fixed position of ₹2 lakh.
| Measure | 10th percentile | Median | 90th percentile |
|---|---|---|---|
| Stop distance, % of price | 3.5% | 6.0% | 10.3% |
| Position value at 1% risk | ₹0.9 lakh | ₹1.7 lakh | ₹2.8 lakh |
| Risk with a fixed ₹2 lakh position | 0.70% | – | 2.06% |
Stops varied threefold, so positions did too. The middle 80% of stops ranged from 3.5% to 10.3% of the price. The 1% rule turned that into positions from about ₹0.9 lakh to ₹2.8 lakh, so that every losing trade cost about the same ₹10,000. No position in this stream needed more than half the account, so the 1% rule never ran into a capital limit here.
A fixed position size hides the risk. Buying a fixed ₹2 lakh of each stock would have risked anywhere from 0.7% to over 2% of the account per trade, and up to 3.2% on the widest stop. Over a losing streak, those larger losses on wide-stop trades are what turn a manageable drawdown into a serious one, as the Risk of Ruin lesson shows.
Size comes from the stop, not the other way round. The mistake this lesson warns about, tightening a stop to fit a bigger position, would have meant stops inside normal daily movement on many of these trades. The stop belongs where the trade idea is wrong; the 1% rule then sets the size.
Common Mistakes
- Sizing by margin available. Margin tells you what you are allowed to trade, not what you can afford to lose.
- Rounding up. 1.9 lots is 1 lot. Rounding up quietly doubles your risk.
- Tightening the stop to fit the size. Fit the size to the stop, never the other way round.
- Forgetting costs and slippage. In fast markets your exit can be worse than your stop; leave a small buffer.
- Same size for every trade. A wide stop needs a smaller position than a tight one to risk the same rupees.
Professional Insight
Experienced traders treat position size as the result of a calculation, never a choice. That's why their rupee losses look similar from trade to trade even when their stops vary a lot: a wide stop simply means a smaller position. It also makes their results easy to analyse, because every trade can be measured in units of risk (R) rather than rupees.
Risk Considerations
- Gaps: a position sized for a 40-point stop can lose far more if the market opens 150 points beyond it.
- Several open trades: five trades at 1% each means 5% at risk at once, more if they are correlated (see Lesson 12.02.06).
- Changing lot sizes: exchanges revise lot sizes. Recheck the contract specification rather than relying on an old number.
Important Terminology
| Term | Meaning |
|---|---|
| Rupee risk | The amount you accept losing on one trade: account size × risk percentage. |
| Stop distance | The gap between entry and stop-loss, in points, rupees or pips. |
| Lot size | The fixed number of units in one futures or options contract, set and revised by the exchange. |
| Point value | What a one-point move is worth for one unit, share or lot. |
| Pip value | In forex, what a one-pip move is worth for a given lot size, e.g. $10 per standard lot on EUR/USD. |
| Margin | The deposit a broker or exchange requires to hold a leveraged position. It is not the most you can lose. |
What is the 1% rule in trading?
It means never risking more than 1% of your account on a single trade, measured as the loss if your stop-loss is hit. On a ₹2,00,000 account that is ₹2,000 per trade.
How do I calculate position size?
Divide the amount you are willing to lose by the loss per share or lot if your stop is hit. For example, ₹2,000 risk with a ₹20 stop on a stock gives 100 shares.
Is 2% risk per trade too much?
It's at the upper end. At 2%, ten consecutive losses cost about 18% of the account. Many traders, especially beginners and those who trade often, are better off at 0.5–1%.
Does position sizing work for intraday trading?
Yes, and it matters more there, because intraday traders take many trades and hit losing streaks quickly. Combine it with a daily loss limit (Lesson 12.02.04).
How big are typical stop losses on swing trades in Indian stocks?
In our sample of 419 breakout trades on 17 large NSE stocks, stops below the previous five days' low were 3.5% to 10.3% of the price for the middle 80% of trades, with a median of 6%.
Why not just buy the same amount of every stock?
Because the risk then varies with the stop. In our NSE data, a fixed ₹2 lakh position would have risked anywhere from 0.7% to over 2% of a ₹10 lakh account per trade. The 1% rule keeps each loss about the same.
Practical Exercise
Size these two trades for a ₹3,00,000 account risking 0.5% per trade. Work them out before reading the answers.
Your task
Step 1: Shares
You plan to buy a stock at ₹650 with a stop at ₹638. How many shares, and how much capital does the position tie up?
Step 2: Nifty futures
You plan a Nifty futures trade with the stop 30 points away, lot size 65. How many lots?
Step 3: Check yourself
For each answer, confirm the loss at the stop is at or below your rupee risk.
Check Your Understanding
Account ₹2,00,000, risk 1%, buying a stock at ₹500 with a stop at ₹490. How many shares?
Related Lessons
Previous: Why Risk Management Comes First. Next: Lesson 12.01.04, Risk-Reward Ratio. Try your own numbers in the position size calculator.