
Swing Highs and Swing Lows: Finding the Turning Points
JustWolves is an educational platform and is not a SEBI-registered investment advisor. Trading financial instruments involves significant risk of loss and may not be suitable for all investors. Past performance is not indicative of future results. Read our full disclaimer →
What you'll learn
- A swing high is a peak with lower highs either side; a swing low is a trough with higher lows either side
- Three- and five-candle rules give objective definitions; bigger windows give fewer, more significant swings
- Filter minor swings by requiring a meaningful move away from the point
- Swing points define trends, place stops and set targets
- A swing is only confirmed after the candles that follow it have formed
In this article · 19 sections
Swing highs and swing lows are the turning points on a chart, and almost everything in price action is built on them: trends, support and resistance, stop placement and targets. This lesson gives you objective rules for identifying them, a way to filter out minor wiggles, and the main ways traders use them.
What You Will Learn
- What swing highs and swing lows are
- Objective rules for identifying them
- How to filter significant swings from noise
- How swing points are used in trading
Before You Start
Read Market Trends first.
Definitions
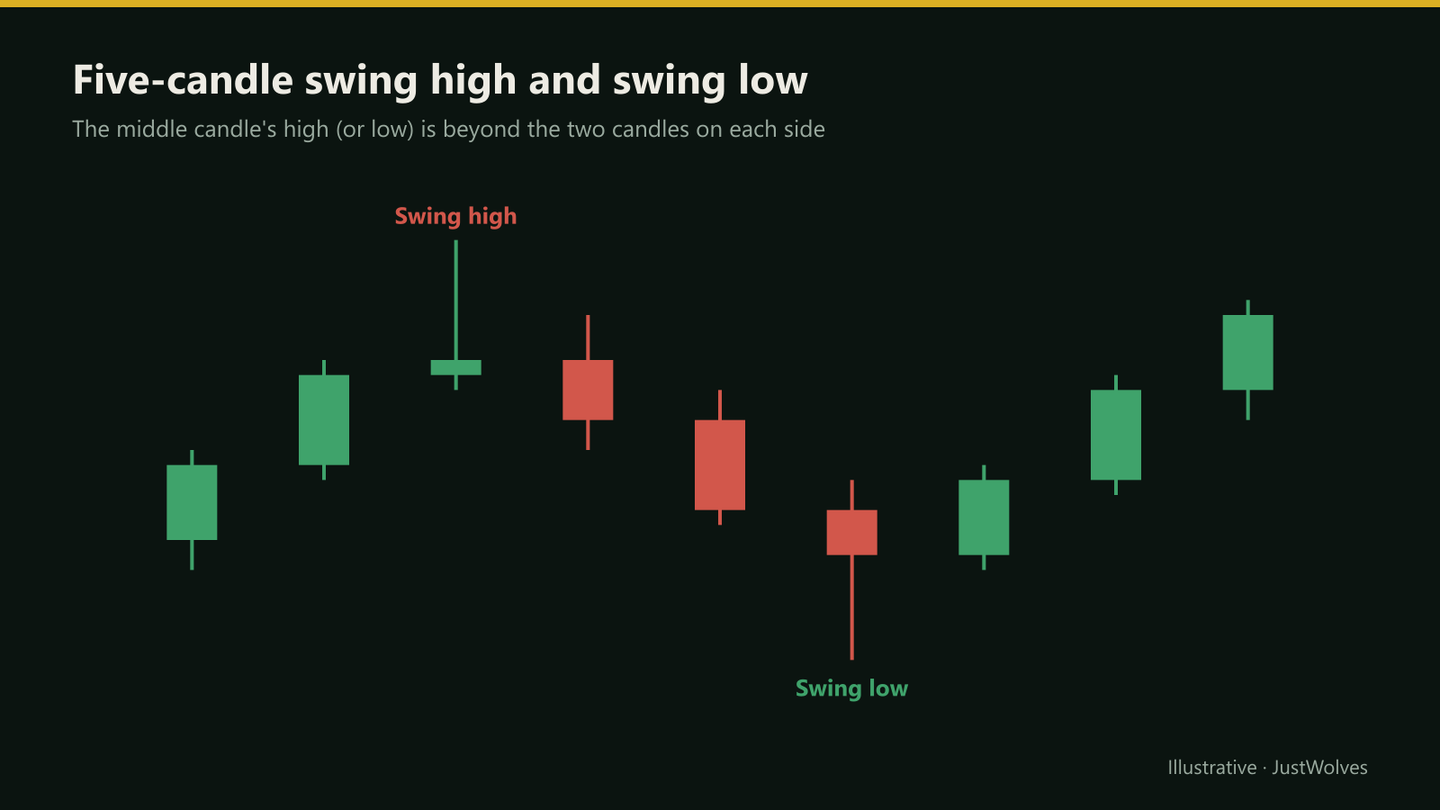
A swing high is a candle whose high is higher than the highs of the candles on either side. A swing low is a candle whose low is lower than the lows of the candles on either side.
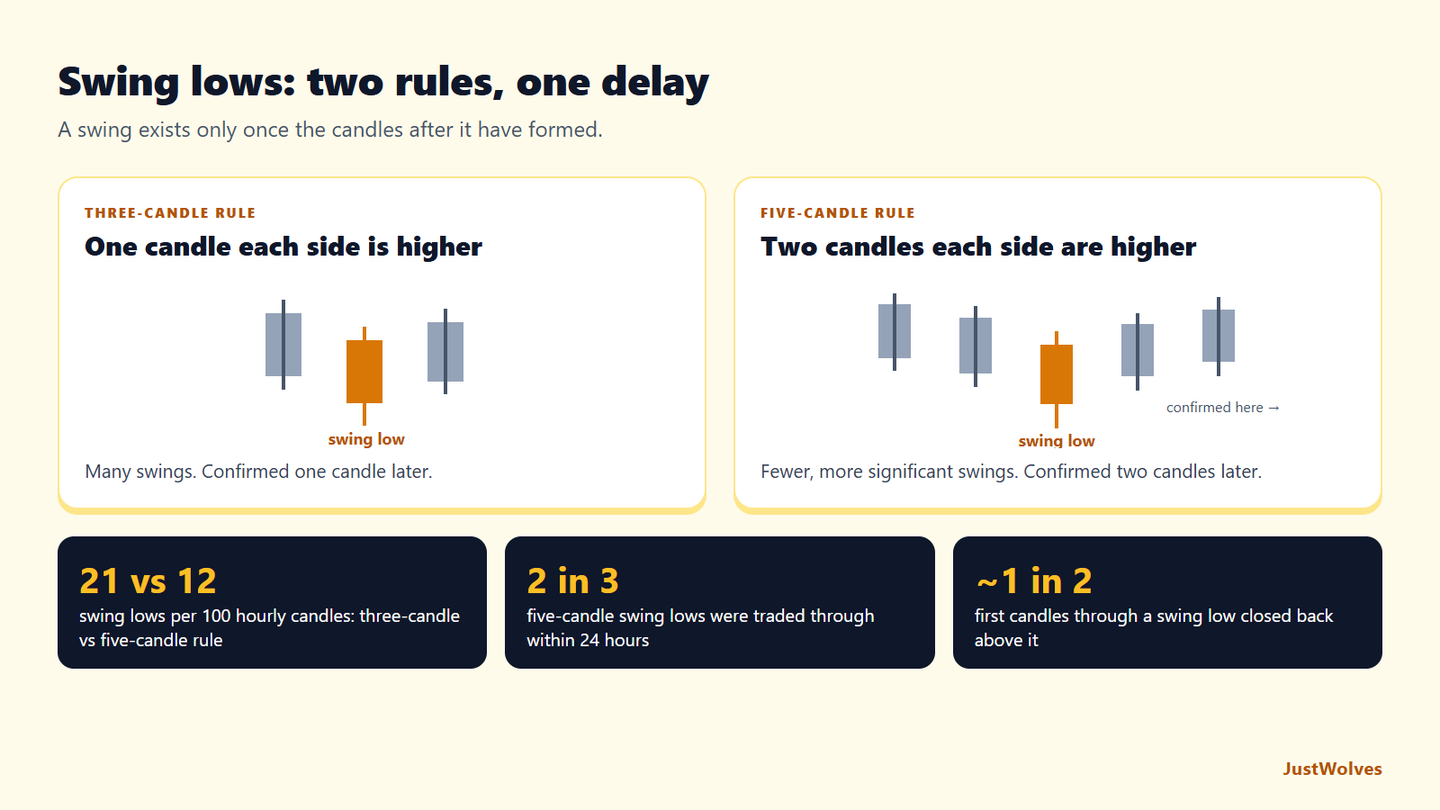
The number of candles you compare decides how sensitive the definition is. Compare one candle each side (a three-candle swing) and you'll find many swings. Compare two each side (a five-candle swing, sometimes called a fractal) and you'll find fewer, more significant ones.
Confirmation Comes Later
You can't know a candle is a swing high until the candles after it have formed lower highs. With a five-candle rule, that's two candles later. This delay matters for trading: a swing you mark in hindsight wasn't visible at the time. When you backtest, only use swings that were already confirmed when you made the decision.
Both Rules, One Chart
The chart below applies both definitions to the same candles. Step through it to see a swing that counts under the three-candle rule but not the five-candle rule, the two-candle confirmation delay, and why a stop needs a buffer below the swing.
Three-candle vs five-candle swing lows, and a stop with a buffer
Step 1 of 5
A three-candle swing low
Candle 3 has a lower low (1.0832) than the candle on each side. Under the three-candle rule, it is a swing low, confirmed once candle 4 closes.
- What to observe
- One candle each side is higher.
- Condition
- A minor swing.
Real Case: A Swing Low Swept and Held
The chart below uses real NIFTY 50 hourly candles from September 2026. It shows the confirmation delay as it happened, and a swing low that was traded through by 31 points and still held on a closing basis. Step through it and compare the two stop buffers.
Real case: a swing low swept and held, NIFTY 50 hourly, September 2026
Step 1 of 5
A low forms
At 09:15 on 21 September, NIFTY trades down to 23,317 and turns up. At this point it is just a low; nobody yet knows whether it is a swing.
- What to observe
- A candidate, not a swing.
- Condition
- Wait for two more candles.
Filtering Minor Swings
- Use a wider window: a five-candle rule instead of three.
- Require a minimum move: for example, price must move at least one ATR (average true range) away from the swing for it to count.
- Use a higher timeframe: swings visible on the daily chart are more significant than those only seen on 5-minute charts.
- Keep obvious swings: if you have to look hard for it, it probably doesn't matter.
Swing Points in Different Markets
The same rules work on Nifty, Indian stocks and forex, but market hours change what you see. Indian stocks and indices have overnight gaps, so a daily swing low can be followed by a gap that skips straight past it; forex trades almost continuously, so its swings are smoother. On stocks with frequent gaps, consider using closing prices rather than wicks to judge whether a swing has been broken, and always check the daily chart for gaps before relying on an intraday swing.
How Swing Points Are Used
| Use | How |
|---|---|
| Trend | Compare successive swings: HH/HL or LH/LL (lesson 04.01.02) |
| Support and resistance | Earlier swing highs and lows become levels (module 04.02) |
| Stop placement | Beyond the last swing low (long) or swing high (short), plus a buffer |
| Targets | The next swing high (long) or swing low (short) |
| Breakouts | A close beyond a swing high or low signals a breakout |
What Happens at Swing Points? Our Test
JustWolves measured swing lows on about six months of real 1H candles for NIFTY 50, EUR/USD, GBP/USD, USD/JPY and gold. We found every swing low under each rule, then looked at the next 24 hours: was the low traded through, and if so, did the first candle to trade through it close back above it (a wick through) or below it (a close through)?
| Rule | Swing lows per 100 candles | Traded through within 24h | First candle through closed back above |
|---|---|---|---|
| Three-candle | 21 | 75% | 47% |
| Five-candle | 12 | 66% | 48% |
Three lessons come out of these numbers.
The five-candle rule roughly halves the number of swings. On a 1H chart, the three-candle rule finds a swing low about every five candles, which is too many to be meaningful. The five-candle rule finds about one every eight candles, a much cleaner map of the structure.
Most swing lows are traded through within a day. Three quarters of three-candle swings and two thirds of five-candle swings were taken out within 24 hours. A swing low is a reference point, not a floor. Swings from wider windows and higher timeframes held a little better, which is why the filters in this lesson exist.
Wicks through a swing are as common as closes through it. About half the time, the first candle that traded below a swing low closed back above it. If your stop sits exactly at the swing, it gets hit by these wicks. A buffer, or judging breaks on closes, avoids many of these losses. This also explains why the Market Trends lesson asks you to judge breaks on candle closes.
Step by Step: Marking Swings
On any chart
Step 1: Choose a timeframe and rule
For example, daily, five-candle swings.
Step 2: Scan from left to right
Mark each candle that meets the rule.
Step 3: Filter
Remove swings that don't meet your minimum move.
Step 4: Alternate
In clean structure, swing highs and lows alternate; if two highs appear in a row, keep the higher one.
Step 5: Read the result
Trend, levels, and where stops and targets would go.
Practical Example
Hypothetically, on the daily chart of an Indian IT stock, Rohit marks five-candle swing lows at ₹1,410 and ₹1,452 and a swing high at ₹1,520. The stock is in an uptrend and pulls back towards ₹1,460.
He plans a long with a stop below the last swing low, at ₹1,445 (₹1,452 minus a ₹7 buffer), and a first target at the swing high, ₹1,520. If he buys at ₹1,465, that's ₹20 of risk per share for ₹55 of reward.
How Big Should the Buffer Be?
There is no single right buffer, but it should scale with the market's normal movement. A common approach uses the average true range (ATR) of the timeframe you are trading:
- A fraction of ATR: 0.1 to 0.3 times the 14-candle ATR beyond the swing. On a 1H EUR/USD chart where ATR is about 12 pips, that is roughly 1 to 4 pips.
- Fixed points for stocks and indices: some traders use a fixed amount, such as 5 to 10 points on Nifty futures intraday, adjusted when volatility changes.
- Beyond the wick and the round number: if the swing low sits just above a round number, such as 24,000 on Nifty, put the stop below the round number as well.
A larger buffer reduces the chance of being stopped by a wick, but makes the stop wider, so the position must be smaller for the same risk. Write your buffer rule down with your swing rule, and test both together.
Swings on Different Timeframes
A daily swing low is built from many hourly swings. When you zoom in, one daily low becomes a whole sequence of smaller highs and lows. This is why the timeframe matters as much as the window size: a five-candle swing on the daily chart covers a week of trading, while a five-candle swing on a 5-minute chart covers 25 minutes.
In practice, use the swings of the timeframe that defines your trade. A swing trader managing a daily position should place stops beyond daily swings, not beyond the latest 15-minute low. An intraday trader can use smaller swings, but should still know where the nearest daily swing sits, because that is the level most participants are watching.
Practise on a Real Chart
The chart below is real NIFTY 50 hourly data. Mark every five-candle swing low you can find, noting the candle where each one was confirmed. Then check what happened when price came back to each: did it hold, get swept and hold, or break on a close?
Practice chart: NIFTY 50 hourly
Loading historical candles…
Common Mistakes
- Marking swings in hindsight that weren't confirmed at the time.
- Using too sensitive a rule and getting dozens of swings.
- Stops exactly at the swing, without a buffer.
- Ignoring the timeframe a swing belongs to.
- Changing the rule to fit a trade.
Professional Insight
Swing points are one of the few parts of price action that can be defined completely objectively, which is why they're the backbone of many systematic strategies as well as discretionary ones. If you ever want to automate part of your process, start here.
Risk Considerations
- Stops just beyond obvious swings are common targets for sweeps; leave a buffer.
- Gaps can open beyond swing levels.
- Confirmation delay means entries are later than they look in hindsight.
Important Terminology
| Term | Meaning |
|---|---|
| Swing high | A peak with lower highs on either side. |
| Swing low | A trough with higher lows on either side. |
| Fractal | A common name for a five-candle swing point. |
| ATR | Average true range: a measure of typical candle range. |
| Buffer | Extra distance added beyond a level for a stop. |
What is a swing high?
A candle whose high is higher than the highs of the candles on either side of it.
What is a swing low?
A candle whose low is lower than the lows of the candles on either side of it.
How many candles define a swing point?
Common rules use one candle each side (three-candle) or two each side (five-candle). Wider rules find fewer, more significant swings.
Where should I put my stop using swing points?
Beyond the last swing low for a long, or swing high for a short, with a small buffer.
What is a fractal in trading?
A common name for a five-candle swing high or low, also available as an indicator on many platforms.
Should I use the three-candle or five-candle swing rule?
For most charts, the five-candle rule. In our test on real 1H data, the three-candle rule produced a swing low about every five candles, while the five-candle rule produced about one every eight, a cleaner picture of structure.
How often do swing lows get broken?
Often. In our 1H data, two thirds of five-candle swing lows were traded through within 24 hours, and about half of the first candles to trade through closed back above the level.
Where should I put my stop relative to a swing low?
Below the swing low plus a buffer, not exactly at it. Wicks through swing lows are very common, so a small buffer based on the average candle range avoids many unnecessary stop-outs.
How far below a swing low should a stop go?
It depends on the market's normal movement. In a real NIFTY example from September 2026, a swing low was traded through by about 0.6 of an hourly ATR before holding: a 0.3 ATR buffer was hit, while a 0.8 ATR buffer survived.
Practical Exercise
Compare two rules.
Your task
Step 1: Choose a daily chart
Three months of a liquid stock or Nifty.
Step 2: Mark three-candle swings
Count them.
Step 3: Mark five-candle swings
Count them.
Step 4: Compare
Which set gives a clearer picture of the trend?
Check Your Understanding
A swing low is a candle whose low is:
Related Lessons
Previous: Market Trends. Next: Multi-Timeframe (Top-Down) Analysis. See also Stop-Loss Orders.