
Consolidation and Trading Ranges: How to Read and Trade Them
JustWolves is an educational platform and is not a SEBI-registered investment advisor. Trading financial instruments involves significant risk of loss and may not be suitable for all investors. Past performance is not indicative of future results. Read our full disclaimer →
What you'll learn
- Consolidation is a pause where price moves sideways between a range high and a range low
- Ranges often form after strong moves, as the market balances before the next move
- Common range approaches: fade the edges, or wait for a breakout and its retest
- The middle of a range offers poor risk–reward; most range traders avoid it
- Tight, long consolidations often precede larger moves, but direction isn't known in advance
In this article · 18 sections
Markets don't trend all the time. Much of the time, price moves sideways, building a range between a ceiling and a floor while buyers and sellers are roughly balanced. Traders who only know how to trade trends lose money in these periods; traders who recognise ranges can either trade them or wait them out. This lesson shows how to identify consolidation and the main ways to trade it.
What You Will Learn
- What consolidation and trading ranges are
- How to identify and mark a range
- How to trade range edges and range breakouts
- How to avoid the middle of the range
Before You Start
Read Market Trends and What Is Support and Resistance? first.
What Consolidation Is
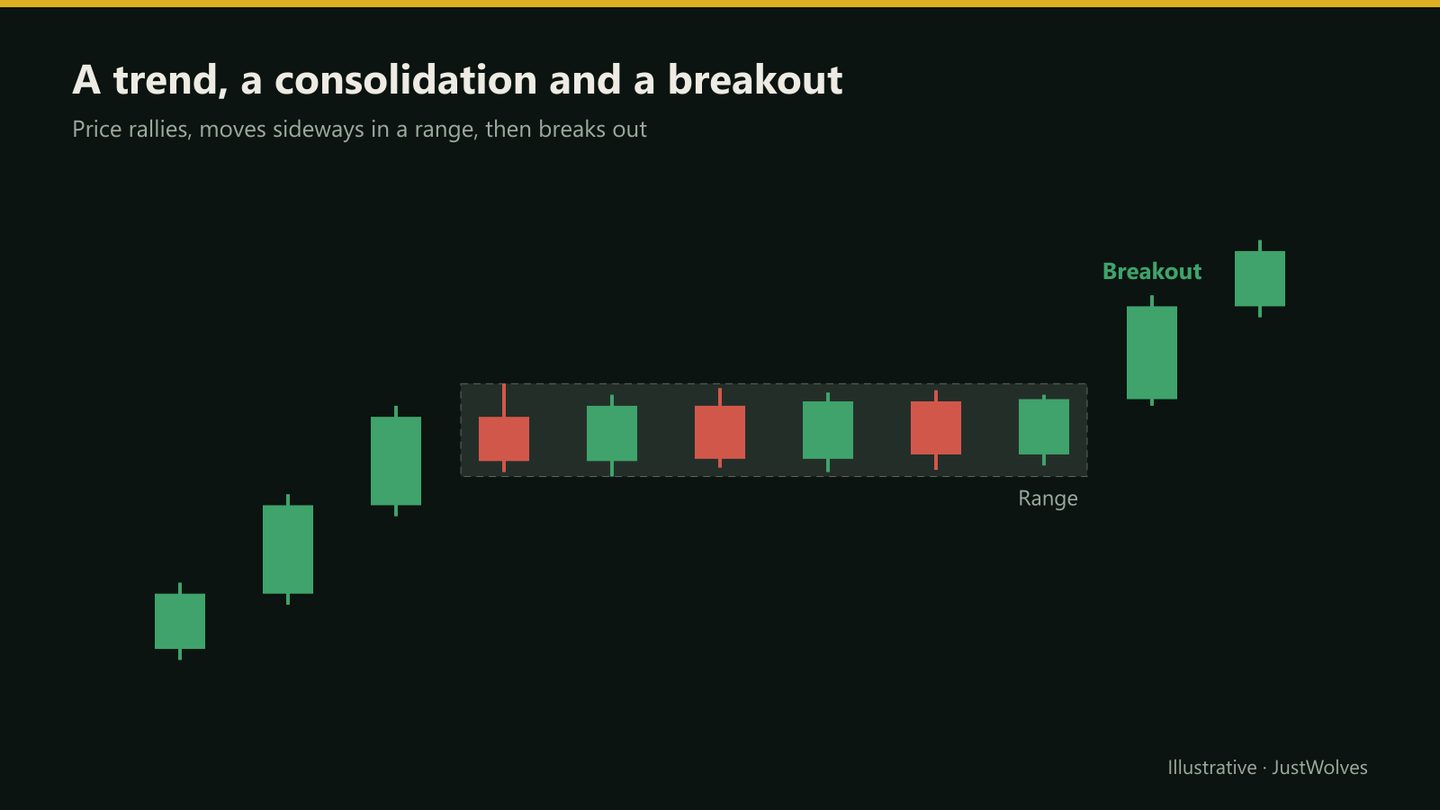
Consolidation is a period when price stops trending and moves sideways within a relatively narrow band. The upper boundary is the range high, acting as resistance; the lower boundary is the range low, acting as support.
Consolidation often follows a strong move, as the market absorbs it: early buyers take profit, new buyers wait for better prices, and neither side pushes hard. It ends with a breakout, either continuing the earlier trend or reversing it.
Identifying a Range
- At least two touches of both the high and the low.
- No progress: highs and lows roughly level, not rising or falling.
- Overlapping candles with smaller bodies than during the preceding trend.
- Moving averages flatten and price crosses them back and forth.
Approach 1: Trade the Edges
Fading the range
Step 1: Mark the range
High and low as zones.
Step 2: Wait for an edge
Price reaches the range high or low.
Step 3: Look for rejection
A reversal candle, or a sweep beyond the edge that closes back inside.
Step 4: Enter
After the confirming candle; stop just beyond the range edge.
Step 5: Target
The middle of the range first, then the opposite edge.
Approach 2: Trade the Breakout
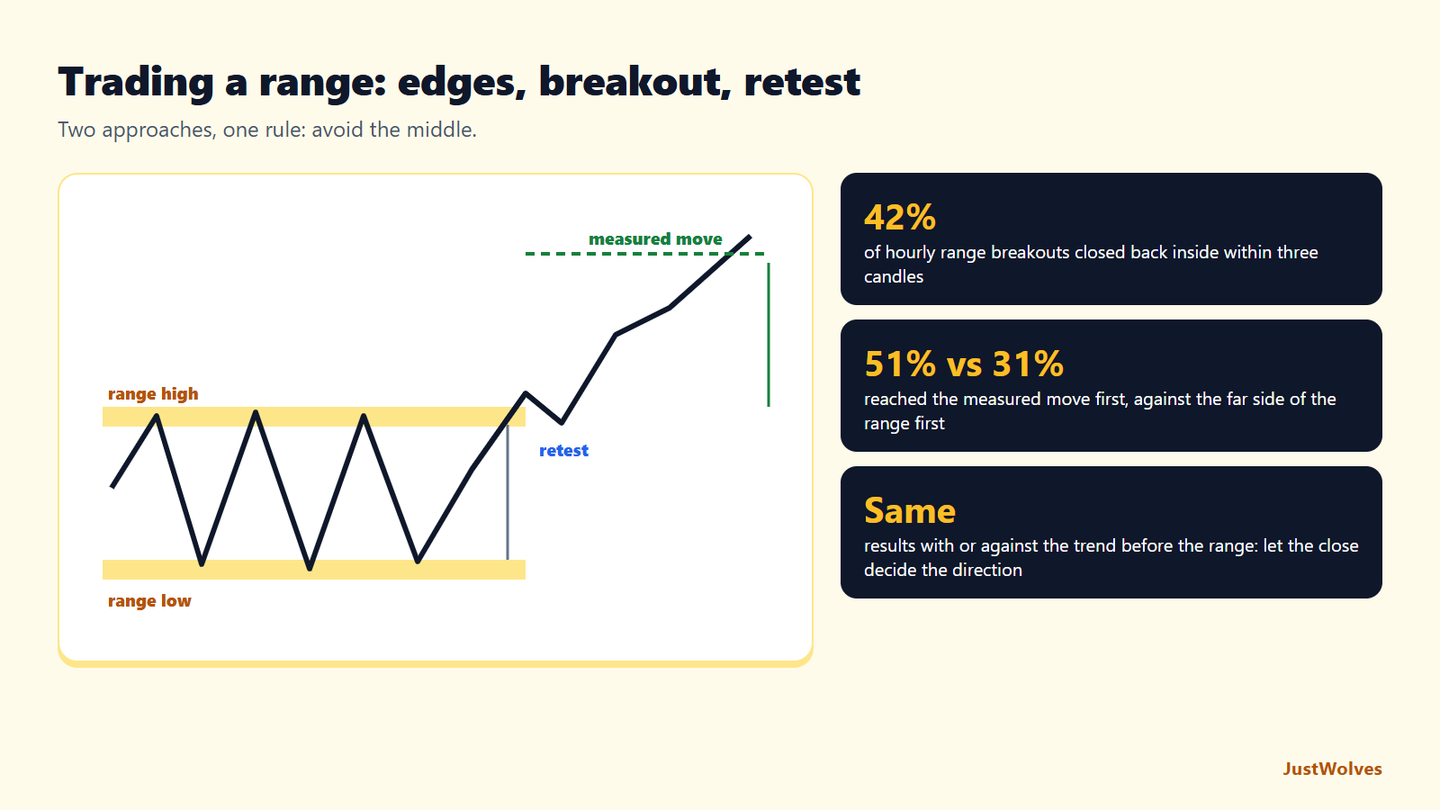
When price closes decisively beyond the range, often with larger candles and higher volume, the consolidation may be over. Many traders wait for a retest, where price returns to the broken edge and holds, and enter there with a stop back inside the range.
A common target is a measured move: the height of the range projected from the breakout point. A range from ₹480 to ₹500 that breaks upward suggests a first target near ₹520.
Both Approaches on One Chart
The chart below follows the practical example in this lesson: an edge trade inside the range, then a breakout, a retest and a measured-move target. Step through it and notice how each trade's stop and target come from the range itself.
Trading a range: the edges, then the breakout
Step 1 of 5
A strong rally
The stock rallies from 410 to 500 in five days. Strong moves are often followed by a pause while the market absorbs them.
- What to observe
- Large candles, closes near the highs.
- Condition
- Watch for the pause.
Real Case: A NIFTY 50 Range Breakout
The chart below uses real NIFTY 50 hourly candles from October 2026. Step through it to see a range form, a breakout that closed just 7 points beyond the edge, the retest that followed, and the measured move.
Real case: a range, a marginal breakout and a retest, NIFTY 50 hourly, October 2026
Step 1 of 5
A 20-hour range
From 26 to 29 October 2026 NIFTY moves sideways between 22,498 and 22,830: a range about 332 points tall, with several tests of each side.
- What to observe
- Level edges, overlapping candles.
- Condition
- Trade the edges or wait for a breakout.
Range Length and Width
Narrow, long consolidations, where volatility contracts over many candles, are often followed by larger moves once they resolve. Wide, choppy ranges tend to be harder to trade. Neither tells you the direction of the eventual breakout; the higher-timeframe trend and where the range sits relative to key levels are better clues.
Ranges Inside the Bigger Picture
A range on the daily chart can be a pullback on the weekly chart, and a trend on the 15-minute chart can be one leg inside a daily range. Before trading a range, check which timeframe it belongs to and what the next higher timeframe is doing.
Ranges that form after a strong uptrend and sit above major support are more often continuation patterns; ranges that form after a long decline into major support may be bases for a reversal. Neither outcome is guaranteed, but the context helps you decide which edge to favour and whether to wait for the breakout instead of fading the edges.
What Happens After a Range Breaks? Our Test
JustWolves tested range breakouts on about six months of real 1H candles for NIFTY 50, EUR/USD, GBP/USD, USD/JPY and gold, with downside breakouts tested on mirrored prices. Range: 20 candles whose total height was no more than four average candle ranges. Breakout: the first candle to close above the range high. We then followed the next 40 candles.
| What happened | Share of breakouts |
|---|---|
| Closed back inside the range within 3 candles | 42% |
| Reached the measured move (range height beyond the edge) first | 51% |
| Reached the far side of the range first | 31% |
| Measured move first, breakout with the prior trend | 51% (154 cases) |
| Measured move first, breakout against the prior trend | 50% (176 cases) |
False breakouts were common. Four in ten breakouts closed back inside the range within three candles. That is why this lesson suggests waiting for a retest, and why stops placed just beyond a range edge are vulnerable.
The measured move was a sensible target. About half of all breakouts reached a target equal to the range height before falling back to the far side of the range, which happened in under a third. A target of one range height with a stop inside the range is a reasonable plan with those odds.
The prior trend did not help predict the breakout. Breakouts in the direction of the move before the range reached their measured move as often as those against it. This lesson's advice stands: do not assume the breakout direction in advance; let the close beyond the range tell you.
Practical Example
Hypothetically, after rallying from ₹410 to ₹500, an auto-component stock spends three weeks between ₹480 and ₹500. Deepak buys a test of ₹482 with a bullish engulfing candle, stop ₹474, target ₹498, then exits at the range high.
Later, the stock closes at ₹508, above the range. It retests ₹501 the next day and holds. Deepak buys at ₹503 with a stop at ₹492, inside the range, targeting the measured move at ₹520.
Measuring a Range Objectively
To compare ranges, measure them in terms of the market's normal movement rather than in rupees or points. Divide the range height by the average true range (ATR) of the timeframe:
- Tight (under 3 ATR): volatility has contracted. Edge trades offer little room; many traders wait for the breakout.
- Normal (3–6 ATR): room for edge trades with a target near the opposite side.
- Wide (over 6 ATR): the range may contain smaller trends inside it. Consider a lower timeframe for entries.
Our test used ranges of up to four ATR over 20 candles, which is a tight-to-normal range on the 1H chart.
| Situation | Edge trade | Breakout trade |
|---|---|---|
| Range is wide, edges clearly tested | Suitable | Wait for a close and retest |
| Range is tight, volatility contracting | Little room to target | Suitable |
| Price in the middle of the range | No trade | No trade |
| Breakout just happened | Stop fading that edge | Wait for retest or accept false-break risk |
Ranges in Indian Stocks
Many Indian stocks consolidate for weeks after results or a sharp move, and the breakout often comes with a gap at the open on news. A gap breakout leaves no chance to enter at the edge, and the retest may come days later or not at all. Some traders handle this by entering a small position on the first daily close beyond the range and adding on a retest if one comes. Whichever method you use, decide in advance how you will handle a gap.
Common Mistakes
- Trading the middle of the range.
- Using trend strategies in a range, and range strategies in a trend.
- Calling a breakout on a wick rather than a close.
- Stops exactly at the range edge, where sweeps are common.
- Assuming the breakout direction before it happens.
Professional Insight
Experienced traders often say the hardest skill is doing nothing in a choppy market. Recognising a range early, and either trading only its edges or waiting for its resolution, protects capital in exactly the conditions that drain most trend-followers.
Risk Considerations
- False breakouts are common at range edges.
- Gaps in stocks can open beyond the range.
- News can end a range abruptly.
Important Terminology
| Term | Meaning |
|---|---|
| Consolidation | A sideways pause between trends. |
| Range high / low | The upper and lower boundaries of the range. |
| Fade | Trading against a move, at a range edge. |
| Breakout | A decisive close beyond the range. |
| Measured move | The range height projected from the breakout. |
What is consolidation in trading?
A period when price moves sideways in a relatively narrow range, usually between trends.
How do I trade a range?
Either buy near the range low and sell near the range high with stops beyond the edges, or wait for a breakout and its retest.
How do I know a range is ending?
A decisive close beyond the range, often with larger candles and volume; a successful retest adds confirmation.
What is a measured move?
A target found by projecting the range's height from the breakout point.
Why avoid the middle of a range?
There's no nearby level to define risk and no clear target, so risk–reward is poor.
How often are range breakouts false?
In our test on real 1H data, 42% of breakouts closed back inside the range within three candles. Waiting for a retest, or keeping size small, helps manage this.
Does the measured move target work?
Reasonably. In our 1H data, about half of range breakouts reached a target equal to the range height before returning to the far side of the range, which happened in under a third of cases.
Should I trust a breakout that closes only just above the range?
Treat it with caution and wait for a retest. In a real NIFTY example from October 2026, a breakout closed only 7 points above the range high, dipped back inside within two hours, then held and reached the measured move. In our data, about four in ten breakouts closed back inside within three candles.
Practical Exercise
Study three ranges.
Your task
Step 1: Find three ranges
On daily charts of liquid stocks or Nifty.
Step 2: Mark the edges
And count touches.
Step 3: Record the breakout
Direction, and whether it retested.
Step 4: Check the measured move
Did price reach it?
Check Your Understanding
Consolidation is best described as:
Related Lessons
Previous module: Pivot Points and Round Numbers. Next: Pullbacks and Retracements. See also the Breakout Trading course.