
Market Trends: Uptrends, Downtrends and Ranges
JustWolves is an educational platform and is not a SEBI-registered investment advisor. Trading financial instruments involves significant risk of loss and may not be suitable for all investors. Past performance is not indicative of future results. Read our full disclaimer →
What you'll learn
- An uptrend makes higher highs and higher lows; a downtrend makes lower highs and lower lows
- A range moves sideways between roughly level highs and lows
- The trend you see depends on the timeframe you look at
- A trend is usually considered over when it fails to make a new extreme and breaks its last swing
- Different conditions suit different strategies: pullbacks in trends, edges in ranges
In this article · 18 sections
'The trend is your friend' is one of the oldest sayings in trading, but it's only useful if you can tell what the trend is. This lesson gives you a simple, objective way to classify any chart as an uptrend, a downtrend or a range, explains how trends end, and shows which trading approaches suit each condition.
What You Will Learn
- How to identify uptrends, downtrends and ranges
- Why trend depends on timeframe
- How to recognise a trend change
- Which approaches suit each market condition
Before You Start
Read What Is Price Action Trading? first.
Three Market Conditions
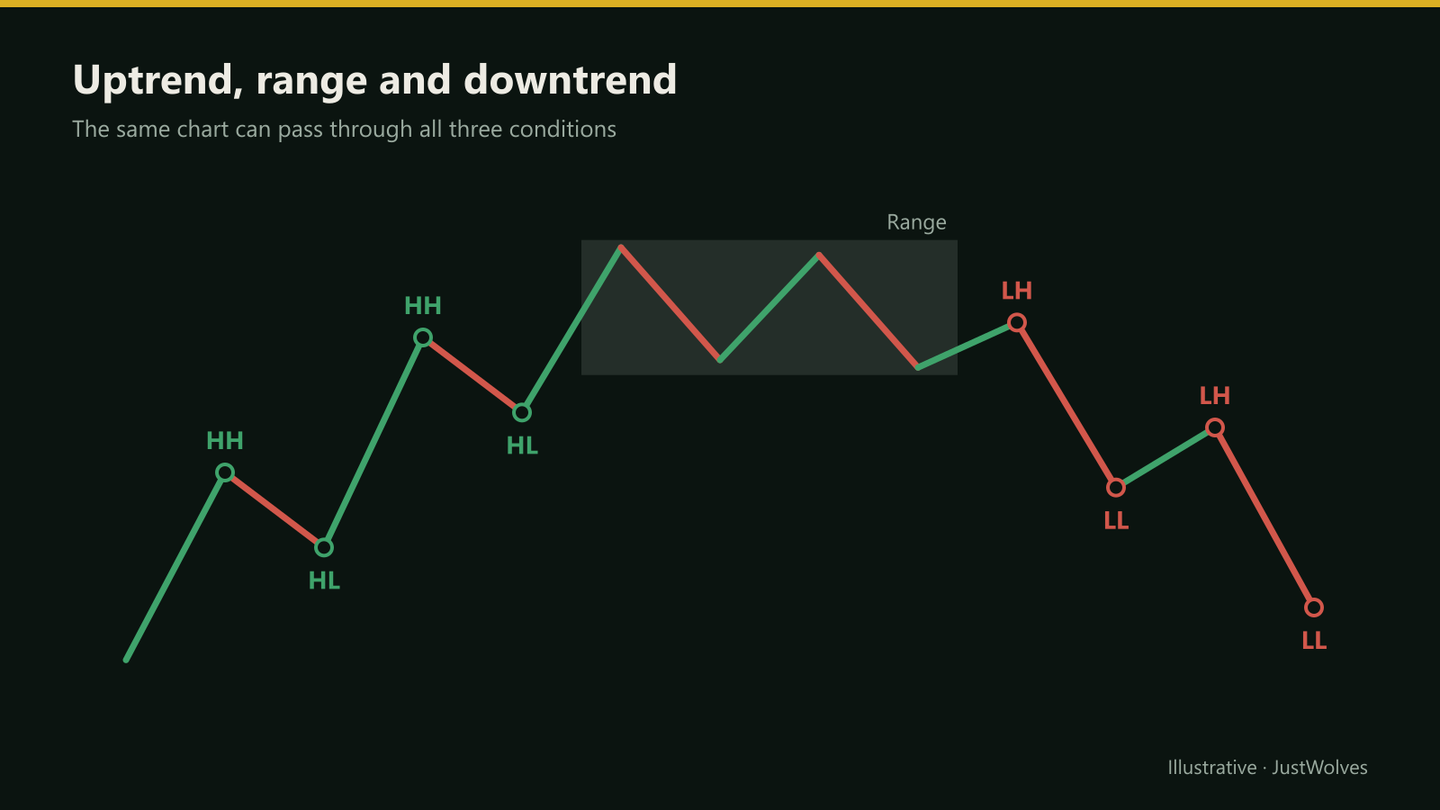
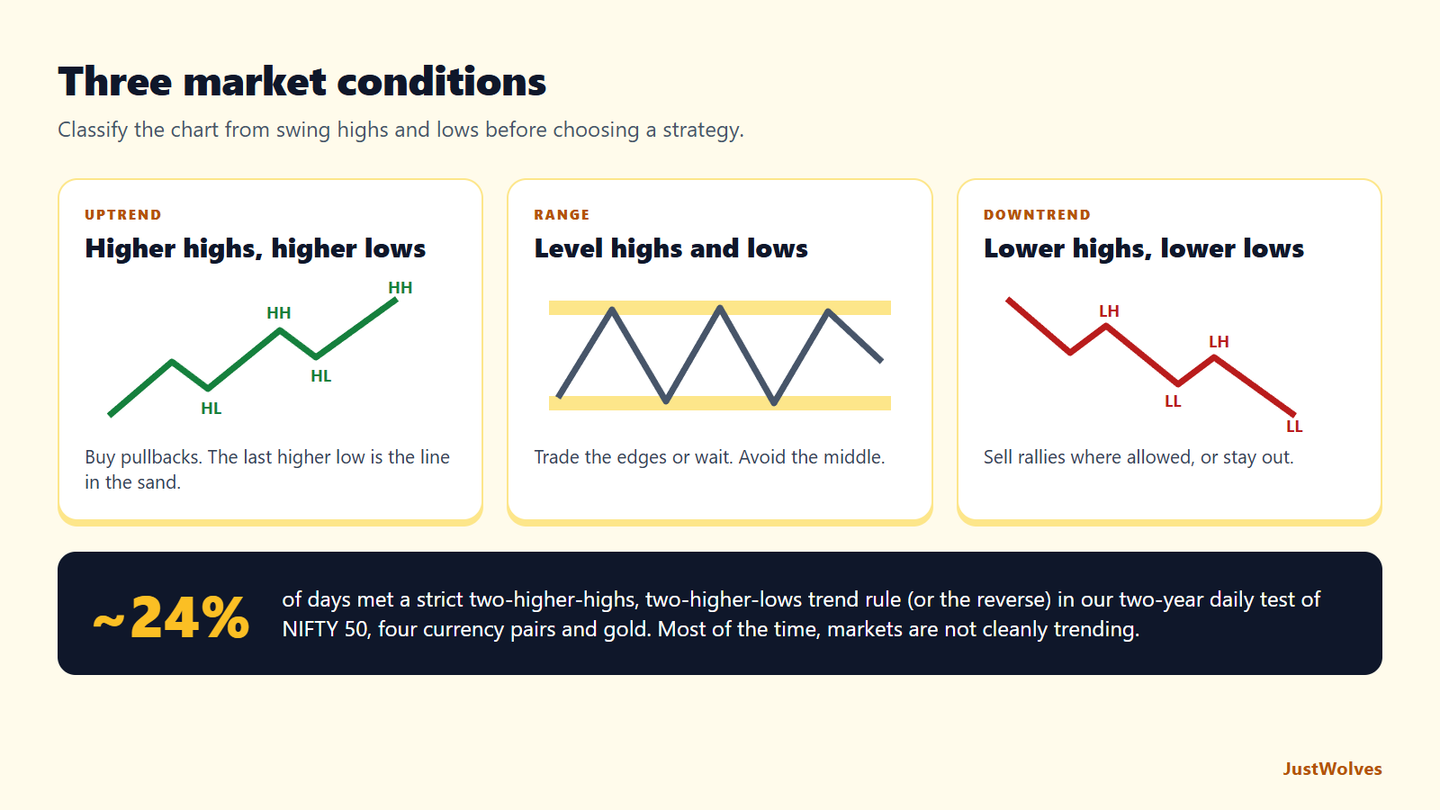
- Uptrend: a sequence of higher highs (HH) and higher lows (HL). Each rally reaches further than the last; each dip stops above the last dip.
- Downtrend: a sequence of lower highs (LH) and lower lows (LL).
- Range (sideways): highs and lows roughly level; neither side is making progress.
How Many Swings Make a Trend?
A common rule: at least two higher highs and two higher lows for an uptrend, and the reverse for a downtrend. One higher high on its own could just be noise. Write your rule down and apply it the same way every time, so your trend calls are consistent from one chart to the next.
Trend Depends on Timeframe
A stock can be in a daily uptrend while the 15-minute chart shows a downtrend: that's simply a pullback within the bigger move. Neither view is wrong; they describe different time horizons.
Decide which timeframe defines 'the trend' for your trading, usually one or two levels above the one you enter on. Lesson 04.01.04 covers this in detail.
How Trends End
- Failure to make a new extreme: in an uptrend, a rally that stops below the last high (a lower high) is the first warning.
- Break of the last higher low: a close below the most recent higher low breaks the uptrend's structure.
- Range or reversal: after the break, price either moves sideways or begins making lower highs and lower lows.
A Trend from Start to Finish
The chart below walks through one complete uptrend: the first swings, the two-and-two confirmation, the line in the sand moving up, the first warning and the final break. Use Next, or press Play, and watch how the trend call changes only when a new swing is confirmed.
An uptrend from first swing to structure break
Step 1 of 6
The first swings
A swing low forms at 1,520 and a swing high at 1,600. Two points are not a trend yet; they are just the reference for what comes next.
- What to observe
- One low, one high.
- Condition
- No trend call yet.
Notice two things. First, the trend was confirmed late: by the time two higher highs and two higher lows were in place, the stock had already risen from 1,520 to 1,700. Every objective trend rule pays this price; you give up the start of the move in exchange for evidence. Second, the trend ended in stages. The lower high at 1,690 came first, and only the close below 1,640 broke the structure.
Real Case: NIFTY 50, December 2025 to January 2026
The chart below uses real NIFTY 50 daily candles. Step through it to see the two-and-two rule applied exactly as written: the swings that build the uptrend, the day it is confirmed, and the close that breaks it, just one session later. It is an honest example of why trend rules describe the market rather than predict it.
Real case: an uptrend confirmed, then broken, NIFTY 50, Dec 2025 – Jan 2026
Step 1 of 5
A low and a high
NIFTY makes a five-candle swing low at 25,693 on 11 December and a swing high at 26,058 the next day. These are the reference points for what follows.
- What to observe
- One low, one high.
- Condition
- No trend call yet.
Trading Each Condition
| Condition | Common approach | Main risk |
|---|---|---|
| Uptrend | Buy pullbacks to support or the last higher low | The trend ends |
| Downtrend | Sell rallies to resistance or the last lower high (in markets where shorting is allowed) | The trend ends |
| Range | Buy near the bottom, sell near the top | The range breaks |
| Unclear | Wait or trade smaller | Whipsaws |
In Indian cash equities, short selling for delivery isn't available to most retail traders, so many simply stay out of stocks in downtrends, or use futures and options where appropriate and permitted.
How Often Do Markets Trend? Our Test
JustWolves applied the two-and-two rule from this lesson to about two years of real daily candles for NIFTY 50, EUR/USD, GBP/USD, USD/JPY and gold. Swings were five-candle swing points, used only once they were confirmed. On each day we classified the market as an uptrend (the last three swing highs and lows each higher than the one before), a downtrend (each lower), or neither. Then we checked whether price was further in the trend direction five trading days later.
| Condition | Share of days | Further in the trend direction 5 days later |
|---|---|---|
| Uptrend | about 15% | 51% |
| Downtrend | about 9% | 54% |
| Neither (range or mixed) | 76% | n/a |
Two results stand out. Markets were in a clean trend, by this strict rule, only about a quarter of the time. The rest of the time the swings were mixed: a higher high with a lower low, or a range. That is a useful reality check. If you only trade clean trends, you will spend most of your time waiting, which is normal.
A confirmed trend on its own barely predicted the next five days. Price continued in the trend direction 51% to 54% of the time, close to a coin flip. This is not a reason to ignore trends. It tells you what the trend is actually for: it is a filter and a context, not a forecast. The trend tells you which side to favour and where the line in the sand is; the entry, the stop and the reward-to-risk at a good level are what make a trade worthwhile. Our other tests found the same pattern: setups taken with the higher-timeframe trend did better than those against it (Multi-Timeframe SMC Analysis), even though the trend alone was not an edge.
Step by Step: Classifying a Chart
Five steps
Step 1: Pick your trend timeframe
For example, daily for swing trades.
Step 2: Mark the last four or five swing highs and lows
Lesson 04.01.03 explains how.
Step 3: Compare each with the previous one
Label HH/HL or LH/LL.
Step 4: Classify
Two HH and HL: uptrend. Two LH and LL: downtrend. Otherwise: range or unclear.
Step 5: Note the line in the sand
The last higher low (uptrend) or lower high (downtrend) whose break would end the trend.
Practical Example
Hypothetically, a large Indian bank stock's daily chart shows swing lows at ₹1,520, ₹1,560 and ₹1,610, and swing highs at ₹1,600, ₹1,655 and ₹1,700: higher highs and higher lows, an uptrend. The line in the sand is the last higher low, ₹1,610.
Anjali plans to buy pullbacks while the stock holds above ₹1,610. When it later rallies only to ₹1,690, below the ₹1,700 high, and then closes at ₹1,598, below ₹1,610, she treats the uptrend as over and stops looking for longs.
Practise on a Real Chart
The chart below is real NIFTY 50 daily data. Mark the five-candle swing highs and lows from left to right, label each as higher or lower than the previous one, and write down where the market was an uptrend, a downtrend or neither under the two-and-two rule. Then check how long each condition lasted. Most traders are surprised by how much of the chart is "neither".
Practice chart: NIFTY 50 daily
Loading historical candles…
Ranges Deserve Their Own Plan
Because most of the chart is not a clean trend, it pays to have a plan for ranges too. A range has roughly level highs and lows, and price spends its time moving between them. The common approaches are to buy near the bottom of the range and sell near the top, with stops just outside, or to wait for a close outside the range and trade the breakout.
Range trades usually have smaller targets than trend trades, because the opposite edge of the range is the natural target. They also fail in a specific way: the range ends. When you trade a range, decide in advance what a real breakout looks like (for example, a daily close beyond the range by more than a typical day's movement), and stop trading the edges once it happens.
| Sign | What it looks like |
|---|---|
| Mixed swings | A higher high followed by a lower low, or the reverse |
| Level edges | Several highs within a small distance of each other, and the same for lows |
| Overlapping candles | Candles cover much of the previous candle; few strong closes |
| Failed breakouts | Price closes beyond an edge and returns inside the next candle |
Common Mistakes
- Calling a trend from one swing.
- Mixing timeframes in the same analysis.
- Using wicks to judge breaks.
- Fighting the trend with repeated counter-trend trades.
- Trading breakouts in ranges and range edges in trends.
Professional Insight
Many professional traders spend more effort identifying the market condition than choosing the entry. A mediocre entry in the direction of a clear trend often works out; a perfect-looking entry against it often doesn't.
Risk Considerations
- Trends end without warning, often on news.
- Ranges can look like trends for a swing or two.
- Late entries in mature trends have less room.
Important Terminology
| Term | Meaning |
|---|---|
| Uptrend | Higher highs and higher lows. |
| Downtrend | Lower highs and lower lows. |
| Range | Sideways movement between level highs and lows. |
| Pullback | A temporary move against the trend. |
| Line in the sand | The swing whose break would end the trend. |
How do I identify an uptrend?
Look for a sequence of higher highs and higher lows, ideally at least two of each, on your chosen timeframe.
How do I know when a trend has ended?
Common signs are a failure to make a new high (or low) and a close beyond the last higher low (or lower high).
What is a range market?
A market moving sideways between roughly level highs and lows, with no clear progress in either direction.
Can a stock be in an uptrend and downtrend at the same time?
On different timeframes, yes. A daily uptrend can contain a short-term downtrend during a pullback.
What should I do in a downtrend if I can't short?
Many traders simply stay out, or wait for evidence of a trend change before buying.
How often is the market trending?
In our test on two years of daily data for NIFTY 50, four major currency pairs and gold, a strict two-higher-highs-and-two-higher-lows rule (or the reverse) classified the market as trending only about a quarter of the time. The rest was range or mixed structure.
Does a confirmed uptrend mean price will keep rising?
Not reliably. In our data, a confirmed daily trend continued in its direction over the next five days only 51% to 54% of the time. Use the trend as a filter and a reference for when you are wrong, not as a forecast.
What is the line in the sand in an uptrend?
The most recent higher low. A candle close below it breaks the uptrend structure. Each time a new higher low forms, the line in the sand moves up to it.
How quickly can a confirmed trend break?
Very quickly. In a real NIFTY 50 example from January 2026, the two-higher-highs, two-higher-lows rule confirmed an uptrend on 7 January, and a close below the last higher low broke it on 8 January.
Practical Exercise
Classify five charts.
Your task
Step 1: Choose five daily charts
Nifty and four liquid stocks.
Step 2: Mark swings
The last four or five highs and lows.
Step 3: Classify each
Uptrend, downtrend or range.
Step 4: Mark the line in the sand
For each trending chart.
Check Your Understanding
An uptrend consists of:
Related Lessons
Previous: What Is Price Action Trading?. Next: Swing Highs and Swing Lows. Later in the course: Pullbacks and Retracements.