
Price Action Case Studies and Backtesting
JustWolves is an educational platform and is not a SEBI-registered investment advisor. Trading financial instruments involves significant risk of loss and may not be suitable for all investors. Past performance is not indicative of future results. Read our full disclaimer →
What you'll learn
- Judge trades by whether you followed the rules, not by whether they won
- A correct trade can lose, and a rule-breaking trade can win
- Manual backtesting means applying written rules to past charts, candle by candle, without looking ahead
- Record every qualifying setup, including the losers and the ones you'd rather skip
- Use a meaningful sample; a handful of trades tells you very little
In this article · 16 sections
This final Price Action lesson brings the course together. First, three worked case studies apply the example strategy from the previous lesson: one trade that wins, one that loses while following every rule, and one that is correctly skipped. Then it covers how to backtest a price action strategy by hand, so you can find out how your rules behaved in the past before risking money on them.
What You Will Learn
- How to review trades by process, not outcome
- Three worked case studies
- How to backtest price action rules manually
- How to avoid common backtesting biases
Before You Start
Read Building a Price Action Strategy and Trading Plan first. The How to Backtest lesson in the Risk Management course covers backtesting in general; this lesson applies it to price action.
Process Over Outcome
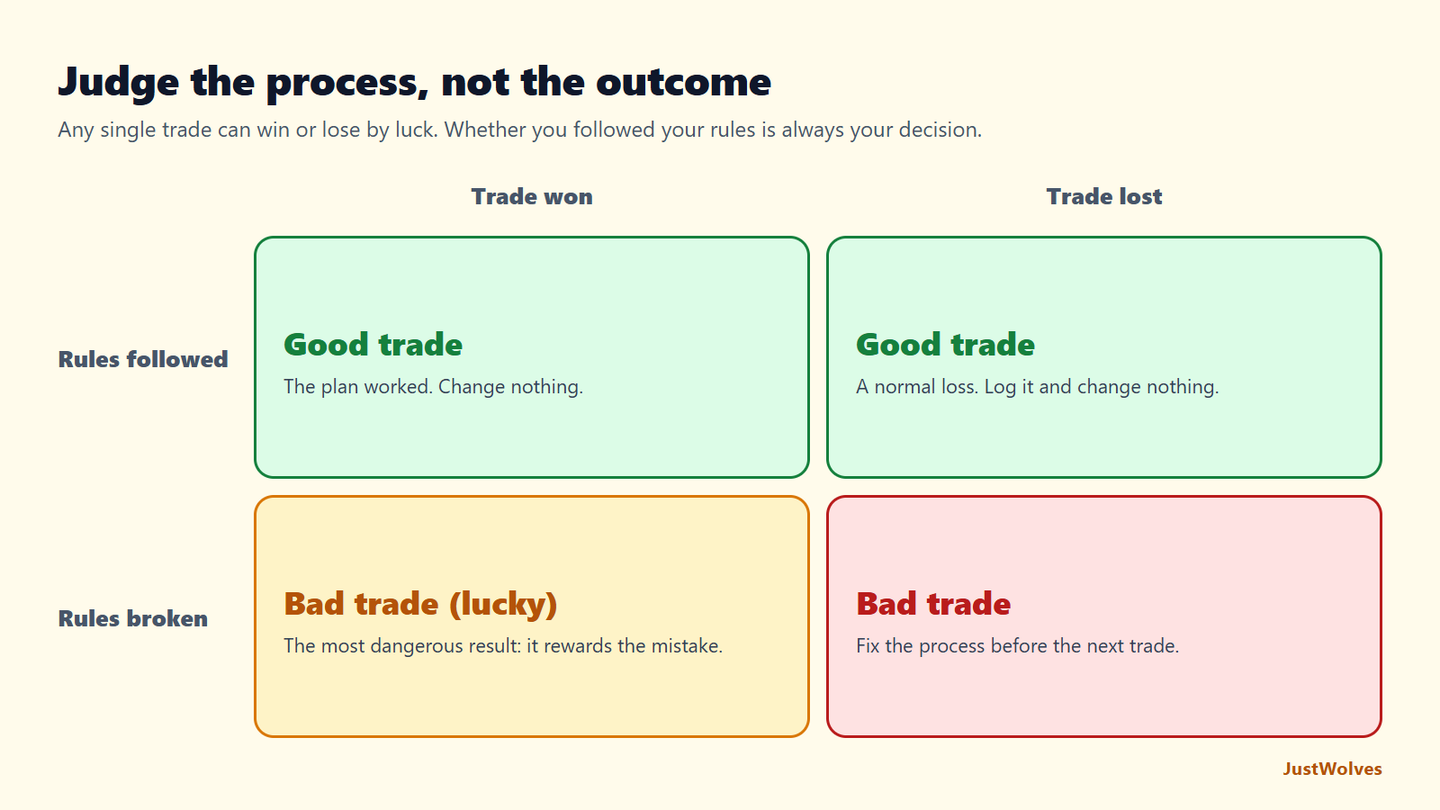
Any single trade can win or lose for reasons outside your control. What you can control is whether you followed your rules. Reviewing trades by process separates good decisions from good luck, and bad decisions from bad luck.
| Won | Lost | |
|---|---|---|
| Followed rules | Good trade | Good trade (a normal loss) |
| Broke rules | Bad trade (lucky) | Bad trade |
Case Study 1: A Winner
All case studies are hypothetical. A capital-goods stock is in a daily uptrend above a rising 50-day MA. It pulls back to broken resistance at ₹2,140–₹2,160. On the 1-hour chart, a candle closes at ₹2,168 above the last lower high. The stop goes below the pullback low at ₹2,128 (₹40 risk), and the prior high is ₹2,270 (₹102, about 2.6R). Every rule is met. Price reaches ₹2,270 four sessions later: +2.6R, rules followed.
Case Study 2: A Rule-Following Loss
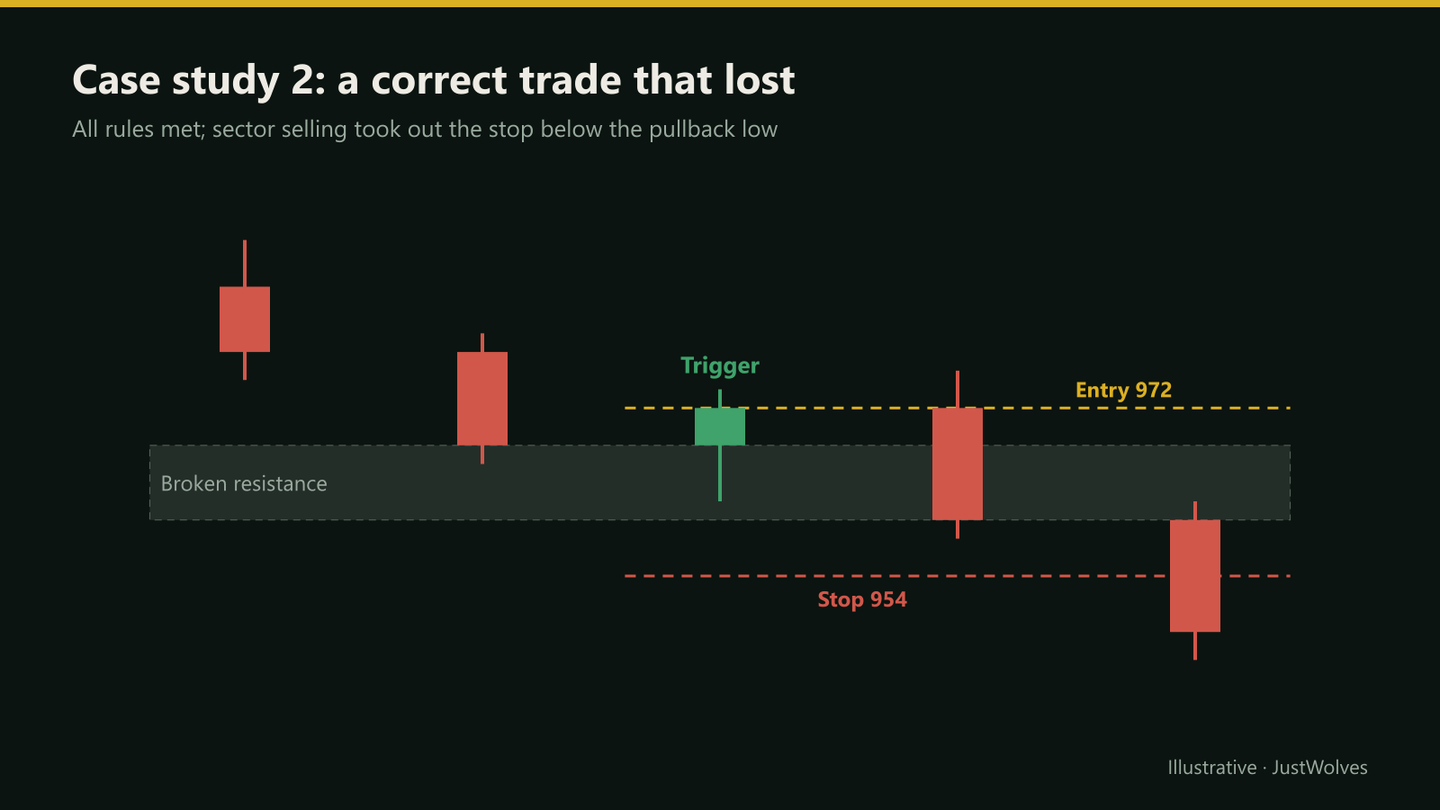
A bank stock meets every condition: uptrend, pullback to broken resistance at ₹960–₹968, and a 1-hour trigger at ₹972. Stop ₹954 (₹18 risk), target ₹1,020 (₹48, about 2.7R). The next day, sector-wide selling pushes the stock through ₹954 and the stop fills: −1R, rules followed. This is a good trade. Nothing in the rules was violated; this is the normal cost of a strategy that doesn't win every time.
Case Study 3: A Correct Skip
An IT stock pulls back to broken resistance at ₹1,505 and triggers at ₹1,512. The stop would be ₹1,488 (₹24 risk), but the prior high is ₹1,550, only ₹38 away, about 1.6R. The rules require at least 2R, so the trade is skipped. The stock later rallies to ₹1,620. Skipping was still correct: the rule exists because, across many trades, low-reward setups tend to drag results down. No trade, rules followed.
The Same Three Cases on Real Charts
The three case studies above are hypothetical. Below are three real examples found by running the course's example strategy on two years of real NSE data: a winner, a loss with every rule followed, and a setup correctly skipped by the 2R filter. Step through each one and judge it the way this lesson asks: by the process, not the outcome.
Real Case 1: A Rule-Following Winner
Real case 1: a rule-following winner, Bharti Airtel, June–July 2026
Step 1 of 4
Level and breakout
A swing high at 1,837 on 9 June breaks on 15 June, and price rallies to 1,927.7. Trend up, level marked.
- What to observe
- Context and location rules met.
- Condition
- Wait for the pullback.
Real Case 2: A Rule-Following Loss
Real case 2: a rule-following loss, Hindustan Unilever, July 2025
Step 1 of 4
A valid setup
A swing high at 2,398 from 13 May breaks on 7 July. Price rallies to 2,532.9, then pulls back into the zone, reaching 2,405.4 on 25 July.
- What to observe
- Trend, level and pullback all as the rules require.
- Condition
- Wait for the trigger.
Case 2 is the one worth studying most. The stop was hit by 2.1 rupees, and the next day the stock went straight to the target. It is tempting to conclude that the stop should have been lower. But a rule that moves stops after the fact cannot be tested and tends to turn many small losses into a few large ones. The right review note is short: "Valid setup, rules followed, normal loss."
Real Case 3: A Correct Skip
Real case 3: a correct skip, Mahindra & Mahindra, October–November 2025
Step 1 of 3
Setup forms
A swing high at 3,501 from 1 October breaks on 16 October. Price reaches 3,676 and pulls back into the zone, to 3,483.7 on 31 October.
- What to observe
- Trend, level and pullback in place.
- Condition
- Wait for the trigger.
Backtesting Price Action by Hand
Manual backtest
Step 1: Freeze the rules
Write them down before you look at any charts. Don't change them during the test.
Step 2: Choose the sample
Markets and dates in advance, including different conditions: trends, ranges, high and low volatility.
Step 3: Hide the future
Use your charting platform's bar replay feature so you only see candles up to the current point.
Step 4: Log every setup
Date, entry, stop, target, result in R, and a screenshot, for every qualifying setup.
Step 5: Include costs
Subtract brokerage, taxes and an allowance for slippage.
Step 6: Summarise
Number of trades, win rate, average win and loss in R, and expectancy.
Reading the Results
The key number is expectancy: the average result per trade in R, calculated as (win rate × average win) − (loss rate × average loss). It's explained in detail in Win Rate, Expectancy and Profit Factor.
For example, if a hypothetical sample showed a 40% win rate, an average win of 2.5R and an average loss of 1R, expectancy would be (0.4 × 2.5) − (0.6 × 1) = +0.4R per trade before costs. A small sample can produce almost any result by chance, so collect a meaningful number of trades, and then confirm with paper trading before going live.
What the Full Backtest Showed
These three cases came from a mechanical backtest of the example strategy on 20 large NSE stocks over about two years of daily data (see Building a Price Action Strategy for the rules).
| Result | Value |
|---|---|
| Setups that triggered | 162 |
| Passed the 2R filter and were taken | 8 |
| Winners among trades taken | 4 of 8 |
| Average per trade taken | +0.89R before costs, +0.75R after |
| Longest losing streak (trades taken) | 3 |
| Skipped setups, if taken | 61% winners, −0.08R average |
The honest summary is that this backtest proves very little about the strategy, and that is the point. Eight trades could be luck in either direction. What it does show clearly is how a backtest should be read: count the trades first, then the results. If the sample is small, the right conclusion is "not enough data yet", and the next step is to widen the test before risking money.
| Trades | If the true win rate is 40%, a sample could easily show |
|---|---|
| 10 | Anywhere from about 10% to 70% winners |
| 30 | About 23% to 57% winners |
| 100 | About 30% to 50% winners |
| 300 | About 34% to 46% winners |
Common Mistakes
- Judging the strategy by its last few trades.
- Skipping losers in the log because they 'shouldn't count'.
- Changing rules mid-test.
- Ignoring costs in the results.
- Going live straight from a small backtest.
Professional Insight
Many professional traders spend more time reviewing than trading. The habit that matters most is honest record-keeping: every setup, every rule break, every cost. Without it, neither a backtest nor a live track record means much.
Risk Considerations
- Past results don't guarantee future results; conditions change.
- Manual backtests are slower and still prone to bias.
- Overfitting: rules tuned to past data often fail on new data.
Important Terminology
| Term | Meaning |
|---|---|
| Backtest | Applying fixed rules to historical data to see how they would have performed. |
| Bar Replay | A charting feature that reveals past candles one at a time. |
| Expectancy | Average result per trade, in R. |
| Hindsight bias | Letting knowledge of what happened next affect decisions. |
| Overfitting | Tuning rules so closely to past data that they fail on new data. |
How do I backtest a price action strategy?
Write your rules first, then use a replay tool to step through past charts candle by candle, logging every qualifying setup and its result in R.
Is manual backtesting reliable?
It's useful but prone to bias. Freezing rules, hiding future candles and logging every setup reduce the bias.
How many trades do I need in a backtest?
Enough that a few lucky or unlucky trades can't change the conclusion. Small samples tell you very little.
Can a losing trade be a good trade?
Yes. If you followed every rule, a loss is a normal part of the strategy's results.
What should I do after a positive backtest?
Paper trade or trade very small to confirm that you can follow the rules live and that results hold up.
Can a trade that follows the rules still be a loss?
Yes. In our real NSE example, a Hindustan Unilever setup met every rule, was stopped out by just 2.1 rupees, and then reached the target the next day. Rule-following losses are a normal part of any strategy.
Is it a mistake to skip a trade that later goes to target?
Not if the skip followed your rules. In our backtest, setups skipped by a 2R filter won more often but lost money on average, so skipping them was the right decision even though some went on to win.
Practical Exercise
Run a first backtest.
Your task
Step 1: Use your strategy
From the previous lesson's exercise.
Step 2: Replay one market
At least one year of daily data with Bar Replay.
Step 3: Log every setup
Including skips and their reasons.
Step 4: Calculate expectancy
After costs. Note your rule-following rate too.
Check Your Understanding
A trade that followed every rule and lost is:
Related Lessons
Previous: Building a Price Action Strategy and Trading Plan. This completes the Price Action course. Continue with the Candlestick Trading course, or see How to Backtest and Trading Journal.