
Volume Analysis: Reading Price and Volume Together
JustWolves is an educational platform and is not a SEBI-registered investment advisor. Trading financial instruments involves significant risk of loss and may not be suitable for all investors. Past performance is not indicative of future results. Read our full disclaimer →
What you'll learn
- Volume is the number of shares or contracts traded in a period; read it relative to its own average
- Rising price with rising volume suggests participation; rising price with falling volume is a warning
- In healthy trends, volume tends to expand on impulses and contract on pullbacks
- Breakouts on above-average volume are generally more reliable than breakouts on thin volume
- Forex has no central volume; most platforms show tick volume, a rough proxy
In this article · 18 sections
Price tells you where the market went. Volume tells you how many shares or contracts changed hands getting there. Read together, they help separate moves with broad participation from moves that happened on thin trading and may not last. This lesson covers how to read volume against its average, the four basic price–volume combinations, and how to use volume in trends, at levels and on breakouts.
What You Will Learn
- What volume measures and how to read it
- The four price–volume combinations
- Volume in trends, at levels and on breakouts
- The limits of volume in forex
Before You Start
Read Consolidation and Trading Ranges and Pullbacks and Retracements first.
What Volume Measures
Volume is the total number of shares, contracts or coins traded during a period. Every trade has a buyer and a seller, so volume measures activity, not buying versus selling. A daily volume bar shows the day's total; an hourly bar shows that hour's.
On Indian exchanges, stocks and futures report actual traded volume. The spot forex market is decentralised, so there's no single volume figure; most forex platforms show tick volume, the number of price changes in each period, as a rough proxy for activity.
Read Volume Against Its Average
Raw volume numbers mean little on their own; what matters is how a bar compares with recent activity. Add a moving average to the volume pane (20 periods is common) and classify each bar:
| Level | Relative to the volume average | Typical meaning |
|---|---|---|
| Low | Well below the average | Little participation; moves may not hold |
| Average | Near the average | Normal activity |
| High | Clearly above the average | Strong participation |
| Very high | Several times the average | Unusual event: news, a climax or a large order flow |
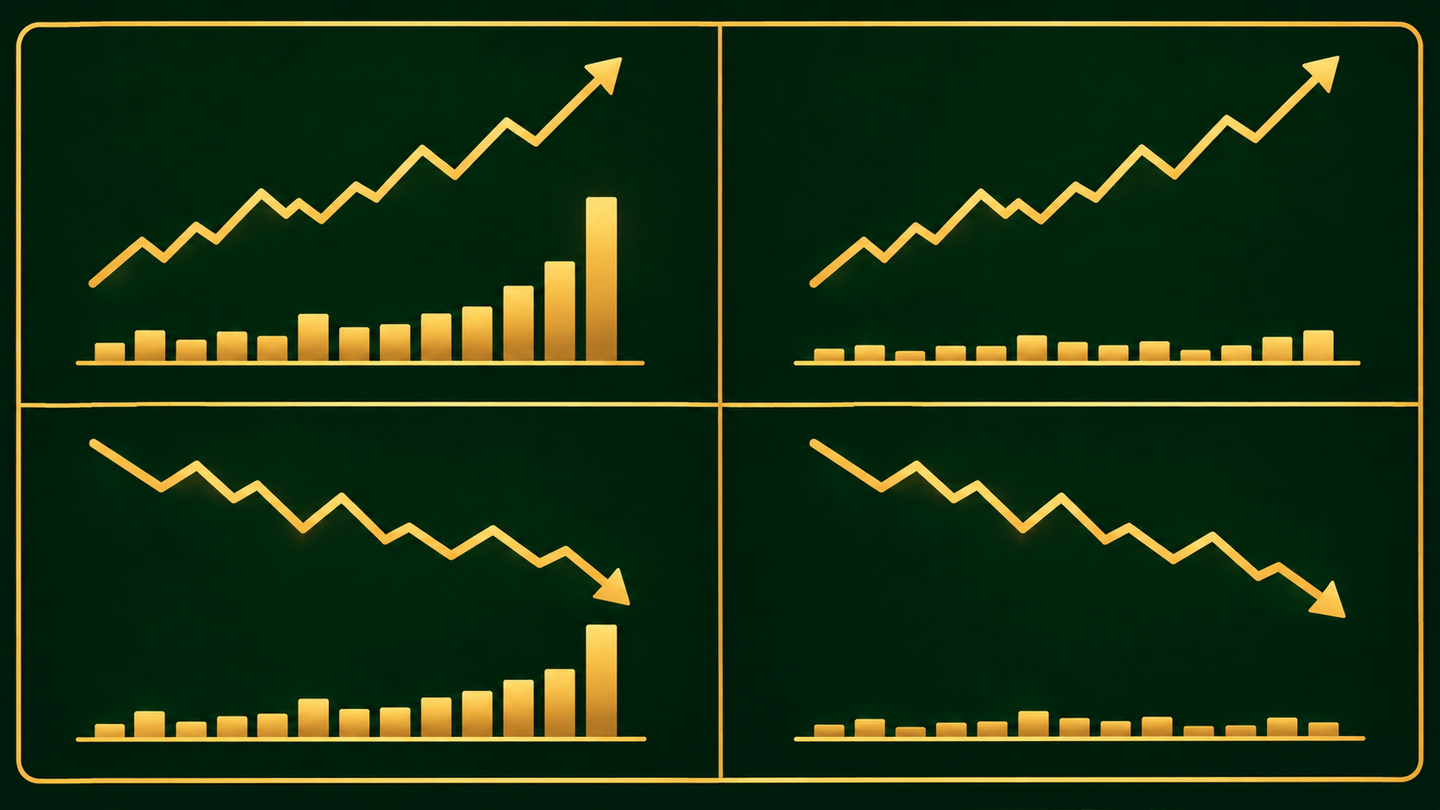
Four Price–Volume Combinations
| Price | Volume | Common reading |
|---|---|---|
| Rising | Rising | Broad participation in the advance; the uptrend looks healthy |
| Rising | Falling | The advance has less participation; a warning, not a signal |
| Falling | Rising | Heavy selling; the decline looks strong |
| Falling | Falling | Selling is drying up; the decline may be slowing |
A fifth case: price moves sideways while volume rises. Near a low, traders often read this as possible accumulation; near a high, possible distribution. Both readings are interpretations and need price confirmation.
Volume in Trends and Pullbacks
In a healthy uptrend, volume tends to expand on the up-moves and contract on the pullbacks. A pullback on light volume suggests sellers aren't committed, which supports the pullback-buying approach from earlier in this module.
A pullback on heavy volume is a warning: sellers are more active, and the pullback may become a reversal. Downtrends mirror this, with heavy volume on declines and light volume on bounces.
Volume at Support and Resistance
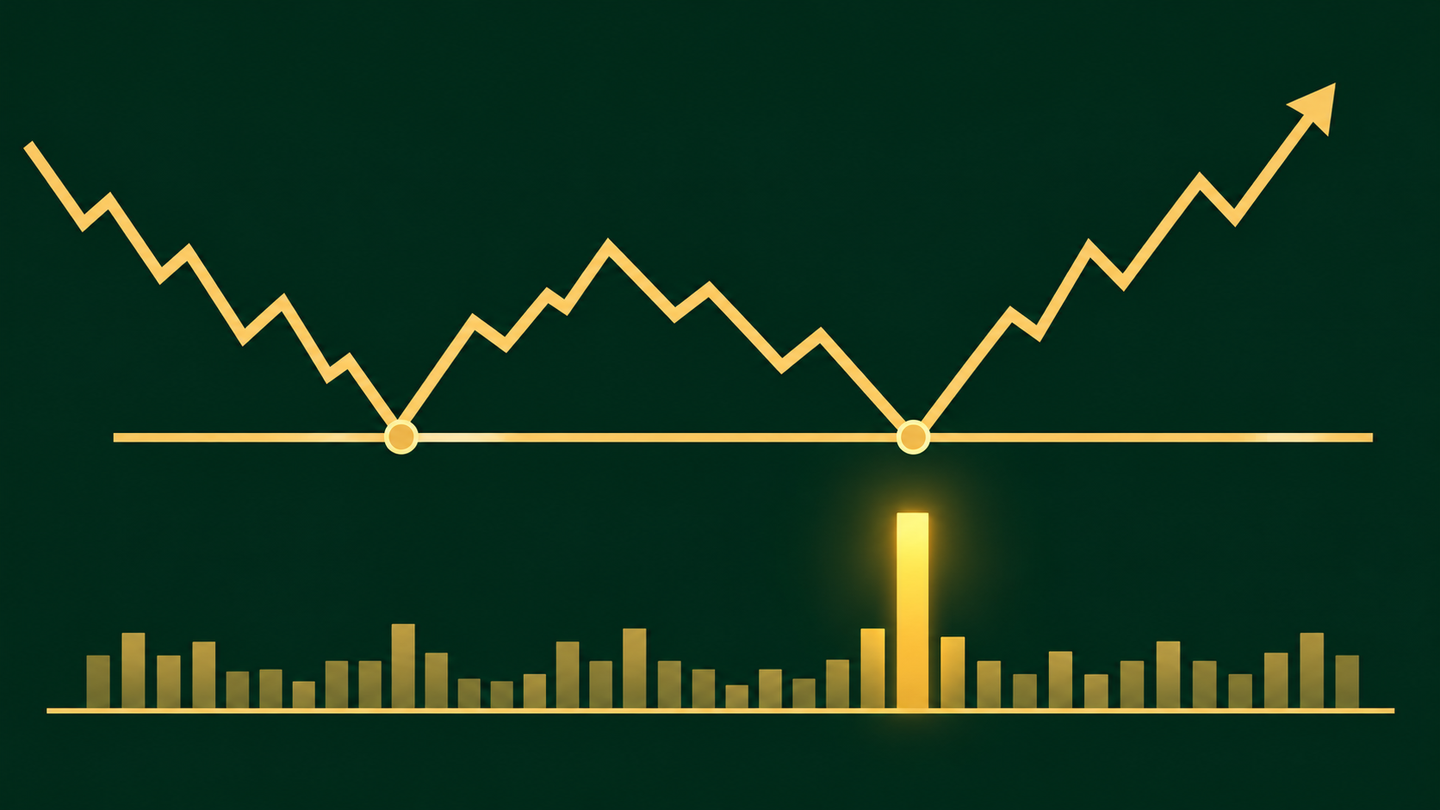
When price reaches a level, volume helps judge the reaction. A high-volume bullish candle at support suggests buyers are actively defending it. A second test of support on a volume spike, followed by a rally, is a common pattern traders watch for.
Breakout Confirmation
Using volume on a breakout
Step 1: Mark the level
A range high or resistance tested at least twice.
Step 2: Watch the build-up
Volume rising as price presses the level is a constructive sign.
Step 3: Breakout candle
A close beyond the level on clearly above-average volume.
Step 4: Retest
A pullback to the level on lighter volume, which then holds.
Volume on a Breakout, Step by Step
The chart below follows the practical example in this lesson. Volume figures are shown as labels under or over the key candles. Step through it to see volume build on the approach, expand on the breakout, and fade on the retest.
A breakout on rising volume, then a quiet retest
Step 1 of 5
Resistance tested three times
The stock turns down from 618–622 three times over two months. Average daily volume is about 40 lakh shares.
- What to observe
- A clear level with repeated tests.
- Condition
- Watch volume on the next approach.
Volume and Exhaustion
If volume stays high but each new push in a trend makes less progress, more effort is producing less result. That divergence between effort and result is one of the exhaustion signs described in Reversals, Momentum and Exhaustion.
What Does Volume Really Tell You? Our Test
JustWolves tested this lesson's main volume readings on about two years of real daily data, with volume, for 20 large NSE stocks across banking, IT, energy, consumer, auto, metals and pharma. Each day's volume was compared with its 20-day average. Costs were excluded.
| Breakout volume | Cases | Still above the level 5 days later | Average 10-day return |
|---|---|---|---|
| 1.5 times average or more | 201 | 64% | −0.37% |
| 1 to 1.5 times average | 174 | 52% | −0.50% |
| Below average | 148 | 56% | −0.35% |
Heavy-volume breakouts held their level more often. Breakouts on at least one and a half times average volume were still above the breakout level five days later in 64% of cases, against 52–56% for the rest. That supports this lesson's breakout guidance: volume improves the odds that a breakout holds.
But notice the last column. None of the groups made money on average over the next ten days. Holding above the level is not the same as continuing higher. As this lesson's warning box says, volume improves the odds; it does not decide the outcome.
| Reading | Cases | Higher 5 days later | Average 5-day return |
|---|---|---|---|
| Down day in an uptrend, light volume (under 0.8× average) | 745 | 50% | −0.12% |
| Down day in an uptrend, heavy volume (over 1.3× average) | 173 | 50% | +0.04% |
| Price up over 5 days, volume rising | 2,198 | 47% | −0.11% |
| Price up over 5 days, volume falling | 2,211 | 50% | +0.06% |
| Price down over 5 days, volume rising | 2,197 | 47% | −0.11% |
| Price down over 5 days, volume falling | 2,454 | 52% | +0.33% |
The other readings were weaker. Light-volume and heavy-volume pullbacks in uptrends were followed by the same results. The four price–volume combinations did not predict the next five days in any useful way; if anything, falling prices on falling volume were followed by slightly better returns, the opposite of a warning.
So the evidence points to a narrow, practical use of volume: as a filter on breakouts, where it made a visible difference, rather than as a general signal. That matches this lesson's Professional Insight: a setup that already makes sense on price and location gets more weight when volume agrees.
Practical Example
Hypothetically, a private-bank stock has resistance at ₹618–₹622, tested three times in two months. Its 20-day average volume is about 40 lakh shares. On the fourth approach, volume rises over three days, and the stock closes at ₹631 on 1.1 crore shares, almost three times the average.
Two days later, it pulls back to ₹624 on 28 lakh shares, below average. Vikram buys at ₹627 with a stop at ₹612, below the old resistance, targeting ₹660: ₹15 of risk for ₹33 of reward.
How to Measure Relative Volume
Relative volume compares today's volume with its recent average: relative volume = today's volume ÷ 20-day average volume. A reading of 1.0 is normal, 1.5 is clearly above average, and 3.0 is a spike.
In the practical example, 1.1 crore shares against a 40-lakh average gives 110 ÷ 40 = 2.75, well above the 1.5 threshold that made a difference in our data. The pullback day's 28 lakh shares gives 0.7, below average.
For intraday charts, compare each candle with the average volume of the same time of day on previous sessions, not with the previous few candles. Volume on Indian markets is usually highest in the first and last hour of the session and lowest around midday, so a midday candle with average volume for midday may look small next to the opening candles while being perfectly normal.
| Day | Effect |
|---|---|
| Monthly and weekly F&O expiry | Higher volume in index heavyweights and derivatives |
| Index rebalancing dates | Large volume in affected stocks near the close |
| Results day | Spikes driven by news, not by the chart |
| Pre-holiday sessions | Often lighter than normal |
Common Mistakes
- Reading volume without price, or price without location.
- Comparing raw volume across stocks instead of against each stock's own average.
- Treating tick volume in forex as equivalent to exchange volume.
- Assuming every spike is institutional buying.
- Ignoring holiday and expiry days, when volume is unusual for calendar reasons.
Professional Insight
Many professionals use volume as a filter rather than a trigger. A setup that already makes sense on price and location gets more weight when volume agrees, and less when volume is thin or contradicts it.
Risk Considerations
- Volume readings are interpretations, not facts about who is buying.
- News days distort volume.
- Illiquid stocks have erratic volume that's hard to read.
Important Terminology
| Term | Meaning |
|---|---|
| Volume | The number of shares or contracts traded in a period. |
| Volume average | A moving average of volume used as a baseline. |
| Tick volume | The number of price changes per period; a forex proxy. |
| Accumulation | Possible buying during a sideways phase near a low. |
| Distribution | Possible selling during a sideways phase near a high. |
What is volume in trading?
The number of shares, contracts or coins traded during a period.
What does high volume mean?
Strong participation. Its meaning depends on the candle's direction and where it occurs on the chart.
Does volume work in forex?
Spot forex has no central volume, so platforms show tick volume, which is a rough proxy. Exchange-traded currency futures do report actual volume.
How do I confirm a breakout with volume?
Look for a close beyond the level on clearly above-average volume, and ideally a retest on lighter volume.
What does falling volume in an uptrend mean?
Less participation in the advance. It's a warning to watch, not a signal to sell on its own.
Do high-volume breakouts work better?
They held their level more often in our data. Across 20 large NSE stocks over two years, breakouts on at least 1.5 times average volume were still above the breakout level five days later 64% of the time, against 52–56% for the rest. None of the groups was profitable on average over ten days, though.
Does low volume on a pullback mean the trend will continue?
Not in our data. On 20 large NSE stocks, down days in uptrends on light volume were followed by the same five-day results as down days on heavy volume.
Practical Exercise
Study ten breakouts.
Your task
Step 1: Add a 20-period volume average
On daily charts of liquid stocks.
Step 2: Find ten breakouts
From ranges or resistance levels.
Step 3: Classify volume
Above or below average on the breakout candle.
Step 4: Compare outcomes
Which group held above the level more often in your sample?
Check Your Understanding
Volume measures:
Related Lessons
Previous: Rejection Blocks. Next module: Reversal Chart Patterns. See also Consolidation and Trading Ranges.