
What Is Price Action Trading? A Beginner's Guide
JustWolves is an educational platform and is not a SEBI-registered investment advisor. Trading financial instruments involves significant risk of loss and may not be suitable for all investors. Past performance is not indicative of future results. Read our full disclaimer →
What you'll learn
- Price action trading means making decisions mainly from the price chart itself
- Its building blocks are trend, swing points, key levels, candles and how price behaves at those levels
- Indicators are optional; when used, they support the chart rather than replace it
- Price action works on any liquid market: Indian stocks, Nifty, forex, commodities
- It's still subjective; written rules and risk management turn it into a method
In this article · 18 sections
Price action trading is one of the most popular ways to approach the markets, and one of the simplest to describe: you read what price is doing on the chart, and you make decisions from that, rather than from a stack of indicators. This first lesson explains what price action traders actually look at, how the approach compares with indicator-based trading, and what to expect as you learn it.
What You Will Learn
- What price action trading is
- The building blocks price action traders use
- How price action compares with indicator-based trading
- The strengths and limits of the approach
Before You Start
You should be able to read a candlestick chart. If not, start with the Candlestick Patterns course. Risk Management Basics is also worth reading early.
What Price Action Means
Price action is the movement of price over time, as shown on a chart. A price action trader bases decisions mainly on that movement: where price has been, how it got there, and how it's behaving now at important levels.
Every market participant's buying and selling ends up in price. Price action traders take the view that the chart already contains a lot of useful information, and that learning to read it directly is more valuable than adding calculations on top of it.
The Building Blocks
| Building block | Question it answers | Covered in |
|---|---|---|
| Trend | Is price generally rising, falling or moving sideways? | 04.01.02 |
| Swing highs and lows | Where are the turning points? | 04.01.03 |
| Support and resistance | Where has price reacted before? | Module 04.02 |
| Candles and behaviour | How is price reacting right now? | Module 04.03 |
| Patterns | Is a familiar shape forming? | Module 04.04 |
The Building Blocks on One Chart
The chart below follows the practical example from this lesson step by step: the trend and the level first, then price arriving, then how it behaved, then the plan. Notice that the decision comes from the combination, not from any single candle.
Reading price action: level, behaviour, follow-through
Step 1 of 5
Context: trend and a level
The index has been rising and has just made a high at 24,600. Below, around 24,200, is a level where it bounced twice last month.
- What to observe
- An uptrend with a marked support level.
- Condition
- Plan in advance: look for buying interest if price returns to 24,200.
Real Case: Reading a Live Chart from the Past
The chart below uses real NIFTY 50 hourly candles from June 2026 and applies the same reading order as the example above: trend, level, behaviour, then risk. Step through it and notice that the read was right, yet the trade still fell just short of its target.
Real case: level, behaviour, follow-through, NIFTY 50 hourly, June 2026
Step 1 of 5
Trend and level first
In June 2026 NIFTY's daily trend is up. On the hourly chart, a swing low at 23,903 from 16 June marks support, and the latest high is 24,189 on 18 June.
- What to observe
- Context and location marked before price arrives.
- Condition
- Watch for a return to 23,900.
Price Action vs Indicators
| Price action | Indicator-based | |
|---|---|---|
| Main input | The price chart itself | Calculations from price (averages, oscillators) |
| Timing | Reacts to what price is doing now | Many indicators lag price |
| Subjectivity | Higher; needs clear rules | Lower; signals are mechanical |
| Chart | Clean | Can become cluttered |
Most indicators are calculated from price, so they can't contain information price doesn't. Many price action traders still use one or two, such as a moving average for trend or ATR for stop distance (lesson 04.04.04). The difference is that the chart leads and the indicator supports.
Where It Works
Price action applies to any liquid market: Nifty and Bank Nifty, liquid Indian stocks, currency futures and forex, gold. It works on any timeframe, from daily charts for swing trading to 5-minute charts for intraday trading, though lower timeframes are noisier. Thinly traded stocks with gaps and erratic candles are much harder to read.
Strengths and Limits
- Strength: flexible and transferable across markets and timeframes.
- Strength: encourages you to understand why price moves, not just follow signals.
- Limit: subjective. Two traders can read the same chart differently.
- Limit: hindsight makes patterns look obvious; in real time they aren't.
- Limit: no method removes risk. Price action needs the same stops and position sizing as any other approach.
Do Single Candles Predict Anything? Our Test
Beginners often look for one candle that tells them what happens next. JustWolves tested two common single-candle readings on about two years of real daily candles for NIFTY 50, EUR/USD, GBP/USD, USD/JPY and gold.
Test 1: a close beyond the previous day's range. A close above yesterday's high is often read as strength, and a close below yesterday's low as weakness. Did the next day continue?
Test 2: a rejection candle at a low. A day that traded below the lowest low of the previous 20 days, then closed back above it in the top third of its range. Was price higher five days later?
| Reading | Cases | Followed through |
|---|---|---|
| Close above previous day's high → next day higher | 672 | 51% |
| Close below previous day's low → next day lower | 590 | 44% |
| Rejection candle at a 20-day low → higher 5 days later | 60 | 52% |
| Any day → higher 5 days later (baseline) | 2,433 | 53% |
None of these single-candle readings predicted the next move better than chance. A close above yesterday's high was followed by a higher close only 51% of the time, and a close below yesterday's low was more often followed by a bounce than by more weakness. The rejection candle at a 20-day low was no better than an ordinary day.
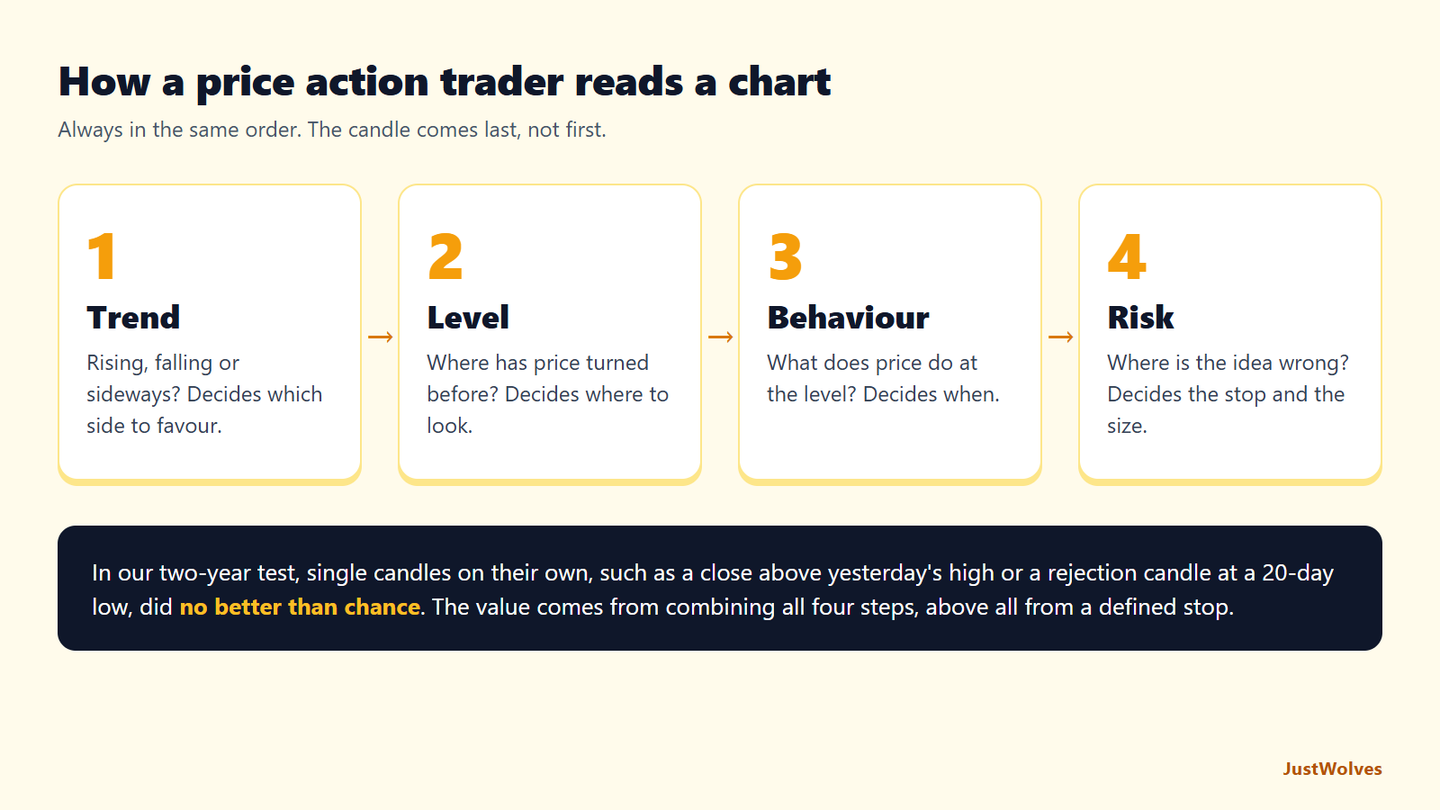
That might sound discouraging, but it is the most useful thing a beginner can learn about price action. Candles describe what happened; they do not forecast on their own. The value of price action comes from combining the building blocks: a trend for direction, a level for location, behaviour at the level as a trigger, and above all a defined stop that tells you when you are wrong. A rejection candle at a level is a good place to take a trade not because it predicts a rise, but because it gives a clear, small risk with room to a target.
Step by Step: How to Learn It
A learning path
Step 1: Learn to read trends and swings
Module 04.01.
Step 2: Learn to mark key levels
Module 04.02.
Step 3: Study behaviour at levels
Module 04.03.
Step 4: Learn patterns and build rules
Module 04.04.
Step 5: Practise and test
Mark charts without trading, then backtest and paper trade before risking money.
Practical Example
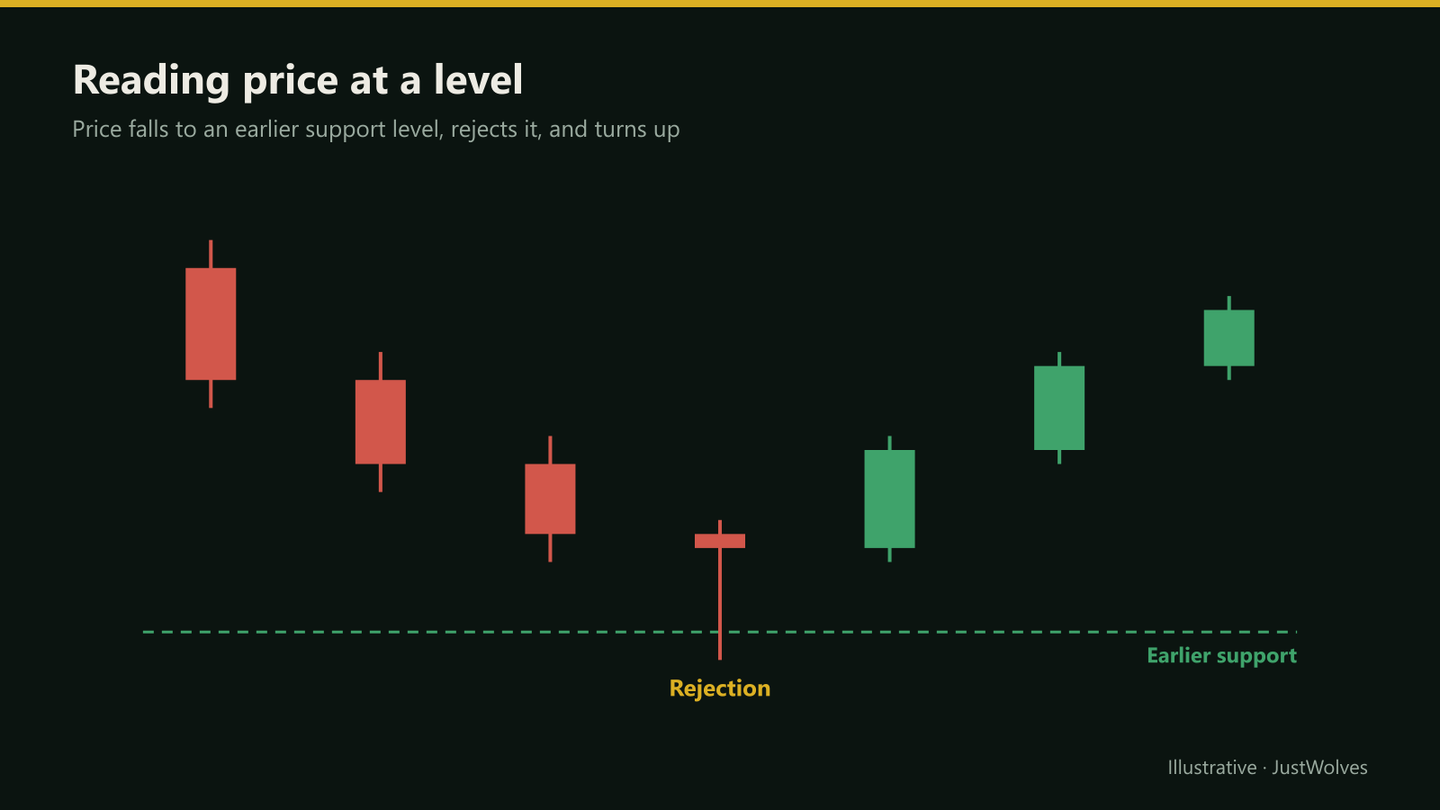
Hypothetically, a trader watches the Nifty 50 on the daily chart. The index has been in an uptrend, and pulls back to 24,200, a level where it bounced twice last month. On the next day, it dips to 24,150 intraday but closes at 24,310.
A price action trader reads this as: uptrend intact, price at an earlier support level, and a rejection of lower prices. That's a reason to consider a long, with a stop below 24,150, not a guarantee. If the next day closes below 24,150, the read was wrong and the stop limits the loss.
Your First Exercise
Before you learn any patterns, practise reading a real chart. The chart below is NIFTY 50 daily data. For any stretch of 20 to 30 days, answer four questions in writing: Is price rising, falling or moving sideways? Where are the last two turning points? Where has price reacted more than once? How did price behave the last time it reached one of those levels?
Do this on ten different stretches without thinking about trades. The building blocks will start to feel familiar, and the rest of this course will make much more sense.
Practice chart: NIFTY 50 daily
Loading historical candles…
How Price Action Relates to Other Methods
Many trading methods are price action under a different name. Support and resistance, chart patterns, supply and demand zones, Smart Money Concepts and candle range methods all read the same raw material: swings, levels and how price behaves around them. They differ mainly in vocabulary and in which details they emphasise.
That is good news. The skills in this course transfer to all of them. If you later study Smart Money Concepts or Candle Range Theory, you will recognise swing points, liquidity above highs and below lows, and the importance of closes. Learn the building blocks well once, and new methods become new labels for things you already understand.
| Price action term | Also called |
|---|---|
| Swing high and low | Fractal, pivot, external structure |
| Break of a swing point | Breakout, break of structure (BOS) |
| First break against the trend | Change of character (CHoCH) |
| Wick through a level, close back inside | False breakout, sweep, stop run |
| Area price left quickly | Supply or demand zone, order block |
Common Mistakes
- Seeing patterns everywhere after studying a few examples.
- No written rules, so every trade is a fresh judgement call.
- Ignoring the bigger trend on a higher timeframe.
- Trading illiquid charts where price action is erratic.
- Skipping risk management because the setup 'looks clear'.
Professional Insight
Many professional discretionary traders describe what they do as reading price and levels, with indicators in a minor role. What separates them from beginners is not a secret pattern but consistency: the same reading process, the same risk per trade, and a record of every decision.
Risk Considerations
- Subjectivity can lead to inconsistent decisions.
- Gaps in stocks and indices can jump past stops.
- Overconfidence after reading a few charts correctly.
Important Terminology
| Term | Meaning |
|---|---|
| Price action | The movement of price over time on a chart. |
| Trend | The general direction of price. |
| Support / resistance | Levels where price has previously reacted. |
| Indicator | A calculation based on price or volume. |
| Rejection | Price trading into a level and being pushed back. |
What is price action trading?
Trading based mainly on reading the price chart itself: trends, swing points, key levels and how price behaves at them.
Is price action better than indicators?
Neither is inherently better. Price action reacts directly to the chart; indicators are mechanical but often lag. Many traders use a little of both.
Does price action work in the Indian market?
Yes. It applies to liquid Indian stocks, Nifty, Bank Nifty and currency futures, as well as forex and commodities.
Is price action trading suitable for beginners?
Yes, if you learn the building blocks step by step, write rules, and practise before risking money.
Which timeframe is best for price action?
Higher timeframes such as daily and 4-hour are cleaner; lower timeframes give more signals but more noise.
Does price action trading work?
It can, as part of a method with written rules and risk management. On its own, a single candle predicts very little: in our two-year daily test, closes beyond the previous day's range and rejection candles at 20-day lows did no better than chance. Context, levels and stop placement are where the value lies.
Is a close above yesterday's high a buy signal?
Not by itself. In our data across NIFTY 50, major currency pairs and gold, the next day closed higher only 51% of the time after a close above the previous day's high.
Can I trade price action without indicators?
Yes. Price action traders read trend, swing points, levels and candle behaviour directly from the chart. Some add one or two tools, such as a moving average or ATR for stop distance, but the chart leads.
Can a correct price action read still fail to reach the target?
Yes. In a real NIFTY example from June 2026, a rejection at support was followed by a rally that stopped 21 points short of the planned target. Reading the chart correctly improves decisions; it does not guarantee outcomes.
Practical Exercise
Read one chart without indicators.
Your task
Step 1: Choose a chart
A daily chart of the Nifty 50 or a liquid stock, indicators off.
Step 2: Describe the trend
Up, down or sideways, in one sentence.
Step 3: Mark two levels
Where price has reacted more than once.
Step 4: Describe the latest behaviour
What did price do at the most recent level?
Check Your Understanding
Price action trading mainly uses:
Related Lessons
Next: Market Trends: Uptrends, Downtrends and Ranges. See also Risk Management Basics.