
Risk Management in Trading: Why It Comes Before Strategy
JustWolves is an educational platform and is not a SEBI-registered investment advisor. Trading financial instruments involves significant risk of loss and may not be suitable for all investors. Past performance is not indicative of future results. Read our full disclaimer →
What you'll learn
- No strategy wins every trade, so long losing streaks are normal and must be planned for
- Losses and gains are not symmetrical: a 50% loss needs a 100% gain to recover
- Risking a small, fixed share of your account per trade keeps a bad streak survivable
- Before every trade, fix three numbers: where you are wrong, how much you will lose there, and the position size that matches
- Risk management can't make a bad strategy profitable, but poor risk management can ruin a good one
In this article · 14 sections
Ask a new trader what matters most and they'll usually say the strategy: the entry signal, the indicator, the setup. Ask a trader who has lasted ten years and you'll usually hear something duller: how much they risk per trade. This lesson explains why that answer is right, using nothing more than arithmetic.
What You Will Learn
- Why losing streaks are certain, even for a good strategy
- The arithmetic of drawdowns, and why big losses are so hard to recover from
- How the size of each bet, more than the strategy, decides whether you survive
- The three numbers to settle before any trade
Before You Start
No prior knowledge is needed. This is the first lesson of the Risk Management course and a sensible first lesson for anyone new to trading. You'll only need basic percentages.
Every Strategy Loses, Often in a Row
No method wins every time. A strategy that wins 40% of its trades and makes twice as much on a winner as it loses on a loser is a good strategy. It will also lose six times out of ten.
Losses don't arrive neatly spaced out. They cluster. With a 40% win rate, the chance of hitting at least one run of eight losses in a row somewhere in 200 trades is about 75%, and over 300 trades it is about 88%. Even a coin-flip strategy has a better-than-even chance of six straight losses in 100 trades.
| Win rate | Number of trades | Streak length | Chance of at least one such streak |
|---|---|---|---|
| 50% | 100 | 6 losses | about 55% |
| 40% | 100 | 5 losses | about 98% |
| 40% | 200 | 8 losses | about 75% |
| 40% | 300 | 8 losses | about 88% |
| 40% | 200 | 10 losses | about 38% |
So the question is not whether you'll face a long losing streak, but what your account looks like when it ends. That depends almost entirely on how much you risked on each trade.
The Size of Each Bet Decides Whether You Survive
Here is the same streak of eight losses at four different risk levels. Each trade risks a fixed percentage of the account as it stands at the time:
| Risk per trade | After 8 losses | After 10 losses |
|---|---|---|
| 1% | 92.3% | 90.4% |
| 2% | 85.1% | 81.7% |
| 5% | 66.3% | 59.9% |
| 10% | 43.0% | 34.9% |
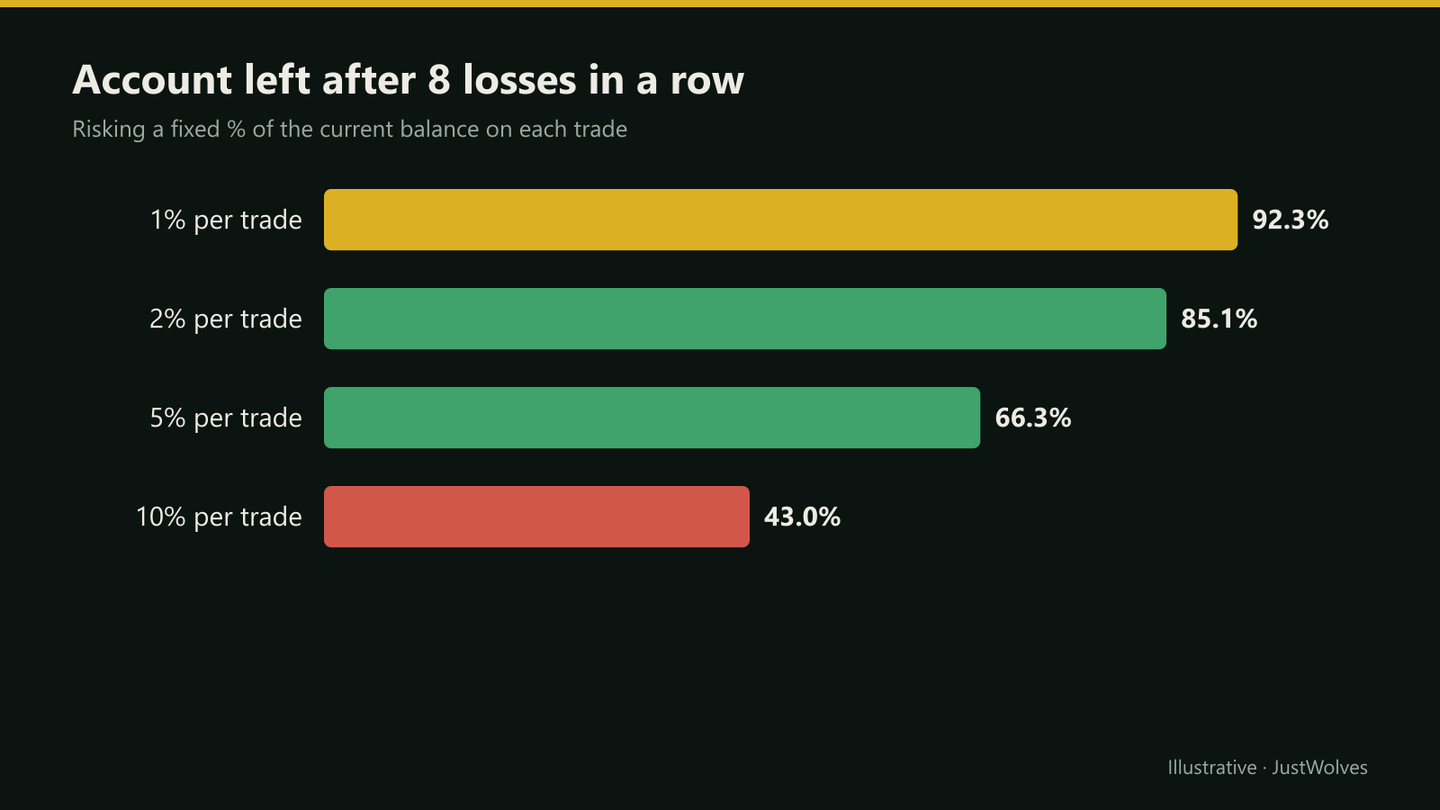
At 1% a trader shrugs off the streak and keeps trading the same plan. At 10% the same strategy has lost well over half the account, and the trader now faces a far harder problem: getting it back.
The Arithmetic of Drawdowns
A drawdown is the fall from your account's peak to its lowest point. Losses and gains aren't symmetrical: after a loss, you're earning a return on a smaller amount, so you need a bigger percentage gain to get back to where you started.
| Drawdown | Gain needed to break even |
|---|---|
| 10% | 11.1% |
| 20% | 25% |
| 30% | 42.9% |
| 40% | 66.7% |
| 50% | 100% |
| 75% | 300% |
| 90% | 900% |
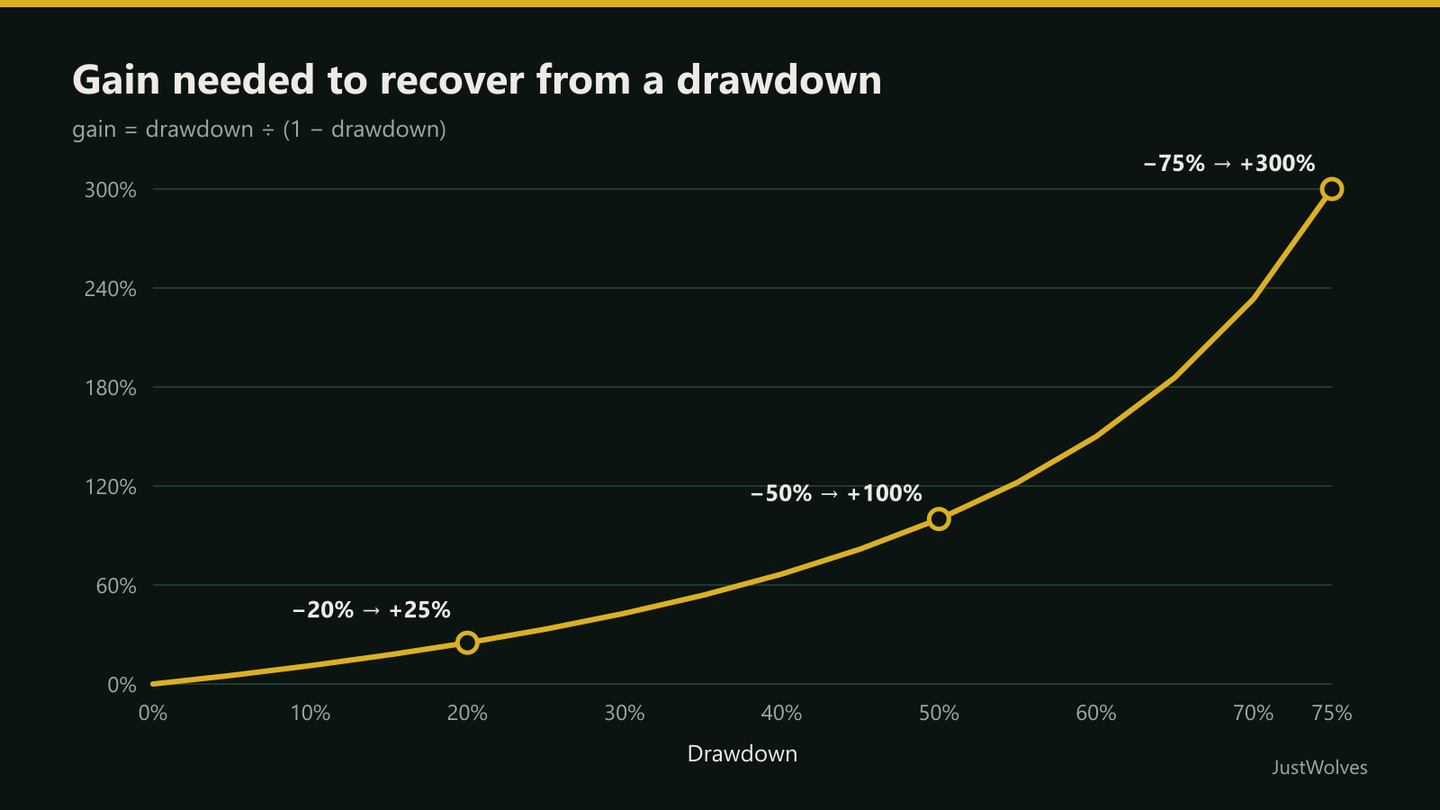
The formula is: gain needed = drawdown ÷ (1 − drawdown). Below about 20% the recovery is manageable. Beyond 50%, recovery depends on returns few traders ever achieve, which is why protecting the account matters more than growing it quickly.
Real Prices: Drawdown Maths on NIFTY 50
The recovery table in this lesson applies to markets as well as accounts. The chart below shows it on real NIFTY 50 prices from December 2025 to November 2026: a 15.6% fall from the January peak, and how far the index still had to go ten months later.
Real prices: drawdown and recovery maths on NIFTY 50, December 2025 – November 2026
Step 1 of 4
The peak
NIFTY 50 closes at 26,328.6 on 2 January 2026, its highest close in our data.
- What to observe
- Every drawdown is measured from a peak like this.
- Condition
- Watch how far it falls, and how far it then has to rise.
The Three Numbers to Fix Before Any Trade
Your pre-trade risk check
Step 1: Where am I wrong?
Decide the price at which your trade idea is invalidated, from the chart, before you enter. That is your stop-loss. It should sit where the market would prove you wrong, not at a round number of rupees you are comfortable losing.
Step 2: How much will I lose there?
Choose a fixed share of your account to risk on any single trade. Many traders use 0.5–1%; beginners should start at the low end. On a ₹2,00,000 account, 1% is ₹2,000.
Step 3: What position size makes those match?
Divide your rupee risk by the loss per unit if the stop is hit. If the stop is ₹10 away on a stock and you're risking ₹2,000, you buy 200 shares. Lesson 12.01.03 covers this for stocks, F&O lots and forex.
Notice the order. The stop comes from the chart, the rupee risk comes from your account, and the position size is simply the result. Most beginners do it backwards: they pick a size they like and then place the stop wherever the loss feels bearable.
A Practical Example
Two traders each have ₹3,00,000 and the same strategy: a 45% win rate, with winners averaging twice the size of losers. Over a month they hit the same run of seven losses.
Trader A risks 1% per trade. Seven losses cost about 6.8% of the account; it stands near ₹2,79,600. She keeps following the plan, and the winners that follow bring it back.
Trader B risks 8% per trade because he wants faster results. Seven losses leave about 55.8% of the account, near ₹1,67,400. He now needs a gain of almost 80% just to break even. Under that pressure he increases size to 'win it back', which is how most accounts that blow up actually blow up.
Losing Streaks and Bet Size on Real Trades
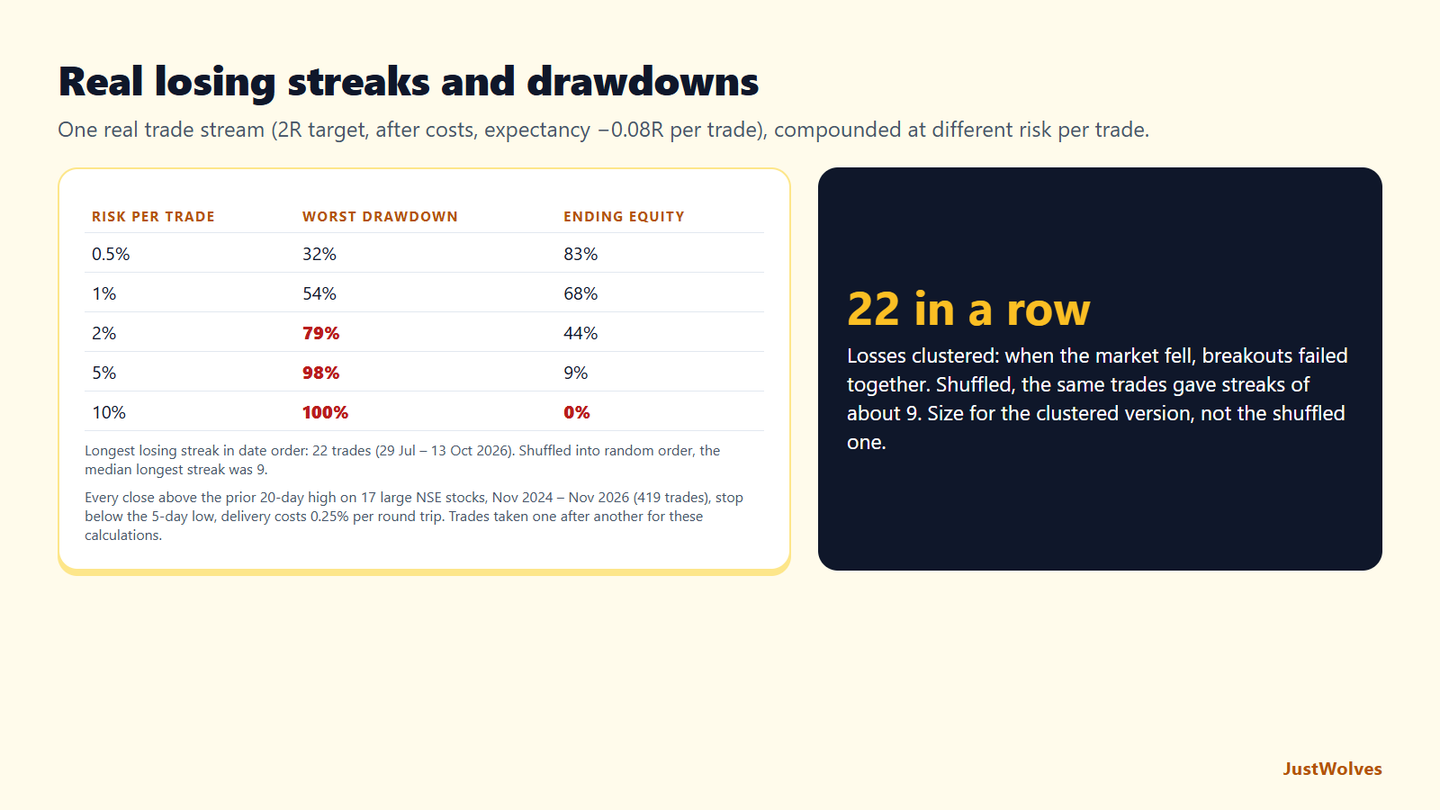
To see this lesson's three numbers at work on real trades, JustWolves took one simple strategy: every close above the prior 20-day high on 17 large NSE stocks from November 2024 to November 2026, with a stop below the previous five days' low and a 2R target, after delivery costs of 0.25% per round trip. That gave 419 trades with an expectancy of −0.08R each, close to breakeven like many real strategies. We then compounded the trades in date order at different risk per trade, treating them one after another, and measured the longest losing streak.
| Risk per trade | Worst drawdown | Ending equity (start = 100%) |
|---|---|---|
| 0.5% | 32% | 83% |
| 1% | 54% | 68% |
| 2% | 79% | 44% |
| 5% | 98% | 9% |
| 10% | 100% | 0% |
Bet size decided the outcome, not the trades. The trades were identical in every row. At 0.5% risk the worst drawdown was about a third of the account; at 5% the account was almost wiped out; at 10% it was. This is the core of this lesson: with a modest or uncertain edge, survival depends on how much you risk on each trade.
The real losing streak was far longer than the "average" one. In date order, this strategy lost 22 trades in a row between 29 July and 13 October 2026, as NIFTY fell toward its October low and breakouts failed across many stocks at once. Shuffled into a random order, the same trades gave a median longest streak of only 9. Losses cluster when the market turns, so planning for the shuffled streak underestimates the real risk.
Drawdowns took a long time to repair. As the NIFTY chart above shows, a 15% fall needs an 18% gain to recover, and the market itself had not recovered ten months later. An account that falls 54%, as this stream did at 1% risk, needs to more than double.
The three numbers in this lesson, risk per trade, the longest losing streak you plan for, and the drawdown you can tolerate, should be set with streaks like this in mind.
Common Mistakes
- Sizing by feel. Taking 'a few lots' without calculating what the stop-loss would cost.
- Moving the stop to avoid a loss. That turns a planned small loss into an unplanned large one.
- Raising risk after losses to win it back. This is the fastest route to a deep drawdown.
- Judging a strategy on a handful of trades. Streaks mean ten trades tell you almost nothing.
- Ignoring costs. Brokerage, taxes and slippage make every loss slightly bigger and every win slightly smaller.
Professional Insight
Professional traders and fund managers are judged as much on their drawdowns as on their returns, and many work under hard limits: a maximum loss per day, per month, or from the peak. They think about risk first because they know that losing streaks will come and that their job is to still be trading when the streak ends.
Amateurs ask how much they can make on a trade. Professionals ask how much they can lose.
Risk Considerations
- Gaps: a stop-loss is an instruction, not a guarantee. Overnight gaps and fast markets can fill you well beyond your stop.
- Leverage: futures, options and forex magnify both gains and losses; the same rules apply, but the margin you post is not the amount you can lose.
- Correlation: several positions in related markets can behave like one large position. Lesson 12.02.06 covers total exposure.
Important Terminology
| Term | Meaning |
|---|---|
| Risk per trade | The share of your account you would lose if a trade's stop-loss is hit. |
| Stop-loss | The price at which you exit a losing trade because your trade idea has been proven wrong. |
| Position size | How many shares, lots or units you trade; it decides how much the stop-loss costs. |
| Losing streak | A run of consecutive losing trades. Normal for every strategy. |
| Drawdown | The fall from an account's peak value to its lowest point before a new peak. |
| R | One unit of risk: the amount lost if the stop is hit. A trade that makes twice its risk made 2R. |
| Capital preservation | Protecting the account from large losses so that it survives long enough to compound. |
What is risk management in trading?
It is the set of rules that limit how much you can lose: where you exit a losing trade, how much of your account you risk on each trade, how large your positions are, and when you stop trading for the day or month. Its job is to keep you in the game long enough for a good strategy to work.
How much should I risk per trade?
Many traders risk 0.5–1% of their account on each trade, and beginners are usually better off at the lower end. The exact figure matters less than keeping it small and consistent.
Is a stop-loss enough risk management?
No. A stop-loss defines where you exit, but your position size decides how much that exit costs. A tight stop on an oversized position can still lose a large share of your account.
Why do traders blow up accounts?
Usually not because of one bad trade, but because they risk too much per trade, then increase size after losses to recover quickly. A normal losing streak becomes a deep drawdown, and the recovery maths becomes impossible.
How long can a losing streak be for a real strategy?
Longer than most traders expect. A simple breakout strategy on 17 NSE stocks lost 22 trades in a row between July and October 2026, when breakouts failed together in a falling market, though random reshuffles of the same trades gave a median longest streak of 9.
Practical Exercise
Work these out for your own account, or use ₹2,00,000 if you don't have one yet. A calculator is enough.
Your task
Step 1: Find your rupee risk
Calculate 0.5% and 1% of the account. These are the most you would lose on one trade.
Step 2: Run a losing streak
Multiply the account by 0.99 eight times (1% risk), then by 0.95 eight times (5% risk). Note what is left each time.
Step 3: Price the recovery
For each result, calculate the gain needed to get back to the starting balance: drawdown ÷ (1 − drawdown).
Step 4: Write your rule
Write one sentence you will follow: 'I will risk no more than ___% of my account on any trade.'
Check Your Understanding
An account falls 50% from its peak. What gain is needed to get back to the peak?
Related Lessons
Next: Lesson 12.01.03, Position Sizing and the 1% Rule, turns the three numbers into an exact quantity for stocks, F&O and forex. You can also try the position size calculator.