
Stop-Loss Orders: Where to Place Them and How They Work
JustWolves is an educational platform and is not a SEBI-registered investment advisor. Trading financial instruments involves significant risk of loss and may not be suitable for all investors. Past performance is not indicative of future results. Read our full disclaimer →
What you'll learn
- A stop-loss belongs where your trade idea is proven wrong, not where the loss feels comfortable
- Place stops beyond structure with a small buffer, and size the position to fit the stop
- ATR-based stops adapt the distance to how much the market normally moves
- Stop-market orders get you out but can fill worse than your price; stop-limit orders may not fill at all
- A stop is an instruction, not a guarantee: gaps can fill you well beyond it
In this article · 15 sections
Every trade needs an answer to one question before you enter: at what price am I wrong? The stop-loss is that answer turned into an order. Placed well, it turns an unknown loss into a planned, affordable one. Placed badly, too close, too far or not at all, it is the most common reason a good idea becomes a bad trade.
What You Will Learn
- What a stop-loss order does, and what it can't do
- Three ways to decide where a stop goes: structure, volatility (ATR) and time
- The difference between stop-market and stop-limit orders, and why it matters in fast markets
- How to combine stop placement with position sizing
Before You Start
Read Position Sizing and the 1% Rule first: stop placement and position size are two halves of one decision. It also helps to be able to spot swing highs and lows on a chart; How to Draw Support and Resistance covers this.
What a Stop-Loss Order Is
A stop-loss order is an instruction to your broker to close a position if price reaches a level you choose. For a long position the stop sits below your entry; for a short position it sits above.
The order sits dormant until price touches the stop level, the trigger price. It then becomes a live order to exit. What kind of order it becomes, market or limit, decides how you get out, which is covered below.
The stop has two jobs. It caps the loss on this trade at an amount you chose in advance, and it removes the decision from the moment when you are least able to make it well: when a position is moving against you.
Where a Stop Belongs
The most important principle: the stop goes where your reason for the trade stops being true. If you bought because price held a support zone, the trade idea is wrong once price closes clearly through that zone. A stop placed anywhere else is either too tight, so normal noise hits it, or too loose, costing more than the idea justifies.
1. Structure-based stops
Place the stop just beyond the swing low (for a long) or swing high (for a short) that your trade depends on, plus a small buffer for spread and noise. Many traders use a few ticks, a fraction of a rupee on a stock, or a small fraction of the average range. This is the default method throughout this course.
2. Volatility-based (ATR) stops
The Average True Range (ATR) measures how far a market typically moves per candle. An ATR stop sits a multiple of ATR away from entry, commonly 1.5–2 × ATR. It automatically widens in volatile markets and tightens in quiet ones, so you aren't stopped out by ordinary movement. ATR stops work well alongside structure: check that the structural stop is at least about one ATR away, or it is probably inside normal noise.
3. Time stops
Some setups should work quickly or not at all. A time stop closes the trade if it hasn't moved as expected within a set number of candles or days, even if the price stop hasn't been hit. It frees capital and attention from ideas that have gone stale.
Step by Step: Placing a Structure-Based Stop
From chart to order
Step 1: Identify what the trade depends on
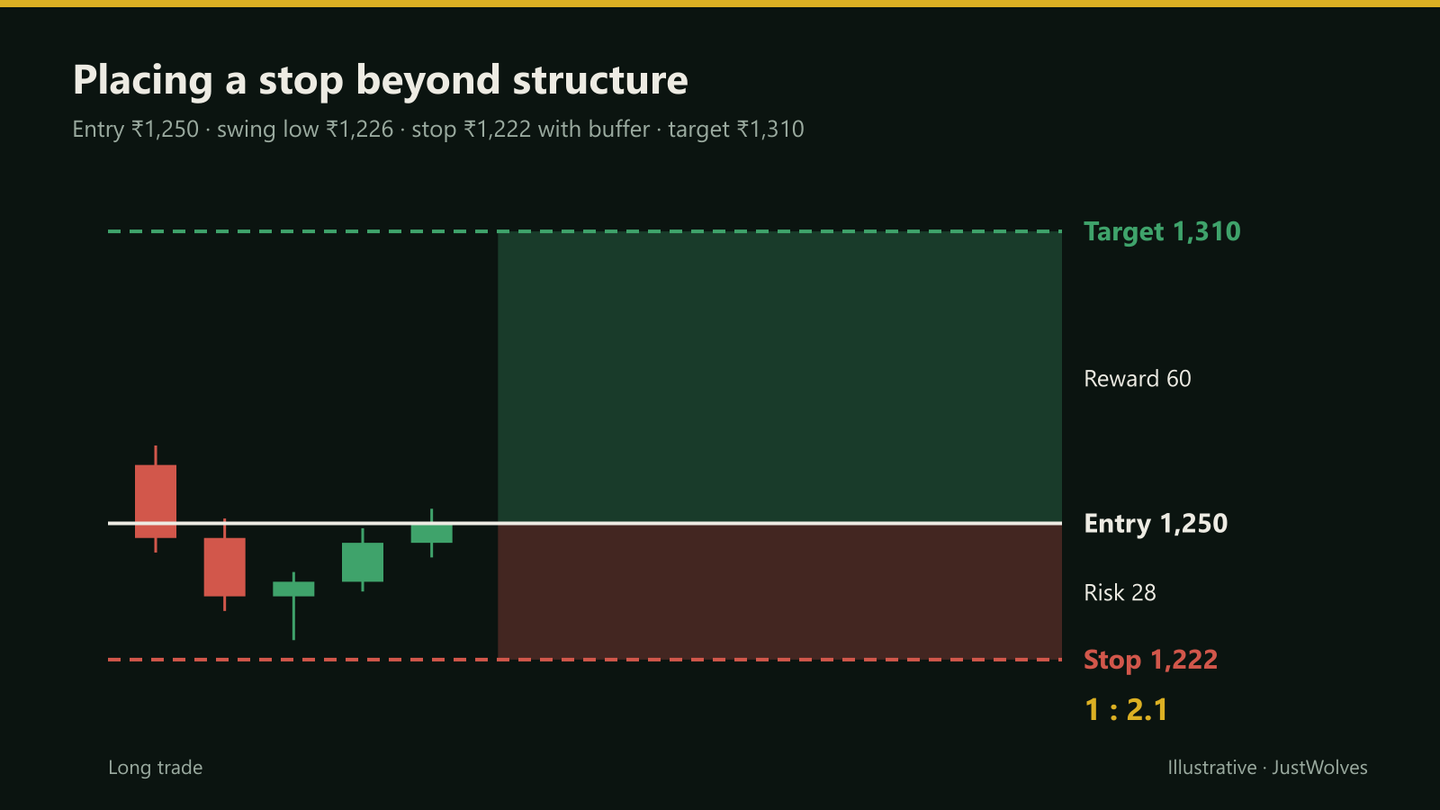
For example: price is holding above a swing low at ₹1,226 after pulling back into support.
Step 2: Put the stop beyond it with a buffer
Below ₹1,226 plus a small buffer: ₹1,222.
Step 3: Check it against volatility
If daily ATR is about ₹24, a ₹28 stop distance is a little over one ATR, outside ordinary noise.
Step 4: Size the position
Risking ₹5,000 with a ₹28 stop distance: ₹5,000 ÷ ₹28 = 178 shares (rounded down).
Step 5: Check the reward
With a first target at ₹1,310, the trade offers ₹60 of reward for ₹28 of risk, about 1:2.1.
Step 6: Place the order immediately
Enter the stop order as soon as the entry fills. A stop that lives only in your head is not a stop.
Stop-Market vs Stop-Limit Orders
When your stop is triggered, it becomes one of two kinds of order:
| Stop-market (SL-M) | Stop-limit (SL) | |
|---|---|---|
| When triggered | Becomes a market order | Becomes a limit order at your limit price |
| Will it fill? | Almost always | Only at your limit price or better |
| Fill price | Can be worse than the trigger in fast markets | Never worse than your limit |
| Main risk | Slippage | No fill at all while price runs away |
For protecting a position, getting out matters more than the exact price, so many traders prefer a stop-market order or a stop-limit with a generous gap between trigger and limit. A stop-limit with the limit equal to the trigger can leave you holding a losing position in a fast fall, which is the opposite of what a stop is for.
Gaps and Slippage: What a Stop Can't Do
A stop is triggered by the next traded price at or beyond your level. If the market gaps, for example opening 3% lower after overnight news, the first traded price may already be far past your stop, and that is where you'll be filled.
On a ₹1,250 stock with a stop at ₹1,222, a gap open at ₹1,190 fills you around ₹1,190: a ₹60 loss per share instead of ₹28, more than twice the planned risk. This is why traders who hold overnight keep risk per trade modest, avoid holding through scheduled events they can't afford to gap through, and treat 1R as a planned loss rather than a maximum.
Real Prices: A Stop Jumped by a Gap
The gap section above describes how a stop can fill far past its level. The chart below shows it on a real trade: an Axis Bank breakout in June 2025 with a structural stop, which opened ₹55 below that stop on 18 July.
Real prices: a stop-loss jumped by an opening gap, Axis Bank, June–July 2025
Step 1 of 4
The trade
Axis Bank closes at ₹1,232.8 on 10 June 2025, above its 20-day high. The structural stop goes below the previous five days' low (₹1,151.2) with a small buffer: ₹1,145.4, about ₹87 of risk.
- What to observe
- A stop placed where the breakout idea is wrong, as this lesson recommends.
- Condition
- Planned loss if stopped: 1R.
Practical Example: Two Traders, One Setup
Both traders buy the same stock at ₹1,250 for the same reason. Trader A wants to risk ₹5,000 and places a structural stop at ₹1,222, so buys 178 shares. Trader B also wants to risk ₹5,000 but prefers a 'tight' stop at ₹1,245 so he can buy 1,000 shares.
The next morning the stock dips to ₹1,238 on ordinary selling, then rallies to ₹1,310. Trader A's stop was never touched; she makes ₹60 × 178 = ₹10,680. Trader B was stopped out at ₹1,245 for −₹5,000, before the move he had correctly anticipated. Same idea, same risk budget; the difference was where the stop sat.
Which Stops Worked on Real Trades? Our Test
JustWolves compared this lesson's stop methods on the same real entries: every close above the prior 20-day high on 17 large NSE stocks from November 2024 to November 2026, 419 trades. Each used a 2R target, delivery costs of 0.25% per round trip, and a time exit after 40 sessions. Only the stop changed: the structural stop below the previous five days' low with a quarter-ATR buffer, ATR stops 1, 1.5 and 2 ATR below entry, and a "tight" stop just below the breakout level. We also counted how often a stop-out was filled by a gap below the stop.
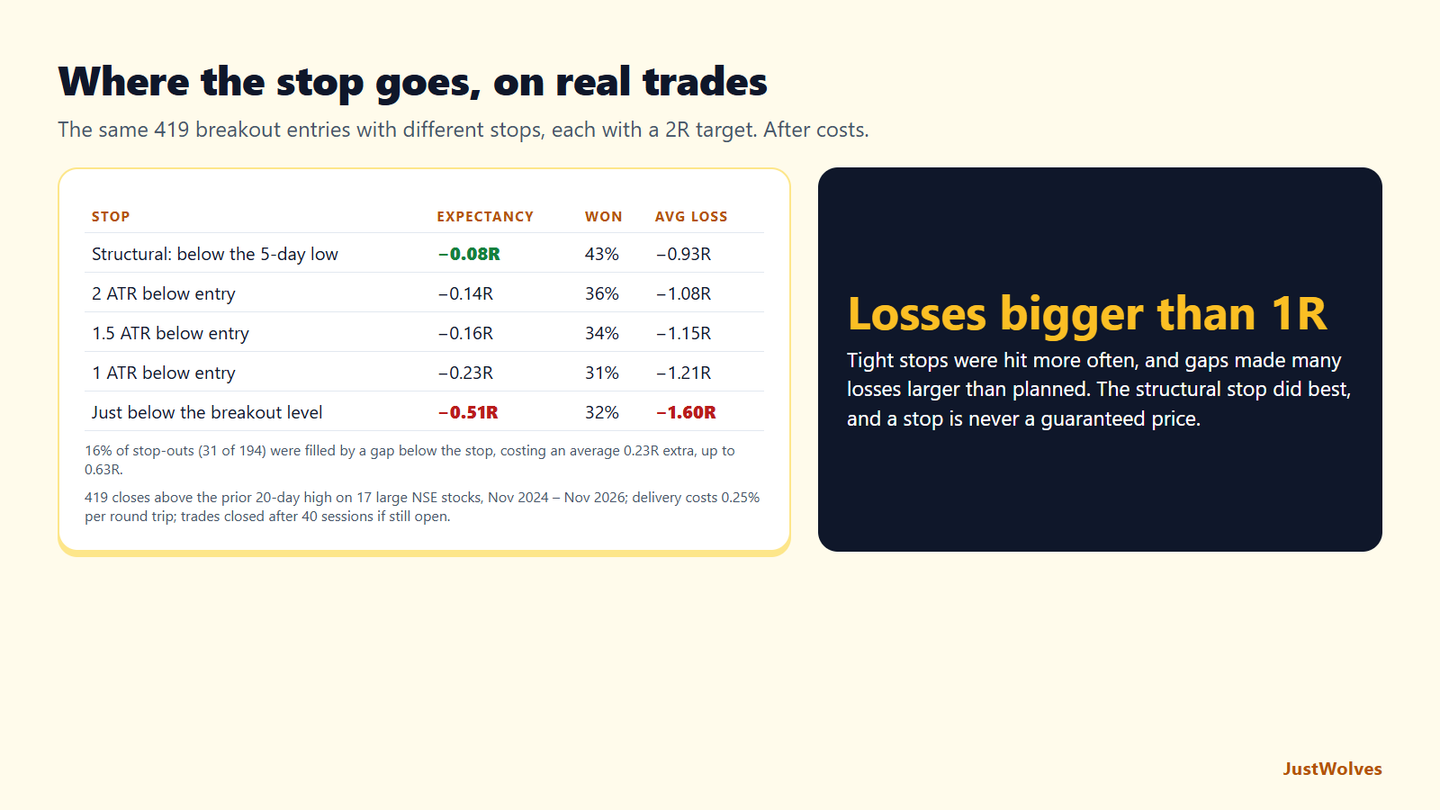
| Stop | Expectancy | Won | Average loss |
|---|---|---|---|
| Structural: below the 5-day low, quarter-ATR buffer | −0.08R | 43% | −0.93R |
| 2 ATR below entry | −0.14R | 36% | −1.08R |
| 1.5 ATR below entry | −0.16R | 34% | −1.15R |
| 1 ATR below entry | −0.23R | 31% | −1.21R |
| Just below the breakout level | −0.51R | 32% | −1.60R |
The structural stop did best, as this lesson's placement section suggests. Placing the stop where the trade idea was wrong, below a real swing low, gave the highest win rate and the smallest average loss. Note that its average loss was below 1R, because some trades closed at a smaller loss on the 40-day time exit.
Tight stops paid twice. A stop just below the breakout level was hit by normal retests, and when the stock gapped, the small R meant the gap was many times the planned risk: the average loss was −1.60R. This is the warning in this lesson's callout, measured: a stop placed for rupee comfort, not by the chart, makes losses both more frequent and larger.
ATR stops were in between, and wider was better. Two ATR below entry beat one ATR. ATR stops are useful when there is no clear structure, but on these breakouts a swing low gave a more meaningful location.
Gaps are a cost of every stop. One stop-out in six was filled by a gap below the stop, adding about a quarter of an R on average. Plan position size assuming some losses will be 1.5R or worse, as in the Axis Bank chart above.
Common Mistakes
- Stops at obvious round numbers or exactly on the swing. Leave a buffer beyond the level the trade depends on.
- Stops too tight for the market's volatility. Compare the distance with ATR.
- Widening the stop during the trade. It raises the risk you agreed to, after the fact.
- Mental stops. Without an order in the market, the decision is left to the moment you are most likely to freeze.
- Sizing first, stopping second. Size the position to the stop, never the reverse.
Advanced Insight
Many professionals separate the invalidation level (where the idea is wrong) from the stop order (how they execute the exit). On a lower timeframe they may wait for a candle *close* beyond invalidation before exiting, which avoids being shaken out by wicks, but they also keep a wider hard stop in the market in case of a sudden move. That approach only works with disciplined execution and position sizes small enough that the hard stop is still affordable.
Risk Considerations
- Gap risk: stops don't protect against opening gaps; size overnight positions accordingly.
- Liquidity: in thinly traded stocks or far out-of-the-money options, a stop-market order can fill at a very poor price.
- Stop hunting: obvious stop clusters (just beyond equal highs or lows) are often run before price reverses; the Smart Money course covers liquidity sweeps.
Important Terminology
| Term | Meaning |
|---|---|
| Stop-loss order | An order that closes a position if price reaches a chosen level. |
| Trigger price | The price that activates the stop order. |
| Stop-market (SL-M) | A stop that becomes a market order when triggered: fills almost always, possibly at a worse price. |
| Stop-limit (SL) | A stop that becomes a limit order when triggered: never fills worse than the limit, but may not fill. |
| Buffer | Extra distance beyond a level to allow for spread and noise. |
| ATR | Average True Range: the typical range of a candle over a set period, used to measure volatility. |
| Slippage | The difference between the price you expected and the price you got. |
| Gap | A jump between one candle's close and the next candle's open with no trading in between. |
Where should I place my stop-loss?
Just beyond the price that would prove your trade idea wrong, usually the swing low for a long or the swing high for a short, plus a small buffer. Then size the position so that a stop at that level costs your chosen amount.
What is a good stop-loss percentage?
There isn't one. A fixed percentage ignores where the market's structure is. Use the chart to set the distance and position size to control the rupee loss.
Should I use SL or SL-M orders?
Stop-market (SL-M) orders prioritise getting out; stop-limit (SL) orders prioritise price and may not fill in a fast move. If you use stop-limit, leave room between the trigger and the limit. Availability depends on your broker and segment.
What is an ATR stop-loss?
A stop placed a multiple of the Average True Range away from entry, commonly 1.5–2 × ATR, so that its distance adapts to how volatile the market is.
Can a stop-loss guarantee my maximum loss?
No. If the market gaps past your stop, you are filled at the first available price, which can be much worse. Keep risk per trade modest when holding overnight or through events.
How often does a stop-loss get gapped?
In our test of 419 breakout trades on 17 large NSE stocks, 16% of stop-outs were filled by an opening gap below the stop, adding an average 0.23R to the loss. Overnight positions should be sized with this in mind.
Are ATR stops better than structural stops?
Not in our NSE test. On the same 419 entries with a 2R target, a structural stop below the 5-day low averaged −0.08R per trade after costs, against −0.14R for 2 ATR and −0.23R for 1 ATR stops.
Practical Exercise
Open any daily chart and find a recent pullback that held above a clear swing low. Plan a long trade at today's price as if you were taking it.
Your task
Step 1: Mark the invalidation level
The swing low the idea depends on.
Step 2: Add a buffer
Place your stop a little beyond it and write down the stop distance.
Step 3: Compare with ATR
Add a 14-period ATR to the chart. Is your stop distance at least about one ATR? If not, is the setup still valid?
Step 4: Size the position
Using 1% of a ₹2,00,000 account (₹2,000), calculate the number of shares.
Step 5: Price a gap
Work out the loss if the stock gapped 3% below your stop. Would you be comfortable with that?
Check Your Understanding
Where does a structure-based stop belong on a long trade?
Related Lessons
Previous: Win Rate, Expectancy and Profit Factor. Next: Trailing Stops and Taking Profit (12.02.02). See also Position Sizing and the 1% Rule and Risk-Reward Ratio.