
Open Interest and Volume in Futures and Options
JustWolves is an educational platform and is not a SEBI-registered investment advisor. Trading financial instruments involves significant risk of loss and may not be suitable for all investors. Past performance is not indicative of future results. Read our full disclaimer →
What you'll learn
- Volume counts contracts traded in a session; open interest (OI) counts contracts still open
- OI rises when new positions are opened and falls when positions are closed
- Four price–OI combinations are commonly read as long build-up, short build-up, short covering and long unwinding
- High call OI above the market and high put OI below it are often watched as reference levels
- OI shows how many contracts are open, not who is buying or selling, so readings are interpretations
In this article · 16 sections
Every derivatives trade has a buyer and a seller, and every contract stays open until someone closes it. Open interest counts those open contracts; volume counts how many traded. Together they help show whether money is flowing into or out of a market, and where positions are concentrated. This lesson explains both, the common ways traders read them, and the important limits of OI analysis.
What You Will Learn
- The difference between volume and open interest
- How OI rises and falls
- The four price–OI combinations
- How traders read OI by strike, and its limits
Before You Start
Read How to Read an Option Chain first. Volume Analysis in the Price Action course covers volume in the cash market.
Volume vs Open Interest
- Volume: the number of contracts traded during a session. It resets every day.
- Open interest (OI): the number of contracts outstanding at a point in time, carried over from day to day until positions are closed or expire.
How OI Changes
| Buyer | Seller | Effect on OI |
|---|---|---|
| Opens a new long | Opens a new short | OI rises by one contract |
| Opens a new long | Closes an existing long | No change (position passes hands) |
| Closes an existing short | Closes an existing long | OI falls by one contract |
So high volume with unchanged OI means positions are changing hands; rising OI means new money is entering; falling OI means positions are being closed.
Four Price–OI Combinations
| Price | OI | Common label | Usual reading |
|---|---|---|---|
| Rising | Rising | Long build-up | New buyers entering |
| Falling | Rising | Short build-up | New sellers entering |
| Rising | Falling | Short covering | Shorts closing, pushing price up |
| Falling | Falling | Long unwinding | Longs closing, pushing price down |
OI by Strike in Options
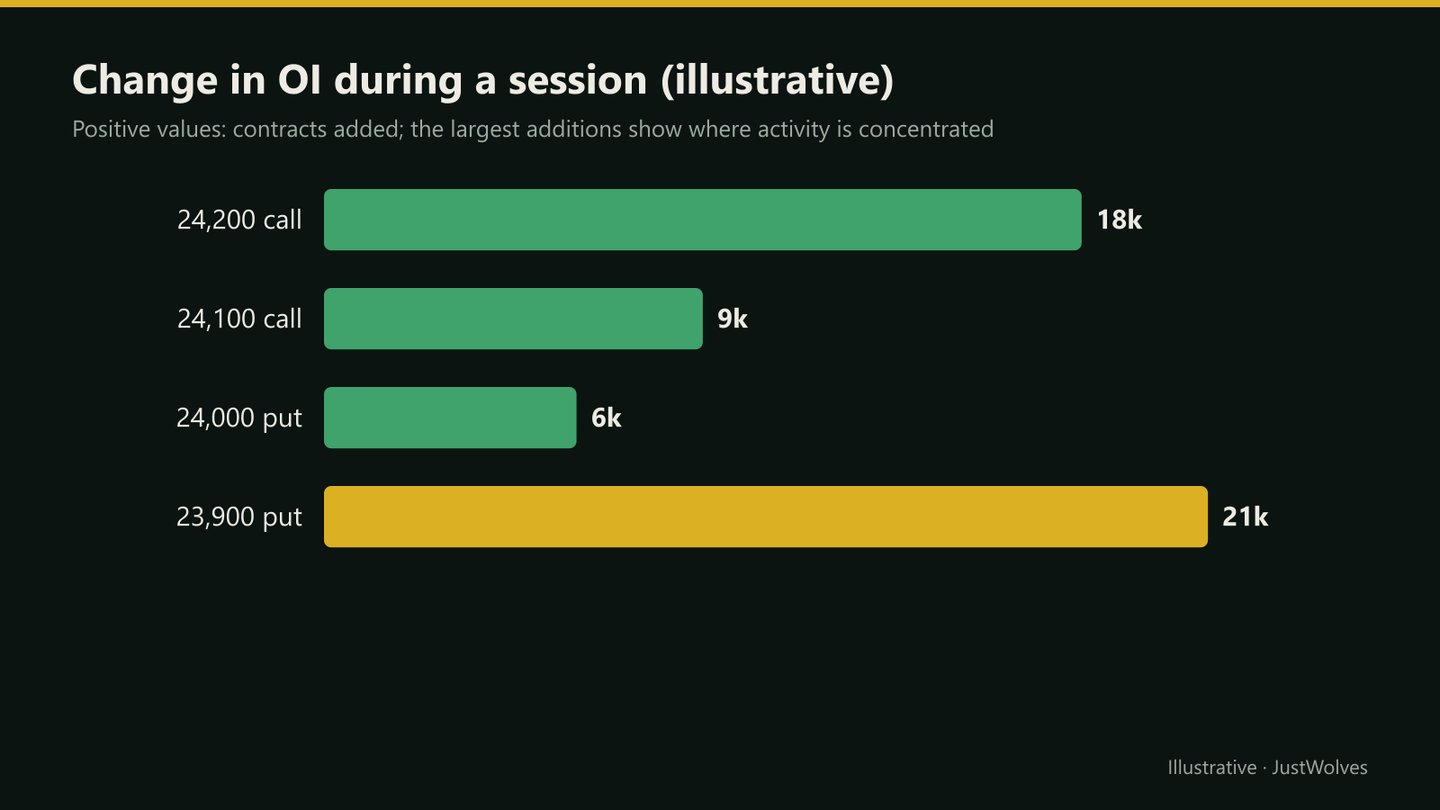
In index options, traders often watch the strike with the highest call OI above the market and the highest put OI below it. The common reading is that option sellers, who often hold large positions, will defend those strikes, so they may act as resistance and support.
This is a widely used heuristic, not a rule. OI at a strike includes both buyers and sellers, hedges and spread legs, and large OI can shift quickly as positions are rolled. Breakouts through high-OI strikes happen regularly.
Volume Alongside OI
Volume tells you how actively a contract is trading today. High volume with little change in OI means positions are mostly changing hands, common during intraday trading. High volume with a large rise in OI means new positions are being built, which usually deserves more attention.
Very low volume at a strike is a liquidity warning. Even if OI is large there, you may struggle to enter or exit at a fair price, and the last traded price may be stale.
Real Data: Price Up on Heavy Volume
Our dataset does not include historical open interest, but it does include daily volume for 20 large NSE stocks. The chart below uses real TCS data from September and October 2026 to show the cash-market version of a "long build-up": price and participation rising together.
Real data: price up on heavy volume, TCS, September–October 2026
Step 1 of 3
A quiet decline
Through late September and early October 2026, TCS drifts between about 2,030 and 2,140 on mostly ordinary volume, 0.4 to 1.7 times its 20-day average.
- What to observe
- No strong conviction either way.
- Condition
- Watch for a change in price and volume together.
OI Around Expiry
Near expiry, OI in the current contract falls as positions are closed or rolled to the next expiry, while OI in the next contract rises. Comparing total OI across both contracts gives a better picture than looking at the expiring contract alone. On expiry day itself, OI readings in the expiring series say little about future direction, so most traders shift their attention to the next contract.
Practical Example
Hypothetically, over three sessions, Nifty futures rise from 23,900 to 24,150 while futures OI rises 8%. Arjun reads this as a long build-up. On the option chain, put OI at 23,900 has grown sharply, while call OI is largest at 24,300.
He treats 23,900 as an area to watch for support and 24,300 as a possible ceiling. When Nifty later breaks above 24,300 on a strong candle and call OI there falls, he reads it as call writers covering, and stops treating 24,300 as resistance.
Do Price–Participation Labels Predict? A Volume Test
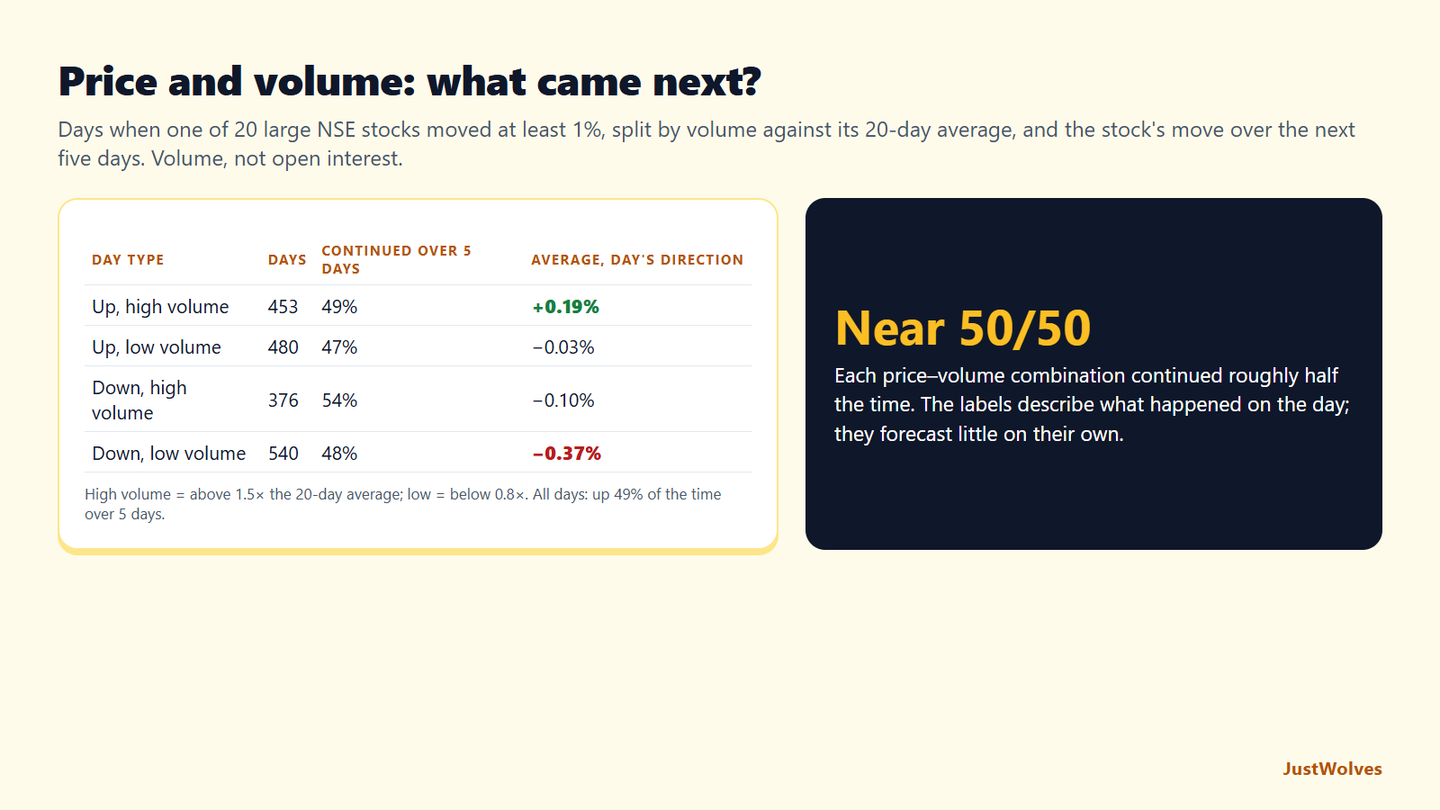
The four price–OI combinations in this lesson are labels for what happened, and the callout warns that the data alone cannot confirm them. JustWolves tested the closest version we can measure with real data: the four price–volume combinations on 20 large NSE stocks over about two years (November 2024 to November 2026). Days: a move of at least 1%, with volume either above 1.5 times or below 0.8 times its 20-day average. Outcome: whether the stock moved further in the same direction over the next five trading days. This is volume, not open interest, so treat it as an analogy, not a test of OI itself.
| Day type | Days | Continued in the same direction | Average next-5-day move in the day's direction |
|---|---|---|---|
| Price up, volume high | 453 | 49% | +0.19% |
| Price up, volume low | 480 | 47% | −0.03% |
| Price down, volume high | 376 | 54% | −0.10% |
| Price down, volume low | 540 | 48% | −0.37% |
| All days | 49% higher | +0.10% average |
Each combination continued roughly half the time, close to the 49% for all days. Two small leanings appeared: strong days on high volume did slightly better than the average day, and falls on low volume tended to be partly recovered over the next week (−0.37% in the fall's direction means an average rebound). Neither is large enough to trade on its own.
That supports this lesson's caution about OI labels. "Long build-up" or "short covering" are reasonable descriptions of a session, but descriptions are not forecasts. The professional insight in this lesson is the useful way to read them: as confirmation or doubt about what price is already doing, combined with structure and risk management, rather than as signals in their own right.
Common Mistakes
- Treating OI labels as certain.
- Assuming the highest-OI strike can't be broken.
- Ignoring rollovers near expiry, which shift OI between contracts.
- Reading options OI exactly like futures OI.
- Using intraday OI snapshots without allowing for update delays.
Professional Insight
Experienced F&O traders tend to use OI to confirm or question what price is already showing. Rising price with rising futures OI supports a trend; rising price with falling OI suggests a move driven by covering that may fade. Price comes first; OI adds context.
Risk Considerations
- OI data can be misread without knowing who holds the positions.
- Large OI shifts happen around expiry and rollover.
- Heuristics fail in strong trending moves.
Important Terminology
| Term | Meaning |
|---|---|
| Open interest | Contracts currently open. |
| Volume | Contracts traded in a session. |
| Long build-up | Rising price with rising OI. |
| Short covering | Rising price with falling OI. |
| Rollover | Moving positions from one expiry to the next. |
What is open interest?
The number of derivative contracts currently open, which haven't been closed or expired.
What is the difference between volume and open interest?
Volume counts contracts traded during a session; open interest counts contracts still outstanding.
What does rising open interest mean?
New positions are being opened. Combined with price direction, traders interpret it as long or short build-up.
Does high call OI mean resistance?
It's often watched as a possible resistance level, but it's a heuristic and is frequently broken.
What is short covering?
Short positions being closed, often pushing price up while OI falls.
Why does open interest fall near expiry?
Because traders close positions or roll them to the next expiry before the current contract settles. Open interest in the expiring contract falls while it rises in the next one, so compare total open interest across both contracts around expiry rather than reading the fall as traders leaving the market.
Can I use open interest for stock options too?
Yes, the same definitions apply, but stock options are usually far less liquid than NIFTY options, so open interest at a strike can be small and change sharply with a few trades. Treat stock-option OI readings with extra caution.
Does rising price with rising volume mean the trend will continue?
Not reliably on its own. In our test of 20 large NSE stocks, days up at least 1% on high volume were followed by further gains over the next five days 49% of the time, about the same as an average day.
Practical Exercise
Label five sessions.
Your task
Step 1: Record daily
Nifty futures price change and OI change for five sessions.
Step 2: Label each
Long build-up, short build-up, short covering or long unwinding.
Step 3: Check the next day
Did price continue in the direction your label suggested?
Check Your Understanding
Open interest counts:
Related Lessons
Previous: How to Read an Option Chain. Next: Put-Call Ratio. See also Volume Analysis.