
How to Read an Option Chain
JustWolves is an educational platform and is not a SEBI-registered investment advisor. Trading financial instruments involves significant risk of loss and may not be suitable for all investors. Past performance is not indicative of future results. Read our full disclaimer →
What you'll learn
- An option chain lists every call and put for one underlying and expiry, organised by strike
- Calls are on the left, puts on the right, strikes in the middle; ITM strikes are usually shaded
- Key columns: last traded price (LTP), implied volatility (IV), open interest (OI), change in OI, volume and bid-ask
- Liquidity is concentrated near the ATM strike and in near expiries
- Read the chain for context: where interest is building and what the market is paying for options
In this article · 15 sections
The option chain is the main screen for options traders. It shows every available strike for an underlying and expiry, with prices, volatility and activity for both calls and puts. At first it looks like a wall of numbers, but each column answers a specific question. This lesson walks through the NSE option chain layout and a simple routine for reading it.
What You Will Learn
- How an option chain is laid out
- What each column means
- How to judge liquidity
- A step-by-step reading routine
Before You Start
The Layout
- Selection: choose the underlying (for example, NIFTY) and the expiry date at the top.
- Centre: the strike prices, in order.
- Left side: call option data for each strike.
- Right side: put option data for each strike.
- Shading: most platforms shade ITM options: calls below the current price, puts above it.
NSE publishes the chain on its website, and brokers show the same data in their own layouts, often with Greeks added.
The Columns
| Column | Meaning | Use |
|---|---|---|
| LTP | Last traded price of the option | Current premium |
| Change | Change in LTP from the previous close | How the option moved today |
| IV | Implied volatility at that strike | Whether options are pricing large or small moves |
| OI | Open interest: contracts currently open | Where positions are concentrated |
| Change in OI | Change in open interest today | Where new positions are being added or closed |
| Volume | Contracts traded today | Today's activity and liquidity |
| Bid / Ask (and quantities) | Best buy and sell prices waiting | The cost of trading immediately |
Judging Liquidity
Liquidity is usually highest at and near the ATM strike, at round-number strikes, and in the nearest expiries. Far OTM strikes and distant expiries often have thin volume and wide bid-ask spreads.
The bid-ask spread is a direct cost. If an option's bid is ₹101.50 and ask is ₹102.00, buying at the ask and immediately selling at the bid loses ₹0.50 per unit, ₹32.50 per Nifty lot, before brokerage and taxes.
Real Data: How Far the Price Travels Across the Chain
An option chain is read at one moment, but the price moves across it. The chart below uses real NIFTY 50 prices from June and July 2026, with three strikes marked, to show how quickly the at-the-money row and the moneyness of every strike can change.
Real data: how far NIFTY travels across the option chain in a few weeks, June–July 2026
Step 1 of 3
A range around 24,000
In late June 2026 NIFTY trades between about 23,785 and 24,260. On the option chain, the at-the-money strike moves between 23,800 and 24,250 from day to day.
- What to observe
- Even a quiet fortnight spans about ten 50-point strikes.
- Condition
- The relevant part of the chain moves with the price.
A Reading Routine
Five checks
Step 1: Price and expiry
Note the underlying's price and days to expiry.
Step 2: ATM strike
Find it and check its call and put premiums and IV.
Step 3: Where OI sits
Note the strikes with the highest call and put OI.
Step 4: What's changing
Check change in OI and volume to see where activity is today.
Step 5: Liquidity
Check bid-ask spreads at the strikes you might trade.
Comparing Calls and Puts at a Strike
Reading across a row compares the call and put at the same strike. At the ATM strike, their premiums are usually similar; the call is typically a little more expensive because of interest-rate effects (put-call parity). A large gap, or very different IVs between the two, can point to strong demand on one side, for example heavy put buying for protection.
Reading down a column shows how IV changes across strikes. In index options, OTM puts often carry higher IV than OTM calls at the same distance from the price, because investors pay more for downside protection. This pattern is called the volatility skew. Knowing it exists helps explain why a far OTM put can cost more than a call the same distance away.
Practical Example
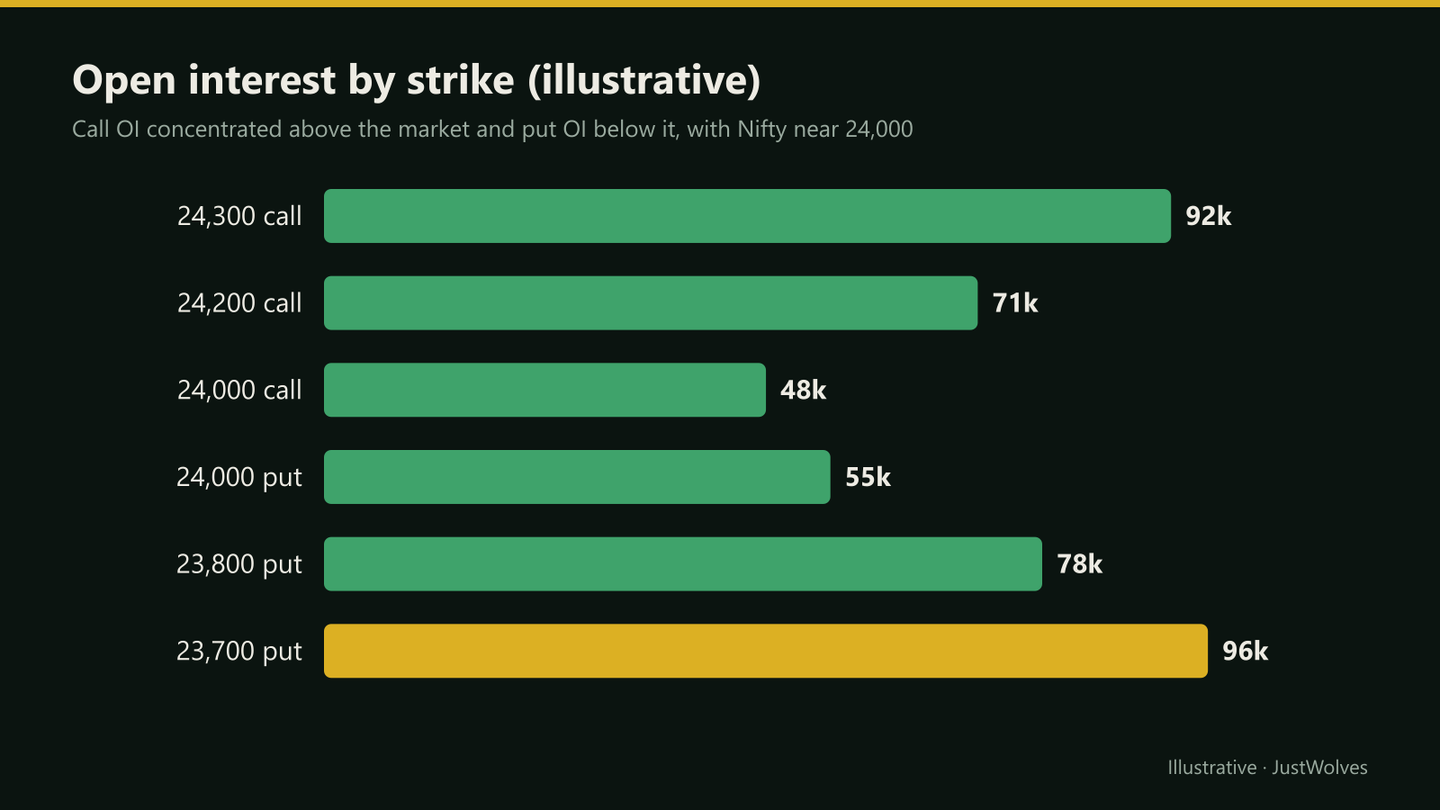
Hypothetically, Nifty is at 23,980 with five days to expiry. The ATM 24,000 call trades at ₹128 and the put at ₹142, both near 12% IV. Call OI is highest at 24,300; put OI is highest at 23,700. Today, change in OI shows new put positions at 23,800.
Vinod notes that the market's largest open positions bracket 23,700–24,300, and that the 24,000 strike has a bid-ask spread of ₹0.50. He uses this as context for his plan, not as a signal: his entry decision still depends on the price chart and his risk rules.
How Much of the Chain Does a Week Use? Our Data
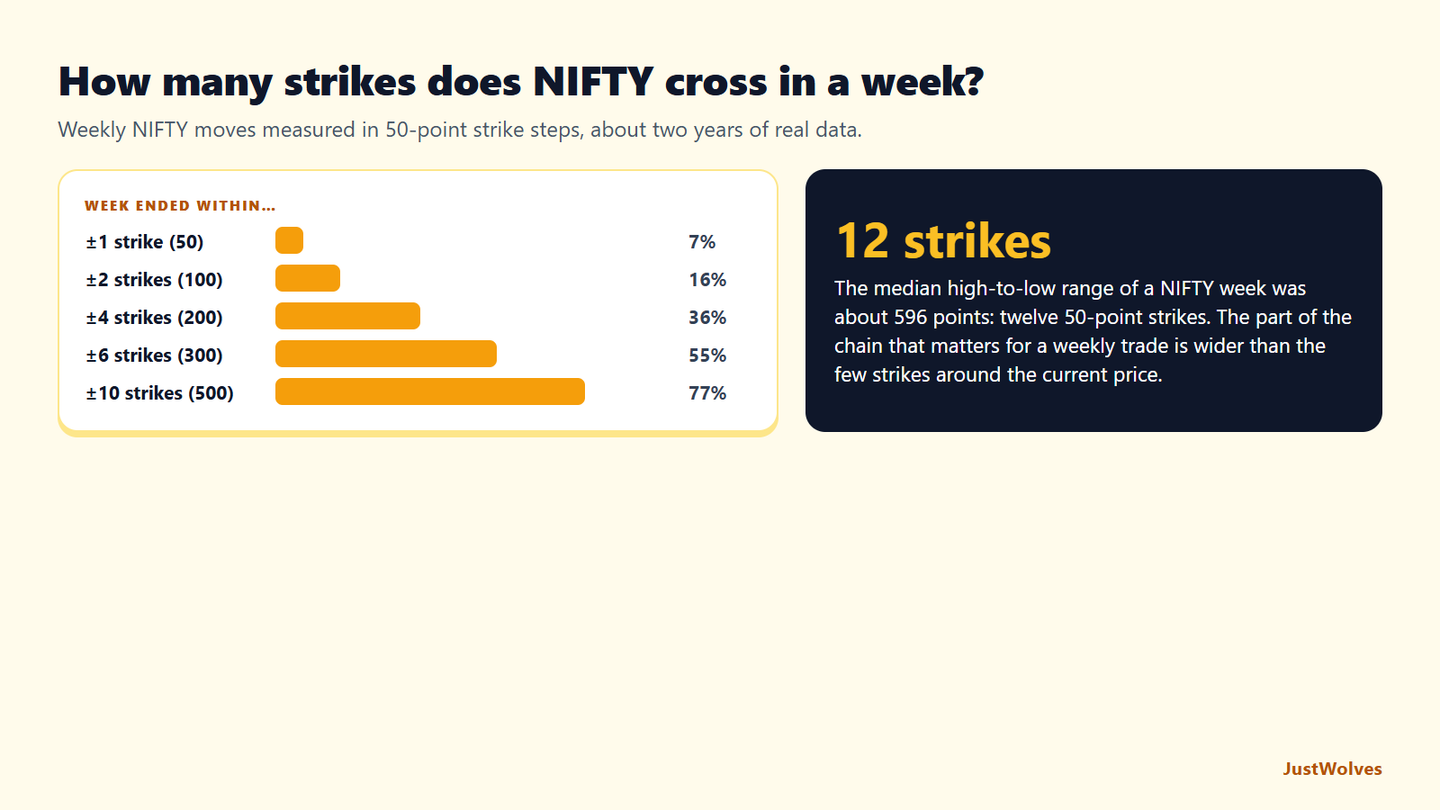
JustWolves measured about two years of real NIFTY 50 data (November 2024 to November 2026) in units that match the option chain: 50-point strike steps. For each week we recorded how far the close moved from the previous week's close, and how wide the week's high-to-low range was.
| The week's close moved… | Share of weeks |
|---|---|
| within 1 strike (50 points) | 7% |
| within 2 strikes (100 points) | 16% |
| within 4 strikes (200 points) | 36% |
| within 6 strikes (300 points) | 55% |
| within 10 strikes (500 points) | 77% |
| Median high-to-low range during the week | about 596 points (12 strikes) |
Two practical points follow for this lesson's reading routine. First, the at-the-money strike today is rarely the at-the-money strike at expiry: only about one week in six ended within two strikes of where it started. When you read premiums, IV and OI on the chain, look at the strikes across the range the market typically covers, roughly four to six strikes either side for a weekly expiry, not just the row nearest the price.
Second, liquidity matters across that range, not just at the money. If your plan might involve exiting a position that has moved several strikes away from the current price, check the bid-ask spread and volume at those strikes too. This lesson's example of a ₹0.50 spread at the money can be several rupees at strikes a few hundred points away, especially late in the week.
Common Mistakes
- Treating high OI strikes as guaranteed support or resistance.
- Ignoring bid-ask spreads on illiquid strikes.
- Reading the wrong expiry.
- Using LTP for an option that hasn't traded recently, which may be stale.
- Overloading on data without a plan.
Professional Insight
Experienced traders use the chain mostly for two things: pricing (is IV high or low, and where are the liquid strikes?) and positioning (where has open interest built up?). The trade decision usually comes from elsewhere.
Risk Considerations
- Stale prices on illiquid strikes.
- Wide spreads add hidden costs.
- Over-interpreting OI leads to false confidence.
Important Terminology
| Term | Meaning |
|---|---|
| Option chain | A table of all options for one underlying and expiry. |
| LTP | Last traded price. |
| Open interest | The number of contracts currently open. |
| Volume | The number of contracts traded in the session. |
| Bid-ask spread | The gap between the best buy and sell prices. |
What is an option chain?
A table listing all calls and puts for an underlying and expiry, with prices, IV, open interest and volume for each strike.
Where can I see the Nifty option chain?
On NSE's website and on most brokers' trading platforms.
What does change in OI mean?
How many contracts were added (positive) or closed (negative) at a strike during the day.
Which strike is most liquid?
Usually the ATM strike and nearby round-number strikes in the nearest expiries.
Can the option chain predict the market?
No. It shows positioning and pricing, which can provide context but not reliable predictions.
Which expiry should I look at on the option chain?
The one that matches how long your trade idea needs. The nearest weekly expiry is the most liquid but decays fastest; a later expiry costs more but gives the move more time. Check that the strikes you need are liquid in the expiry you choose.
Why do strikes far from the price show stale prices?
Because they trade rarely. The last traded price may be from hours earlier, when the index was somewhere else. Use the current bid and ask, not the last price, to judge what you could actually trade at.
How do I spot an illiquid strike?
Look for a wide gap between bid and ask, low volume for the day and little open interest. Any one of these means entering and exiting may cost more than the chain's last price suggests.
How many strikes does NIFTY move in a week?
In our two years of real data, the median weekly high-to-low range was about 596 points, about twelve 50-point strikes, and the week's close moved more than 300 points (six strikes) from the previous close in about 45% of weeks.
Practical Exercise
Read a live chain.
Your task
Step 1: Open the Nifty chain
Nearest expiry, during market hours.
Step 2: Apply the routine
Price, ATM, OI, change in OI, liquidity.
Step 3: Note spreads
At the ATM strike and at a far OTM strike.
Step 4: Repeat at the close
What changed?
Check Your Understanding
On a typical option chain, puts are shown:
Related Lessons
Previous module: How to Read an Option Payoff Diagram. Next: Open Interest and Volume.