
Option Pricing Basics: What Determines an Option's Price
JustWolves is an educational platform and is not a SEBI-registered investment advisor. Trading financial instruments involves significant risk of loss and may not be suitable for all investors. Past performance is not indicative of future results. Read our full disclaimer →
What you'll learn
- Option prices depend on underlying price, strike, time to expiry, volatility, interest rates and dividends
- Option-pricing models turn these inputs into a theoretical price
- Every input except volatility is known; the market's volatility estimate is called implied volatility
- Put-call parity links call and put prices with the same strike and expiry
- Models rest on assumptions that real markets don't fully meet
In this article · 15 sections
Why does one option cost ₹418 and another ₹275? Option prices aren't arbitrary: they follow from a handful of inputs, and pricing models combine those inputs into a theoretical value. You don't need to do the maths to trade options, but understanding what moves prices explains almost everything that surprises new options traders. This lesson covers the inputs, the best-known model and the relationship between calls and puts.
What You Will Learn
- The six inputs to an option's price
- How each input affects calls and puts
- What a standard option-pricing model does
- Put-call parity
Before You Start
Read Option Premium: Intrinsic and Extrinsic Value first.
The Six Inputs
| Input | Call price | Put price |
|---|---|---|
| Underlying price | Rises | Falls |
| Strike price | Falls | Rises |
| Time to expiry | Usually rises | Usually rises |
| Volatility | Rises | Rises |
| Interest rate | Rises slightly | Falls slightly |
| Expected dividends | Fall slightly | Rise slightly |
Five of these are known when you trade: the price, the strike, the time left, interest rates and expected dividends. The sixth, volatility over the option's life, isn't. That's why volatility is the input traders debate most.
The Standard Pricing Model
The standard option-pricing model, published in 1973, gives a theoretical price for European options from those inputs. Variations of it are used by exchanges, brokers and trading platforms to calculate the Greeks and implied volatility shown on option chains.
It rests on simplifying assumptions: that volatility is constant, that prices move continuously without jumps, and that trading is frictionless. Real markets break all three, especially around events and on expiry days, so model prices are a reference point, not a fair-value guarantee.
Implied Volatility
Since all other inputs are known, you can run the model backwards: take the option's market price and solve for the volatility that produces it. That number is the implied volatility (IV), the market's collective estimate of future volatility. When premiums rise without a price move, IV has risen. The next lesson covers IV in detail.
Real Prices: When Volatility Spikes, Premiums Follow
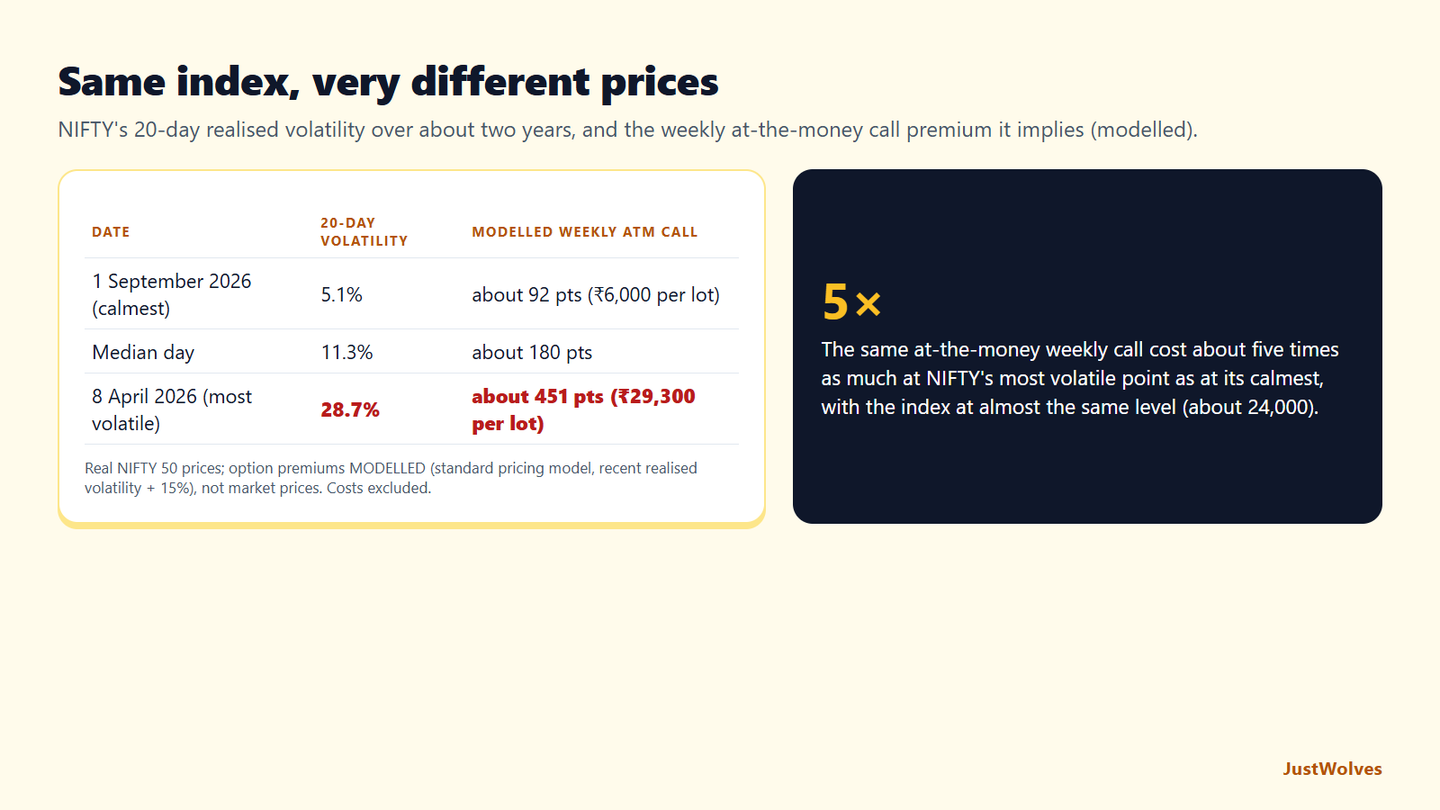
The chart below uses real NIFTY 50 prices from March and April 2026, the most volatile stretch in our two years of data. With the index at almost the same level, the modelled price of a one-week at-the-money call was about five times higher at the peak of volatility than in the calm of September 2026.
Real NIFTY prices: when volatility spikes, premiums follow, March–April 2026
Step 1 of 3
Large daily swings
In late March and early April 2026, NIFTY swings by 300 to 500 points a day: up 394 on 25 March, down 488 on 30 March, up 348 on 1 April.
- What to observe
- Big moves in both directions.
- Condition
- Realised volatility is rising.
Put-Call Parity
For European options with the same strike and expiry, call and put prices are linked: call − put = underlying − present value of the strike (adjusted for dividends). If the relationship breaks, arbitrageurs can profit by trading the options against the underlying or futures, which pushes prices back in line.
One practical consequence: at the same strike, calls and puts share the same implied volatility in theory. In practice, small differences appear because of costs and supply and demand.
Why Time Usually Adds Value
More time gives the underlying more opportunity to move, so longer-dated options generally cost more. The increase isn't proportional: under standard models, an option's time value grows roughly with the square root of time. A 30-day ATM option is worth roughly twice, not four times, a 7-day one.
That relationship explains two things traders observe. Short-dated options are cheap in absolute terms but lose value quickly each day. Longer-dated options cost more but decay more slowly at first, giving a trade idea more room to develop. Choosing an expiry is therefore partly a choice about how fast you want to pay for time.
Practical Example
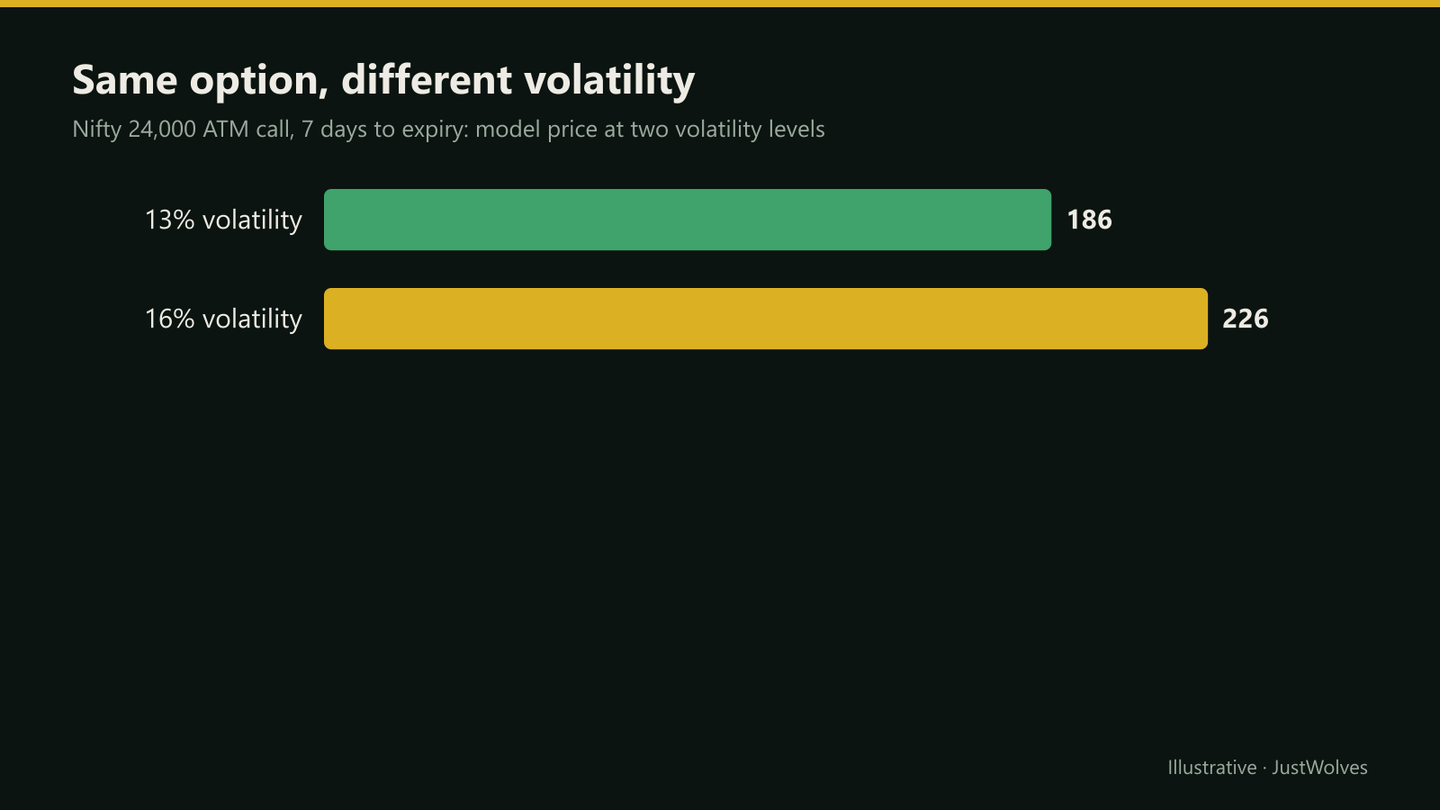
Hypothetically, Nifty is at 24,000 and a 7-day ATM call trades at about ₹186, consistent with 13% IV. Ahead of a major policy announcement, demand for options rises and IV climbs to 16%. With Nifty unchanged, the call's model price rises to about ₹226.
After the announcement, Nifty moves only 50 points and IV drops back to 13%. The call falls back toward the ₹186 area, less any time decay, even though Nifty moved in the right direction. Traders call this a volatility crush.
How Much Does Volatility Change Prices? Our Data
Volatility is the one pricing input traders cannot look up. JustWolves measured NIFTY 50's 20-day realised volatility on every day of about two years of real data (November 2024 to November 2026) and, using a standard option-pricing model, the one-week at-the-money call premium that volatility would imply (with volatility set 15% above realised, as option prices usually are).
| Point in the period | 20-day realised volatility | Modelled weekly ATM call | Per lot (65 units) |
|---|---|---|---|
| Calmest: 1 September 2026 (NIFTY 24,056) | 5.1% | about 92 points | about ₹6,000 |
| Median day | 11.3% | about 180 points | about ₹11,700 |
| Most volatile: 8 April 2026 (NIFTY 23,997) | 28.7% | about 451 points | about ₹29,300 |
On two dates with NIFTY at almost exactly the same level, the same one-week at-the-money call would have cost about five times as much at the volatility peak as in the calm. Nothing else in this lesson's input table changed nearly as much: price, strike and time were the same, and interest rates barely move week to week. That is why traders watch volatility so closely, and why this lesson's professional insight says options traders often trade volatility rather than direction.
We also checked how persistent volatility was. The correlation between one month's realised volatility and the next month's was 0.47: high-volatility periods tended to be followed by fairly high volatility, but far from reliably. A trader who buys options because volatility has been low, expecting it to stay low, is making a forecast that was right only part of the time. The next lesson compares this realised volatility with the implied volatility that real option prices contain.
Common Mistakes
- Assuming option prices only depend on direction.
- Ignoring IV before buying around events.
- Treating model prices as exact fair values.
- Forgetting time is an input that changes every day.
- Comparing premiums across expiries without accounting for time.
Professional Insight
Professional options traders often say they trade volatility, not direction. They compare implied volatility with what they expect actual volatility to be, and buy options when they think IV is too low, sell when they think it's too high.
Risk Considerations
- Volatility can change sharply around events.
- Model assumptions fail in gaps and crashes.
- Thinly traded options may have prices far from model values.
Important Terminology
| Term | Meaning |
|---|---|
| Option-pricing model | A formula that turns price, strike, time, volatility and rates into a theoretical value for European options. |
| Implied volatility | The volatility implied by an option's market price. |
| Put-call parity | The pricing relationship between calls and puts. |
| Volatility crush | A sharp fall in IV after an event. |
| Theoretical price | A model's estimate of an option's value. |
How are option prices calculated?
Using option-pricing models that combine underlying price, strike, time, volatility, interest rates and dividends.
Why did my option lose value when the market moved my way?
Often because implied volatility fell or time decay outweighed the price move.
What is put-call parity?
A relationship linking call and put prices with the same strike and expiry to the underlying price and the strike's present value.
Are option-pricing models accurate?
It's a widely used reference, but its assumptions don't hold perfectly, especially around jumps and events.
Which input matters most day to day?
For short-dated options, the underlying price, time decay and implied volatility usually dominate.
Why do option prices rise before big events?
Because traders expect larger moves, demand for options rises and implied volatility goes up, which raises premiums even if the underlying has not moved. After the event, implied volatility usually falls back and premiums drop, which is called a volatility crush.
Is a model price the same as the market price?
No. A model gives a theoretical value from its inputs; the market price is what traders actually pay. The difference is usually expressed as implied volatility. Thinly traded strikes can trade far from model values, so always check the bid and ask before trading.
How much does volatility affect an option's price?
A great deal. In our two years of NIFTY data, 20-day realised volatility ranged from 5.1% to 28.7%, and the modelled one-week at-the-money call premium ranged from about 92 to about 451 points with NIFTY near 24,000 both times.
Practical Exercise
Watch volatility.
Your task
Step 1: Pick an event
Such as an RBI policy announcement or a company's results.
Step 2: Record IV
Of the ATM option the day before and the day after.
Step 3: Record premiums
And the underlying's move.
Step 4: Explain
How much of the premium change came from price, time and IV?
Check Your Understanding
Higher volatility makes calls and puts:
Related Lessons
Previous: Option Premium: Intrinsic and Extrinsic Value. Next: Implied Volatility vs Historical Volatility.