
How to Read an Option Payoff Diagram
JustWolves is an educational platform and is not a SEBI-registered investment advisor. Trading financial instruments involves significant risk of loss and may not be suitable for all investors. Past performance is not indicative of future results. Read our full disclaimer →
What you'll learn
- A payoff diagram shows profit or loss (vertical axis) against the underlying's price at expiry (horizontal axis)
- There are four basic payoffs: long call, long put, short call and short put
- The kink in each line is at the strike; breakeven is where the line crosses zero
- Short options mirror long options: the buyer's gain is the seller's loss
- Before expiry, the P&L curve is smoother because the option still has time value
In this article · 17 sections
Option strategies are much easier to understand as pictures than as numbers. A payoff diagram shows, at a glance, where a position makes money, where it loses, how much it can lose, and where it breaks even. This lesson shows how to read the four basic payoffs and how to build more complex strategies from them.
What You Will Learn
- How a payoff diagram is laid out
- The four basic option payoffs
- How to find breakeven, maximum profit and maximum loss
- Expiry payoffs vs P&L before expiry
Before You Start
The Layout
- Horizontal axis: the underlying's price at expiry.
- Vertical axis: profit or loss, per unit or per lot.
- Zero line: the boundary between profit and loss.
- Kinks: where the slope changes, always at a strike price.
The Four Basic Payoffs
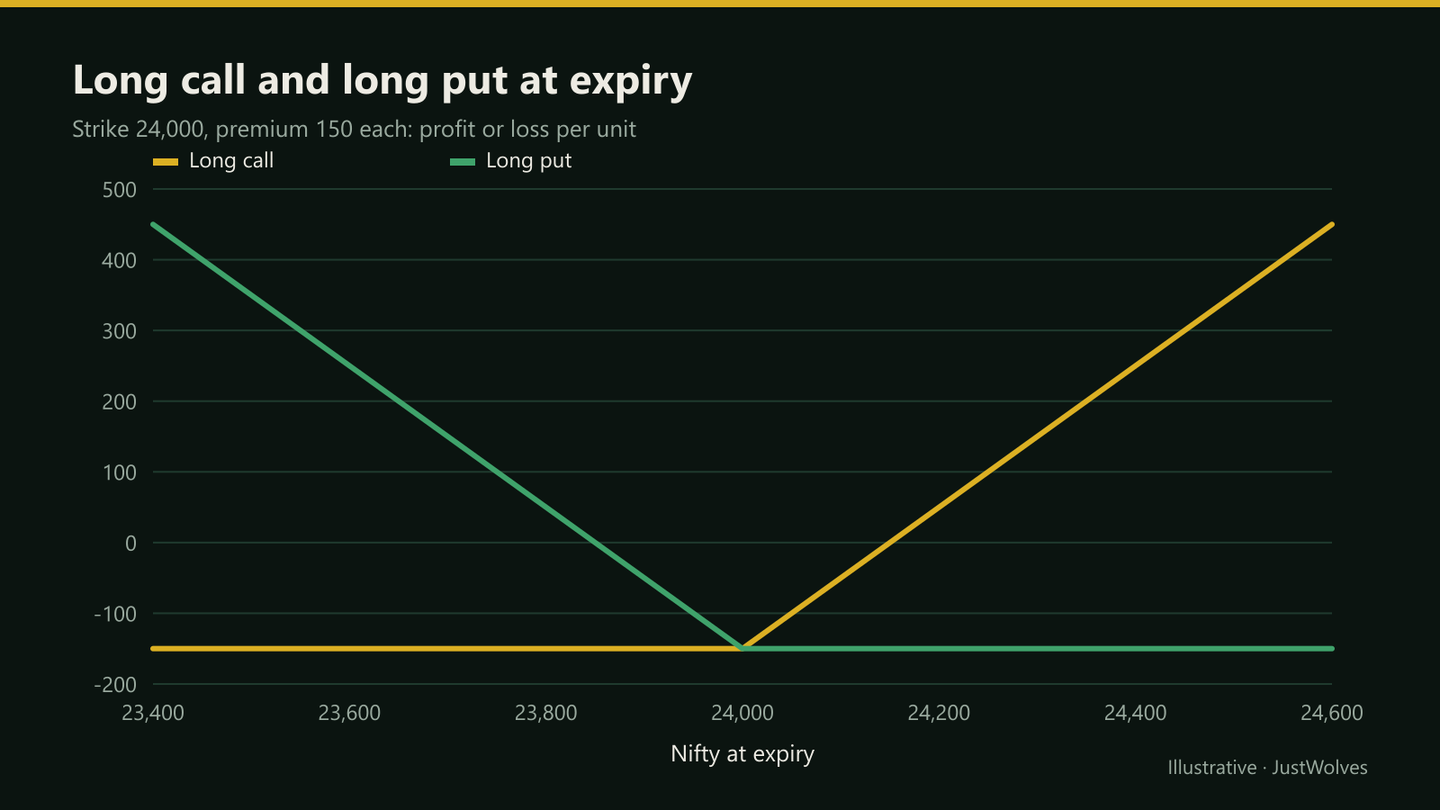
| Position | Shape | Breakeven | Max profit | Max loss |
|---|---|---|---|---|
| Long call | Flat, then rising | 24,150 | Unlimited | 150 |
| Long put | Falling, then flat | 23,850 | 23,850 (if index went to zero) | 150 |
| Short call | Flat, then falling | 24,150 | 150 | Unlimited |
| Short put | Rising, then flat | 23,850 | 150 | 23,850 |
Reading Any Payoff
Four questions
Step 1: Where are the kinks?
At the strikes involved.
Step 2: Where does it cross zero?
Those are the breakevens.
Step 3: What happens at the far left and right?
Flat lines mean capped profit or loss; sloping lines mean open-ended.
Step 4: Where is the highest and lowest point?
Maximum profit and maximum loss.
Combining Payoffs
Strategies are built by adding payoffs. Buying a 24,000 call and selling a 24,300 call creates a bull call spread: the bought call's rising line is capped where the sold call starts falling, giving limited loss and limited profit.
Buying both a call and a put at the same strike creates a long straddle, a V-shape that profits from a large move in either direction. These strategies are covered in Module 06.04.
Before Expiry
Expiry payoffs have sharp kinks because options are worth only their intrinsic value at expiry. Before expiry, options still have time value, so the P&L curve is smooth and sits above the expiry line for long options (and below it for short ones). As expiry approaches, the curve gradually converges to the expiry payoff. Most broker platforms show both lines.
Short Options on the Diagram
Flip the long call upside down and you have the short call: a flat line at +150 (the premium kept) up to the strike, then a line falling without limit. Flip the long put and you have the short put: flat at +150 above the strike, falling below it to a large maximum loss if the index collapsed.
This symmetry is worth remembering. Every rupee a buyer can make is a rupee the seller can lose, and the seller's small, capped profit is the price they accept for taking that risk. Option selling strategies are covered in their own course.
Payoffs Per Lot
Payoff diagrams are often drawn per unit to keep numbers small. To see the rupee impact of a real position, multiply by the lot size and the number of lots. A per-unit loss of 150 on a Nifty option is ₹9,750 per lot of 65; on five lots, ₹48,750. Many broker strategy builders show values per lot or for the whole position, which is usually more useful for risk planning.
Real Prices on a Payoff Diagram: A Protective Put
The chart below uses real NIFTY 50 prices from September 2026 to place Sunita's protective put from this lesson on a real week. The premium is modelled from the volatility at the time; the index moves are real.
Real NIFTY prices on a payoff diagram: a protective put, September 2026
Step 1 of 3
Buying protection
On 21 September 2026 NIFTY closes at 23,414. Like Sunita in this lesson's example, an investor buys one lot of the one-week 23,400 put to protect a portfolio. With recent volatility low, near 8%, the put is modelled at about 89 points (₹5,800 per lot).
- What to observe
- On the payoff diagram: a flat loss of 89 above 23,400.
- Condition
- Premium modelled, not traded.
Practical Example
Hypothetically, Sunita buys one lot of the 24,000 put at ₹150 to protect a portfolio. Her payoff diagram shows a maximum loss of 150 × 65 = ₹9,750 if Nifty is above 24,000 at expiry, breakeven at 23,850, and a gain of ₹65 for every point Nifty falls below that.
At 23,500, the put is worth 500, a gain of (500 − 150) × 65 = ₹22,750, which offsets part of her portfolio's loss.
Where Do Real Weeks Land on the Payoff? Our Data
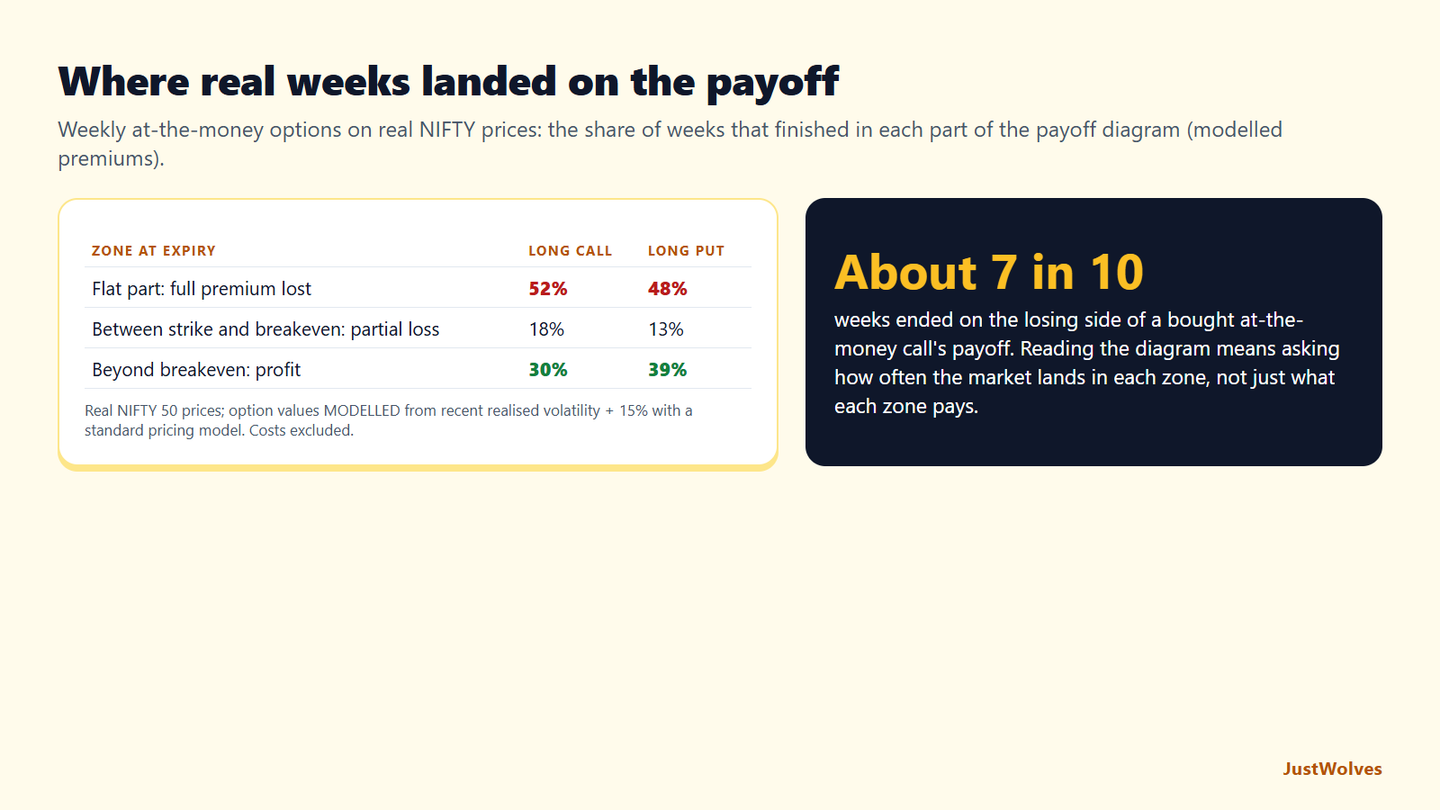
A payoff diagram shows what each outcome pays; it does not show how often each outcome happens. JustWolves combined the two for the simplest payoffs: weekly at-the-money NIFTY calls and puts, bought at a close and held for five trading days, on about two years of real prices (November 2024 to November 2026), with premiums modelled from recent volatility.
| Zone at expiry | Long ATM call | Long ATM put |
|---|---|---|
| Flat part: whole premium lost | 52% | 48% |
| Between strike and breakeven: partial loss | 18% | 13% |
| Beyond breakeven: profit | 30% | 39% |
This adds the missing piece to this lesson's reading routine. For a bought at-the-money call, about seven weeks in ten ended on the losing side of the diagram: half in the flat part, where the whole premium is lost, and nearly a fifth in the sloping part below breakeven, where the option is worth something but less than it cost. Profit came in about three weeks in ten.
Read the other way, the short call's diagram, a capped gain and an open-ended loss, paid its full premium in about half of weeks. That is the trade-off this lesson's section on short options describes: frequent small gains, occasional large losses. A payoff diagram is the right picture of a position, but it should be read together with how often the market reaches each zone, which is exactly what Option Selling Strategies and the risk lessons go on to measure.
Common Mistakes
- Confusing expiry payoffs with P&L today.
- Ignoring the lot size when reading per-unit charts.
- Missing open-ended slopes on short options.
- Building multi-leg trades without checking the combined payoff.
- Forgetting costs, which shift breakevens slightly.
Professional Insight
Professional traders often start with the payoff shape they want, such as 'profit if Nifty stays between two levels', then work backwards to the strikes and options that create it. The diagram comes first; the trade follows.
Risk Considerations
- Open-ended slopes mean unlimited risk.
- Pre-expiry P&L can differ a lot from the expiry payoff.
- Early exits depend on liquidity in each leg.
Important Terminology
| Term | Meaning |
|---|---|
| Payoff diagram | A chart of P&L against the underlying's price at expiry. |
| Breakeven | The price where P&L is zero. |
| Kink | A change in slope, at a strike. |
| Long | Bought. |
| Short | Sold. |
What is an option payoff diagram?
A chart showing a position's profit or loss at expiry across a range of underlying prices.
How do I find breakeven on a payoff diagram?
It's where the payoff line crosses the zero line.
Why are short options riskier?
Their payoff slopes downward without limit on one side (for calls) or to a very large amount (for puts).
Why does my P&L differ from the payoff diagram?
Before expiry, options still have time value, so current P&L follows a smoother curve than the expiry payoff.
Can I build my own payoff diagram?
Yes. Most brokers' strategy builders draw it for any combination of options.
What is the difference between maximum loss and likely loss?
Maximum loss is the worst outcome on the diagram, such as the whole premium for a bought option. Likely loss depends on how often the market reaches each zone. In our NIFTY data, a weekly at-the-money call lost its whole premium about half the time, so the maximum loss was also a common outcome.
How do costs change a payoff diagram?
Brokerage, taxes and the bid-ask spread shift the whole line down for a buyer and move the breakeven slightly further away. For short-dated options with small premiums, costs can be a noticeable share of the premium, so include them when you calculate breakeven.
How often does a bought option finish in its profit zone?
In our test of weekly at-the-money NIFTY options on two years of real prices with modelled premiums, calls finished beyond breakeven 30% of the time and puts 39%. About half finished in the flat part of the diagram, losing the whole premium.
Practical Exercise
Draw four payoffs.
Your task
Step 1: Pick a strike
The ATM Nifty strike and its call and put premiums.
Step 2: Draw by hand
Long call, long put, short call, short put.
Step 3: Mark
Breakeven, maximum profit and maximum loss on each.
Step 4: Check
Compare with your broker's strategy builder.
Check Your Understanding
The horizontal axis of a payoff diagram shows:
Related Lessons
Previous: Option Greeks: Theta, Vega and Rho. Next module: How to Read an Option Chain. Later: Bull Call Spread.