
Position Greeks for Option Sellers
JustWolves is an educational platform and is not a SEBI-registered investment advisor. Trading financial instruments involves significant risk of loss and may not be suitable for all investors. Past performance is not indicative of future results. Read our full disclaimer →
What you'll learn
- Position Greeks add up each leg's Greeks × quantity × lot size to describe the whole position
- Net delta shows directional exposure; for a neutral seller it starts near zero but doesn't stay there
- Net gamma (negative for sellers) shows how fast delta changes as the market moves
- Theta is the daily income; vega is the exposure to volatility changes
- Setting limits on net delta and vega helps sellers act before losses become severe
In this article · 16 sections
A multi-leg option position can't be understood one leg at a time. A short strangle, an iron condor or a ratio spread is a single exposure made of several parts, and position Greeks describe that exposure as a whole: how much it gains or loses per point, how fast that changes, how much it earns per day and how it responds to volatility. This lesson shows how sellers read and use position Greeks.
What You Will Learn
- How to calculate position Greeks
- What each one tells a seller
- How a neutral position becomes directional
- How to set Greek-based limits
Before You Start
Read Option Greeks: Delta and Gamma and Option Greeks: Theta, Vega and Rho, and the strategy lessons in Module 07.04.
Adding Up the Legs
For each leg, multiply the option's Greek by the number of lots, the lot size and +1 (bought) or −1 (sold). Add the results. Most broker platforms and strategy builders show these totals directly.
For example, a sold call with delta 0.30 contributes −0.30 × 65 = −19.5 to position delta per lot; a sold put with delta −0.25 contributes +16.25. Together, the short strangle's delta is about −3.25: close to neutral.
What Each Greek Tells a Seller
| Greek | Usual sign | What to watch |
|---|---|---|
| Delta | Near zero at entry | How far it drifts as the market moves |
| Gamma | Negative | How quickly delta will grow on a move; rises near expiry |
| Theta | Positive | Daily decay earned if nothing changes |
| Vega | Negative | Loss per one-point rise in IV |
Neutral Doesn't Stay Neutral
Because sellers are short gamma, position delta moves against them. As the market rises, a short strangle's delta becomes increasingly negative, so it loses more per point; as the market falls, delta becomes increasingly positive, again losing more per point.
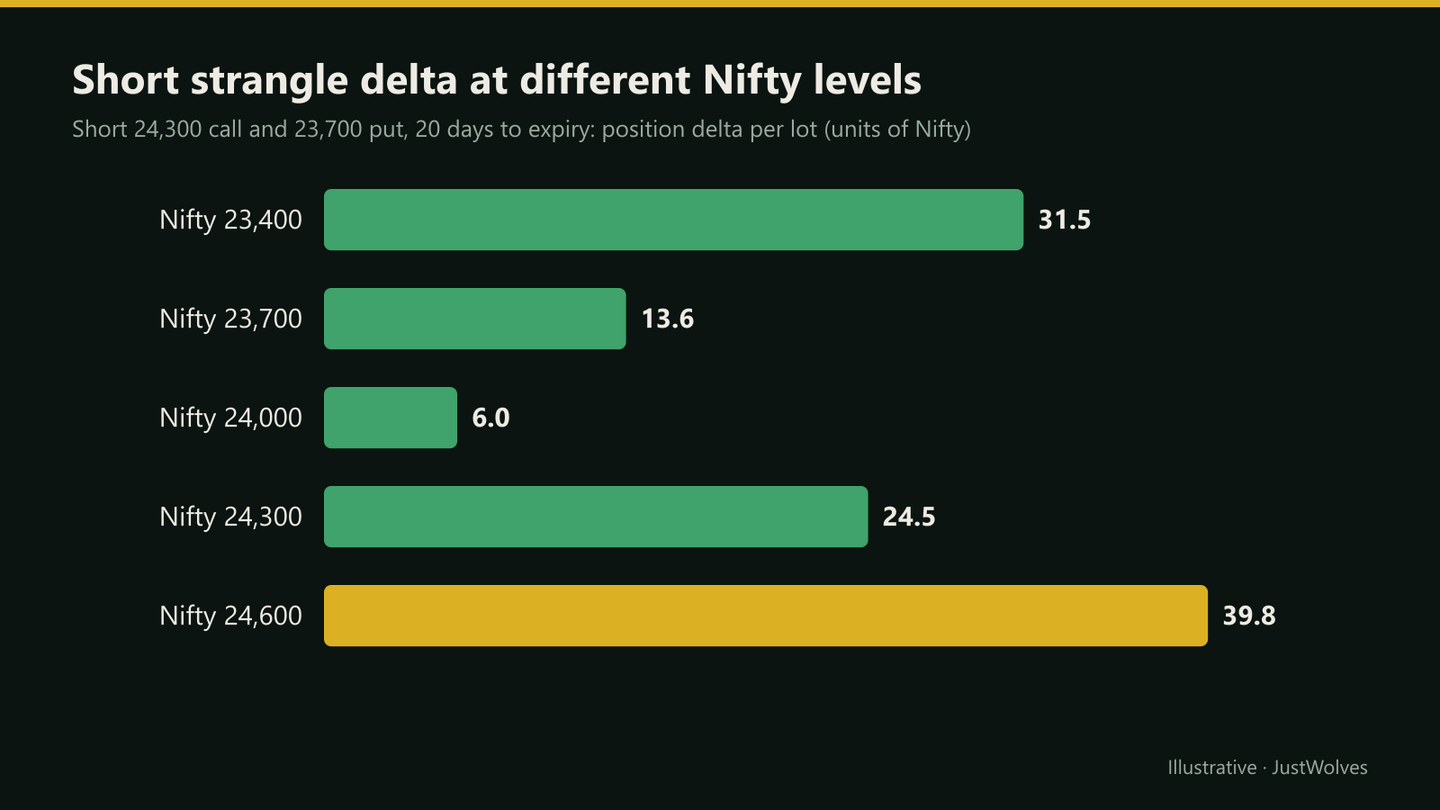
At 24,600, the 'neutral' strangle behaves like a short position of about 40 units of Nifty, more than half a futures lot, and it keeps growing as the rally continues.
Real Prices: Neutral to Long a Full Lot
The bar chart above shows the drift at fixed prices. The chart below follows a real 0.20-delta strangle through July and August 2025, with its position delta modelled each day, to show how the drift happens in a falling market and why P&L alone hides it.
Real NIFTY prices: a "neutral" strangle becomes a long position, July–August 2025
Step 1 of 4
A neutral start
On 9 July 2025 NIFTY closes at 25,476. A trader sells one lot of the 26,300 call and 24,950 put expiring on 7 August, each about 0.20 delta, for a modelled 171 points (₹11,130). Position delta: about 0, as this lesson's calculation section describes.
- What to observe
- Balanced: no view on direction.
- Condition
- A delta limit of 16 units (25% of a lot).
Setting Limits
- Delta limit: adjust or reduce when net delta exceeds a set number of units, for example 25% of one lot.
- Vega limit: cap the loss from a 5-point IV rise at a share of capital.
- Gamma awareness: reduce positions or widen strikes as expiry nears and gamma rises.
- Theta realism: theta is earned only if the market cooperates; don't size positions from theta alone.
Gamma Near Expiry
Net gamma isn't constant over a position's life. For the same strikes, gamma rises as expiry approaches, especially if the market is near a short strike. A strangle whose delta drifted slowly in its first weeks can swing by many units in a single session during its final days.
That's one reason sellers tighten delta limits, or close positions, as expiry nears. A limit that was comfortable with three weeks left may be breached several times a day with three days left.
Vega and Events
Net vega tells you what a volatility spike will cost. A book with net vega of −1,000 per point loses about ₹1,000 for each one-point rise in implied volatility, before any price move. In a sell-off, India VIX can rise several points in a day, so a seller's vega exposure can produce a large loss even if the index hasn't yet reached any short strike.
Checking net vega before scheduled events, and reducing it when it's large, is one of the simplest ways to avoid being surprised by a volatility jump.
Practical Example
Hypothetically, Rekha holds two lots of a short 24,300/23,700 strangle with 20 days left. At entry, net delta is about −12 units. Her limit is 30 units.
A rally takes Nifty to 24,300, and her net delta grows to about −49 units (24.5 × 2). She adjusts by buying back one lot of the short call, bringing delta back within her limit at the cost of a realised loss on that leg, rather than letting the position become a large, unhedged short.
How Far Does a Neutral Strangle Drift? Our Test
JustWolves sold a 30-day NIFTY strangle every week for about two years (November 2024 to November 2026), with the call and put each at about 0.20 delta, and tracked the position delta of one lot every day, 91 trades. We measured the largest delta each trade reached, how often it crossed a limit of 16 units (25% of a 65-unit lot, the example limit in this lesson), and how fast delta changed in each week of the trade. Values were modelled from recent realised volatility plus 15%.
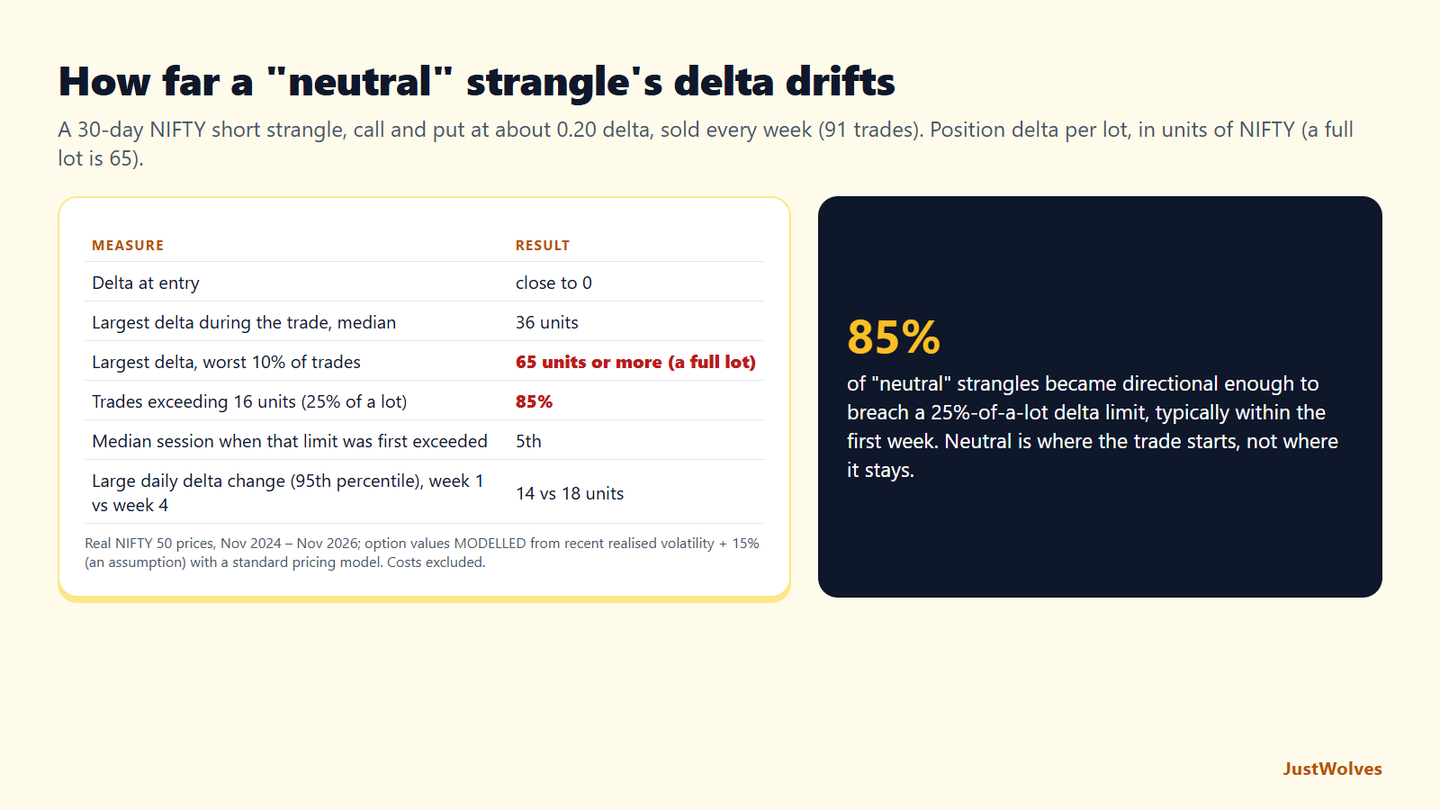
| Measure | Result |
|---|---|
| Delta at entry | Close to 0 |
| Largest delta during the trade, median | 36 units (55% of a lot) |
| Largest delta, worst 10% of trades | 65 units or more (a full lot) |
| Trades that exceeded 16 units (25% of a lot) | 85% |
| Median session in which that limit was first exceeded | 5th of about 21 |
| Large daily delta change (95th percentile), week 1 vs final week | 14 vs 18 units |
Neutral did not stay neutral, and it changed quickly. In the median trade, the strangle's delta reached 36 units at some point, more than half a futures lot, and in one trade in ten it reached a full lot. A delta limit of a quarter of a lot was breached in 85% of trades, typically within the first week. A seller using this lesson's limit would therefore be adjusting or reducing most positions, not just a few.
Gamma made the final week the most violent, as this lesson's section on gamma near expiry says: the largest daily swings in delta were bigger in the last week than the first, even though the average daily change was similar. That supports tightening limits, or closing, as expiry approaches.
The practical lesson is about the limit itself. A limit that is breached in almost every trade is really an instruction to manage every trade. Either accept that, and plan the adjustment in advance, as the next lesson describes, or set a wider limit with a smaller position size, so that the limit marks a genuine warning rather than normal noise. What the data rules out is ignoring delta because the P&L looks fine, as on 18 July in the chart above.
Common Mistakes
- Looking only at P&L rather than Greeks.
- Assuming a neutral entry stays neutral.
- Ignoring vega before events.
- Sizing from theta without considering gamma.
- Not setting limits in advance.
Professional Insight
Professional options desks set hard limits on net delta, gamma and vega for each book, and adjust whenever a limit is breached, regardless of P&L. Individual sellers who adopt even simple Greek limits behave more like risk managers and less like hopeful premium collectors.
Risk Considerations
- Greeks are estimates that change continuously.
- Large gaps move positions beyond what delta suggests.
- Model assumptions can fail in stress.
Important Terminology
| Term | Meaning |
|---|---|
| Position delta | Total delta across all legs, in units of the underlying. |
| Net gamma | Total gamma across legs. |
| Net theta | Total daily decay across legs. |
| Net vega | Total sensitivity to a one-point IV change. |
| Greek limit | A preset maximum exposure that triggers action. |
What are position Greeks?
The combined Greeks of all legs in a position, describing its total exposure to price, time and volatility.
Why does my neutral strangle become directional?
Because it's short gamma: as the market moves, delta grows against the position.
What delta limit should I use?
It depends on account size; many sellers act when net delta reaches a set fraction of one lot.
What is net vega?
The position's estimated gain or loss for a one-point change in implied volatility.
Where can I see position Greeks?
Most broker platforms and strategy builders show them for open positions.
How quickly does a short strangle become directional?
Quickly. In our test of 30-day NIFTY strangles at 0.20 delta, 85% of trades saw position delta exceed a quarter of a lot, and the median trade crossed that level in its fifth session. One trade in ten reached the delta of a full futures lot.
Why can a strangle lose money even when it looked profitable?
Because P&L shows the past and delta shows the exposure now. In a real July 2025 NIFTY example, a strangle was still slightly profitable when its delta had grown to 40% of a long lot; a few days later the fall continued and it was losing money.
Practical Exercise
Track Greeks for a paper position.
Your task
Step 1: Paper-sell a strangle
One month out, delta around 0.2 each side.
Step 2: Record daily
Net delta, gamma, theta and vega.
Step 3: Set limits
Delta and vega thresholds.
Step 4: Log
When a limit would have triggered, and what the P&L was then.
Check Your Understanding
Position delta is calculated by:
Related Lessons
Previous module: Ratio Spreads. Next: Adjusting Short Option Positions.