
Credit Spreads Explained: Selling Options with Defined Risk
JustWolves is an educational platform and is not a SEBI-registered investment advisor. Trading financial instruments involves significant risk of loss and may not be suitable for all investors. Past performance is not indicative of future results. Read our full disclaimer →
What you'll learn
- A credit spread sells an option and buys a further OTM option of the same type and expiry, for a net credit
- Maximum profit = net credit; maximum loss = spread width − net credit
- The bought option caps the loss and greatly reduces margin compared with a naked short option
- Wider spreads collect more but risk more; narrower spreads risk less but collect less
- The risk–reward is usually unfavourable per trade, so win rate, sizing and exits decide results
In this article · 16 sections
A credit spread is how most disciplined individual traders sell options. You sell one option, collect the premium, and use part of it to buy a cheaper option further out. The bought option caps your maximum loss, which turns the open-ended risk of naked selling into a known, defined amount. This lesson explains how credit spreads work, the numbers that define them, and the trade-offs in choosing strikes and width.
What You Will Learn
- How credit spreads are built
- Maximum profit, maximum loss and breakeven
- How width and strike choice change the trade
- Margin and management
Before You Start
Read Short Calls and Short Puts and, from the F&O course, Bull Call Spread, which is the debit-spread counterpart.
How It's Built
| Spread | Sell | Buy | View |
|---|---|---|---|
| Bull put spread | A put (higher strike) | A put (lower strike) | Underlying stays above the short strike |
| Bear call spread | A call (lower strike) | A call (higher strike) | Underlying stays below the short strike |
Both legs have the same expiry and quantity. You receive more for the option you sell than you pay for the one you buy, so you collect a net credit.
The Numbers
| Measure | Formula | Example: sell 23,700 put at 184, buy 23,500 put at 127 |
|---|---|---|
| Net credit | Premium received − premium paid | 57 |
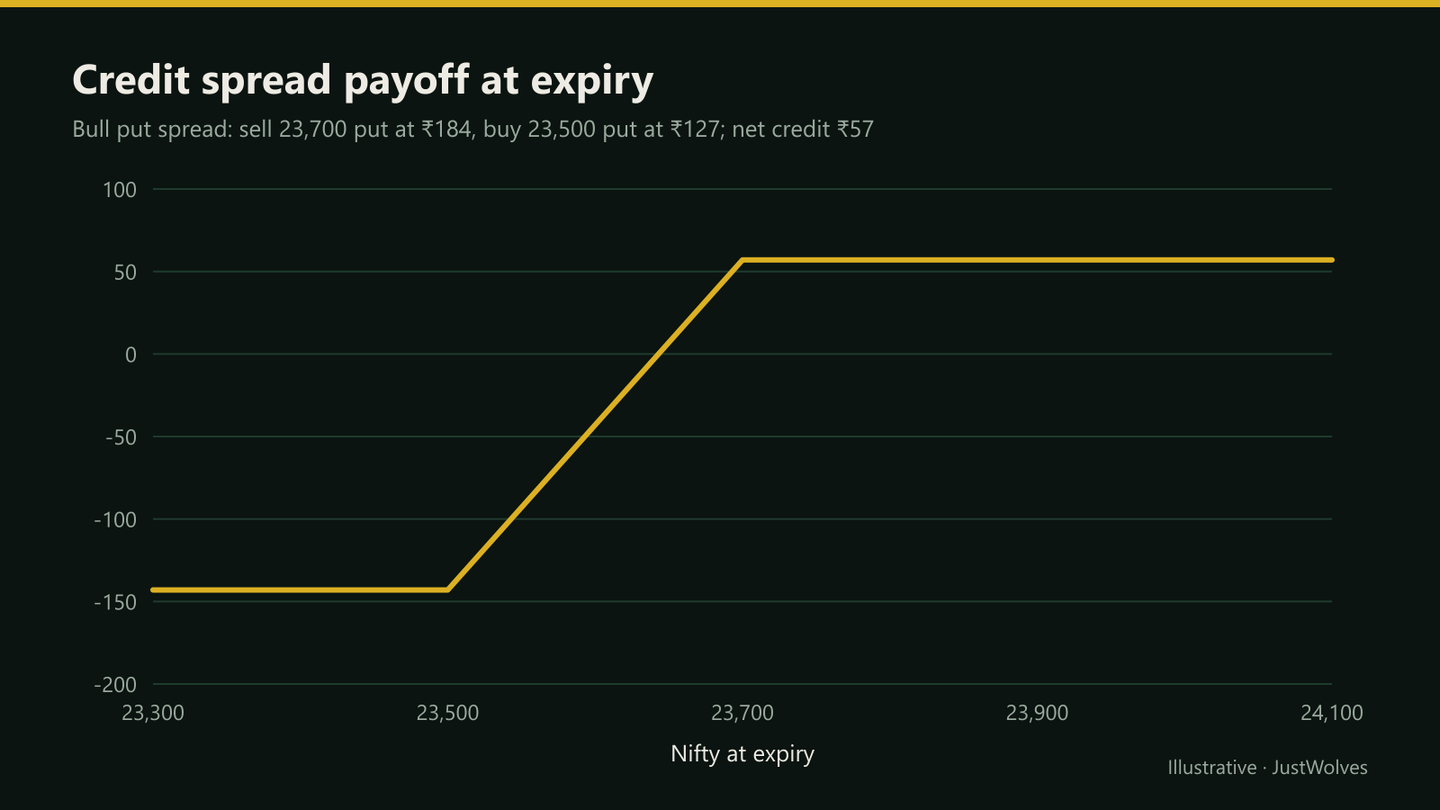
| Maximum profit | Net credit | 57 |
| Spread width | Distance between strikes | 200 |
| Maximum loss | Width − net credit | 143 |
| Breakeven | Short strike ∓ net credit | 23,643 (put spread) |
Choosing Width and Strikes
- Short strike: where you expect the underlying not to go, often beyond a support or resistance level, or at a delta around 0.2–0.3.
- Long strike: sets the width. Wider spreads collect more credit and need more margin, with a larger maximum loss.
- Credit relative to width: many sellers look for a credit of roughly a quarter to a third of the width; much less means a poor reward for the risk.
Why the Risk–Reward Looks Poor
In the example, you risk ₹143 to make ₹57 per unit, about 2.5 to 1 against you. That's normal for credit spreads: the short strike is out of the money, so the trade wins more often than it loses, but each loss is larger than each win.
Whether that's profitable depends on the actual win rate after costs and on how losses are managed. Closing losing spreads early, before they reach maximum loss, changes the arithmetic considerably.
Margin and Execution
Because the loss is capped, margin for a credit spread is far lower than for a naked short option, often close to the maximum loss. Place the bought leg first, or use a basket order, so you never hold the short leg alone. Close both legs together when exiting.
Managing Credit Spreads
- Profit target: close at 50–75% of the credit received.
- Loss limit: close if the spread's value reaches, for example, twice the credit received, or if the underlying breaks the short strike.
- Time: close or roll before expiry week if the short strike is threatened.
Real Prices: Through the Loss Limit and Back
This lesson suggests exiting a credit spread when its value reaches twice the credit. The chart below shows what that rule did on one real month of NIFTY 50 prices, May to June 2026, with a bull put spread valued each day by a standard pricing model.
Real NIFTY prices: a credit spread through its loss limit and back, May–June 2026
Step 1 of 4
Selling the spread
On 25 May 2026 NIFTY closes at 24,032. A trader sells the 23,500/23,300 bull put spread expiring on 24 June for a modelled credit of about 47 points: ₹3,050 per lot. Maximum loss: 200 − 47 = 153 points, about ₹9,950.
- What to observe
- Risking about three times the credit, as this lesson describes.
- Condition
- Rules like Divya's: exit if the spread reaches twice the credit, about 94.
Practical Example
Hypothetically, Nifty is at 24,000 with support near 23,700. Divya sells the 30-day 23,700/23,500 bull put spread for a net credit of ₹57, collecting ₹3,705 per lot. Her maximum loss per lot is ₹143 × 65 = ₹9,295.
Her rules: take profit at ₹20 (about 65% of the credit), exit if the spread reaches ₹115 (twice the credit). Three weeks later, Nifty is at 24,150 and the spread is worth ₹18; she closes for a profit of (57 − 18) × 65 = ₹2,535.
Held or Managed? Credit Spreads on Two Years of NIFTY
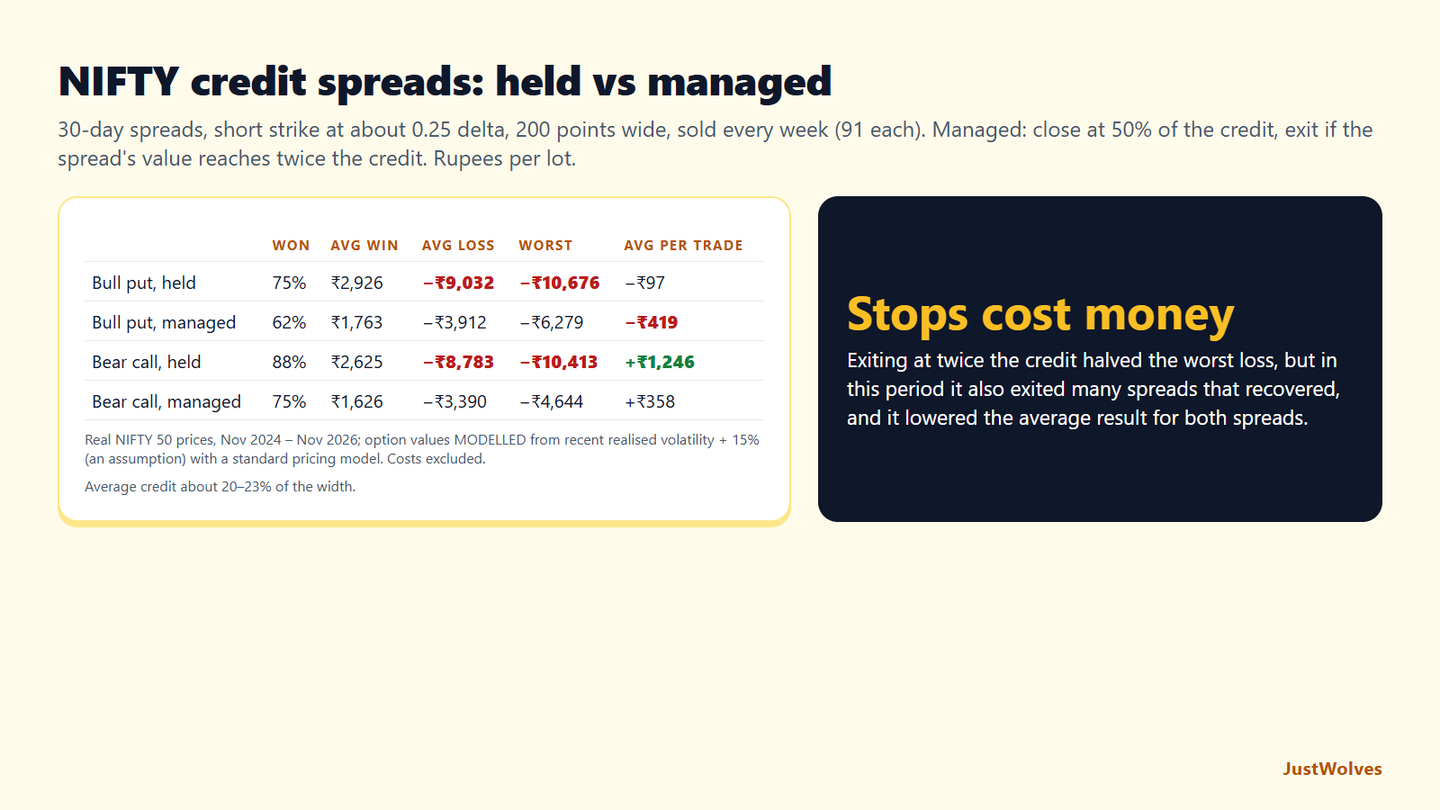
JustWolves sold NIFTY credit spreads every week for about two years (November 2024 to November 2026): bull put spreads and bear call spreads, each with the short strike at about 0.25 delta, 200 points wide and about 30 days to expiry, 91 of each. We ran them held to expiry and managed with this lesson's rules: close at 50% of the credit, or exit when the spread is worth twice the credit. Credits averaged 41–45 points, about 20–23% of the width; values were modelled from recent realised volatility plus 15%.
| Won | Average win | Average loss | Worst | Average per trade | |
|---|---|---|---|---|---|
| Bull put, held | 75% | ₹2,926 | −₹9,032 | −₹10,676 | −₹97 |
| Bull put, managed | 62% | ₹1,763 | −₹3,912 | −₹6,279 | −₹419 |
| Bear call, held | 88% | ₹2,625 | −₹8,783 | −₹10,413 | +₹1,246 |
| Bear call, managed | 75% | ₹1,626 | −₹3,390 | −₹4,644 | +₹358 |
This lesson's risk–reward warning held exactly. Held to expiry, the average loss was three to four times the average win, about ₹9,000 against ₹2,800. The bull put spread won 75% of the time and still lost money on average; the bear call spread won 88% and made money in this period. A different two years could reverse which side did better.
The loss limit cut the worst losses by 40–55%, and still lowered the average result. Exiting at twice the credit was triggered in 25–38% of trades, and in this period many of those spreads recovered, as in the chart above. The managed bull put lost more on average than the held one, and the managed bear call earned less than a third as much.
That does not mean loss limits are wrong. They exist to stop a gap or a trend from turning every losing trade into a maximum loss, and to keep a run of bad months survivable. But a stop as tight as one credit gets hit by ordinary noise on a 200-point-wide spread. If you use one, test it against your spread width and expiry, or use a chart level, such as a close below support, instead of a value multiple.
Common Mistakes
- Very narrow spreads with tiny credits that barely cover costs.
- Letting spreads reach maximum loss instead of exiting at a limit.
- Legging out, closing the long leg and leaving the short naked.
- Ignoring that maximum loss exceeds maximum profit.
- Too many spreads in the same direction.
Professional Insight
Experienced spread sellers focus on the quality of each trade (enough credit relative to width, strikes beyond meaningful levels) and on strict loss management. Most of their long-term results come from cutting losers early rather than from collecting maximum profit on winners.
Risk Considerations
- Maximum loss is usually larger than maximum profit.
- Gaps can move the spread straight to maximum loss.
- Costs on two legs reduce small credits.
Important Terminology
| Term | Meaning |
|---|---|
| Credit spread | Sell one option, buy a further OTM option, for a net credit. |
| Net credit | Premium received minus premium paid. |
| Spread width | The distance between the strikes. |
| Short strike | The strike of the sold option. |
| Long strike | The strike of the bought (protective) option. |
What is a credit spread?
Selling an option and buying a further OTM option of the same type and expiry, receiving a net credit.
What is the maximum loss on a credit spread?
The spread width minus the net credit received.
Is a credit spread safer than naked selling?
It has a defined maximum loss and lower margin, though that loss is usually larger than the maximum profit.
How wide should a credit spread be?
It depends on account size and premium. Many traders aim for a credit of about a quarter to a third of the width.
When should I close a credit spread?
Common rules are at 50–75% of the credit for profits, or at a set multiple of the credit for losses.
What win rate do credit spreads need?
A high one. In our test of 0.25-delta NIFTY credit spreads 200 points wide, the average loss was three to four times the average win, so a bull put spread winning 75% of the time still lost money on average before costs, while a bear call spread winning 88% made money.
Is it better to hold a credit spread or exit at a loss limit?
It depends on the limit. In our two-year NIFTY test, exiting at twice the credit cut the worst losses by 40–55% but lowered the average result, because many stopped-out spreads recovered by expiry. A wider limit or a chart-based exit may suit 200-point spreads better.
Practical Exercise
Build two credit spreads.
Your task
Step 1: Pick strikes
A bull put spread below support and a bear call spread above resistance.
Step 2: Calculate
Net credit, maximum loss and breakeven per lot for each.
Step 3: Check margin
In your broker's calculator, compared with the naked short leg.
Step 4: Write exits
Profit target and loss limit for each.
Check Your Understanding
A credit spread's maximum profit is:
Related Lessons
Previous module: Cash-Secured Puts. Next: Bull Put Spread.