
Bull Put Spread: A Bullish Credit Spread
JustWolves is an educational platform and is not a SEBI-registered investment advisor. Trading financial instruments involves significant risk of loss and may not be suitable for all investors. Past performance is not indicative of future results. Read our full disclaimer →
What you'll learn
- A bull put spread sells a put and buys a lower-strike put with the same expiry, for a net credit
- It profits if the underlying stays above the short strike; it doesn't need the underlying to rise
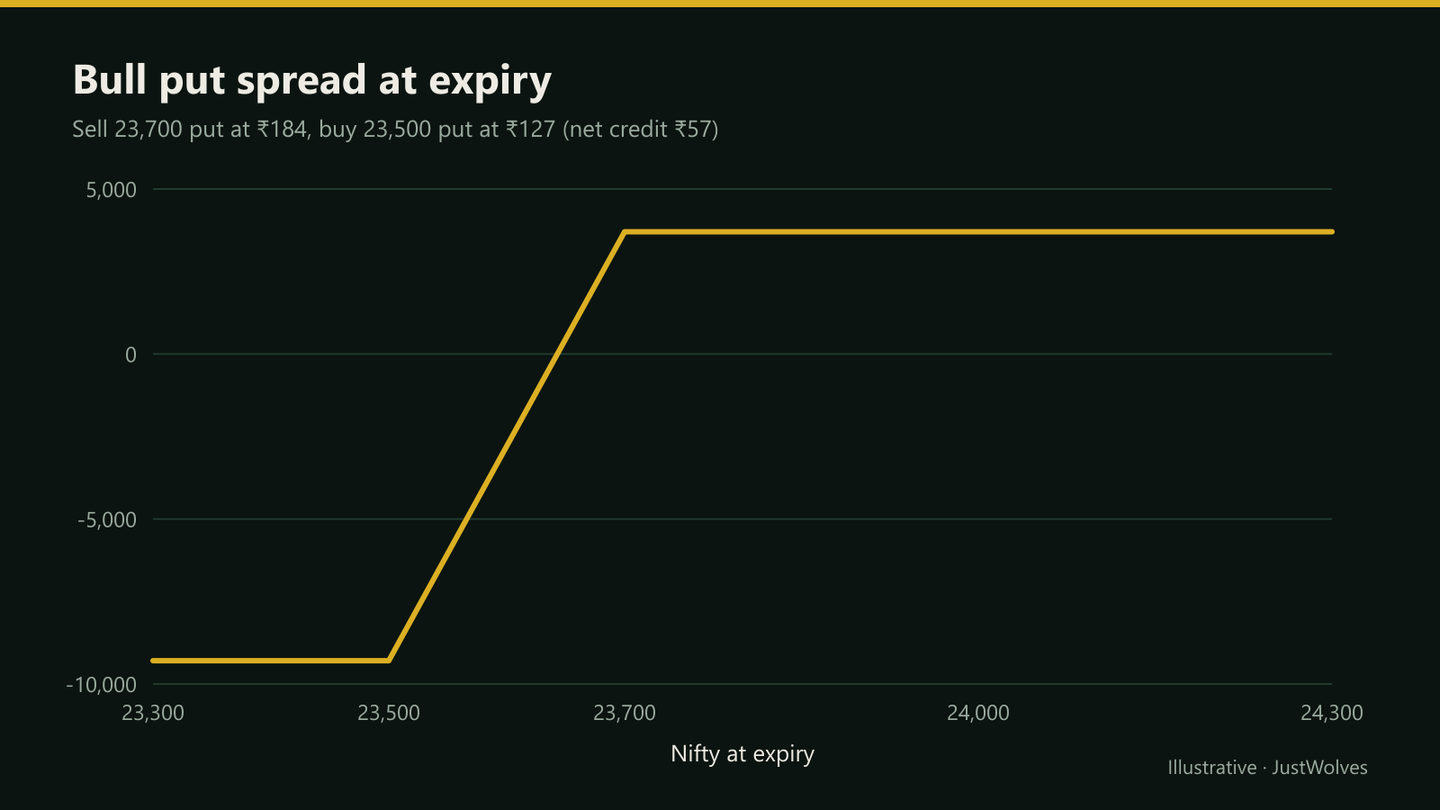
- Maximum profit = net credit; maximum loss = width − credit; breakeven = short strike − credit
- Short strikes below meaningful support give the trade a structural reason to work
- It's the credit-spread alternative to a bull call spread, with a higher win rate and a less favourable payoff ratio
In this article · 17 sections
A bull put spread is a bullish, or at least not-bearish, credit spread. You sell a put below the current price and buy a cheaper put further down. If the market stays above your short strike, both puts expire worthless and you keep the credit. You don't need a rally, only for the market not to fall too far. This lesson covers how to build, price and manage the spread.
What You Will Learn
- How a bull put spread is built
- Its profit, loss and breakeven
- Choosing strikes around support
- How it compares with a bull call spread
Before You Start
Read Credit Spreads Explained first.
How It's Built
- Sell a put at a strike below the current price (the short strike).
- Buy a put at a lower strike (the long strike), same expiry, same quantity.
- Receive a net credit.
The Numbers
| Measure | Per unit | Per lot (65) |
|---|---|---|
| Net credit (maximum profit) | ₹57 | ₹3,705 |
| Maximum loss | ₹143 | ₹9,295 |
| Breakeven | 23,643 | — |
| Distance from Nifty to short strike | 300 points (1.25%) | — |
Choosing Strikes
- Short strike below support: a level where buyers have stepped in before gives the trade a structural reason to work.
- Outside the expected move: compare the distance to the move implied by IV for the period.
- Width: set by the maximum loss your risk per trade allows.
In an uptrend, bull put spreads sold below the most recent higher low align the position with the trend's structure, as covered in Pullbacks and Retracements.
Real Prices: Sold Against the Trend
This lesson suggests selling bull put spreads in uptrends, below the most recent higher low. The chart below shows the opposite on real NIFTY 50 prices from August and September 2026: a bull put spread sold while NIFTY was below its 50-day average. The spread is valued each day by a standard pricing model.
Real NIFTY prices: a bull put spread sold against the trend, August–September 2026
Step 1 of 4
Selling below the 50-day average
On 26 August 2026 NIFTY closes at 24,208, below its 50-day average after a slide from the 24,600s. A trader sells the 23,900/23,700 bull put spread expiring on 25 September for a modelled credit of about 40 points: ₹2,630 per lot. Maximum loss: 160 points, about ₹10,400.
- What to observe
- This lesson's mistakes list warns against bull put spreads in downtrends.
- Condition
- In our test, trades like this lost money on average.
Compared with a Bull Call Spread
| Bull call spread (debit) | Bull put spread (credit) | |
|---|---|---|
| Needs | A rise toward the upper strike | No fall below the short strike |
| Win rate | Lower | Higher |
| Payoff ratio | Often favourable | Usually unfavourable |
| Time decay | Mostly against you | Mostly in your favour |
Managing the Spread
Close at 50–75% of the credit if the market moves away from the short strike. If Nifty falls toward the short strike, exit at your loss limit, commonly around twice the credit, rather than hoping for a recovery. Losses grow quickly once the short strike is breached, especially near expiry.
Avoid holding through high-impact events if a gap could move Nifty below the long strike. The spread caps the loss, but it doesn't reduce the chance of reaching it.
Choosing Expiry
Most bull put spread sellers use expiries between two and six weeks. Shorter spreads decay faster but leave little room if the market dips; a short strike that's 300 points away with three days left can be breached in a single session. Longer spreads give more time for the market to recover from a dip, but tie up margin longer and collect premium more slowly at first.
Whatever the expiry, plan to close or roll well before the final days if the short strike is anywhere near the market. The capped loss makes the position survivable, but reaching it repeatedly is what turns a high-win-rate strategy into a losing one.
Rolling a Threatened Spread
If Nifty falls toward the short strike and you still expect support to hold, some traders roll: close the spread and open a new one further out in time, sometimes at lower strikes, ideally for a net credit. Rolling can give the trade more time, but it's not a free fix. It often locks in part of the loss and extends exposure. Decide your rolling rules before you enter, and don't roll simply to avoid admitting a loss.
Practical Example
Hypothetically, Nifty pulls back to 24,000 in an uptrend, with a higher low at 23,750. Anil sells the 23,700/23,500 bull put spread for ₹57 on two lots, collecting ₹7,410. His maximum loss is ₹18,590, about 2.5% of his ₹7,50,000 account.
Nifty dips to 23,780 a week later and the spread widens to ₹95, but his ₹115 loss limit isn't hit. Two weeks after that, Nifty is at 24,250 and the spread is worth ₹15; he closes for (57 − 15) × 65 × 2 = ₹5,460.
Does the Trend Matter? Our Test
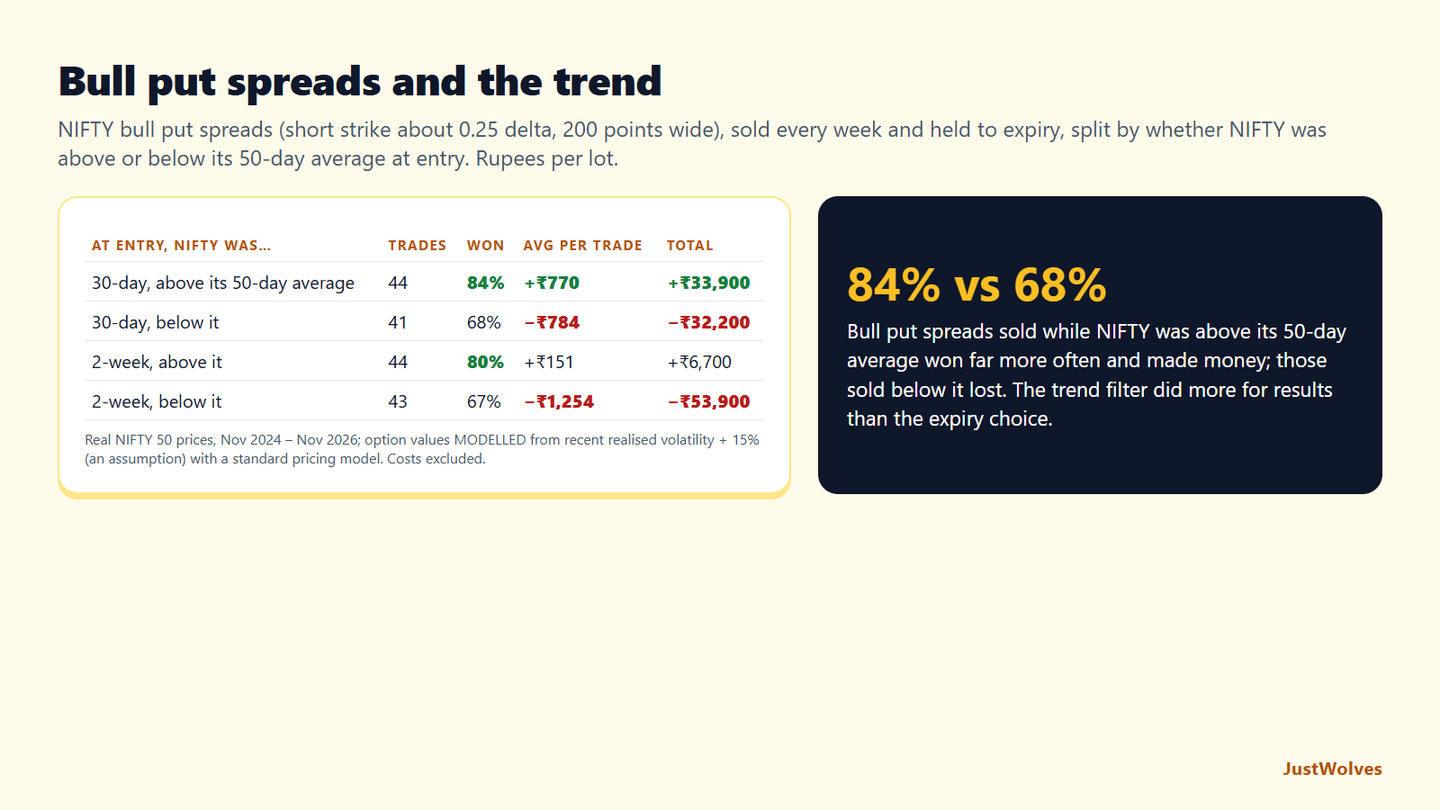
JustWolves sold a NIFTY bull put spread every week for about two years (November 2024 to November 2026), with the short strike at about 0.25 delta and the long strike 200 points lower, and held it to expiry. We split the trades by one simple trend measure, whether NIFTY closed above or below its 50-day average on the day of entry, and ran the test with two expiries: about 30 days and about two weeks. Values were modelled from recent realised volatility plus 15%.
| At entry | Trades | Won | Average per trade | Total |
|---|---|---|---|---|
| 30-day, NIFTY above its 50-day average | 44 | 84% | +₹770 | +₹33,900 |
| 30-day, NIFTY below it | 41 | 68% | −₹784 | −₹32,200 |
| 2-week, NIFTY above its 50-day average | 44 | 80% | +₹151 | +₹6,700 |
| 2-week, NIFTY below it | 43 | 67% | −₹1,254 | −₹53,900 |
The trend filter split the results cleanly. Sold with NIFTY above its 50-day average, 30-day bull put spreads won 84% of the time and made about ₹770 per trade. Sold below it, they won only 68% and lost about the same amount per trade. Over two years, the same strategy made ₹33,900 per lot in one group and lost ₹32,200 in the other. That supports this lesson's advice to sell bull put spreads in uptrends and its mistakes list's warning about downtrends.
Expiry mattered less than trend. Two-week spreads followed the same pattern, but earned less in uptrends and lost more in downtrends than 30-day spreads, consistent with this lesson's note that a short strike a few hundred points away with little time left can be breached in a single session.
One caution: this is one filter on one two-year period, with about 40 trades in each group. It is a reason to respect the trend, not proof that a 50-day average is the right measure. The structural rule in this lesson, a short strike below a real higher low, says the same thing in chart terms.
Common Mistakes
- Selling bull put spreads in downtrends.
- Strikes just below the current price with no support behind them.
- Holding to maximum loss.
- Sizing by margin rather than maximum loss.
- Ignoring events that could gap the market lower.
Professional Insight
Experienced traders often prefer bull put spreads to bull call spreads when implied volatility is elevated, because they're selling the expensive premium rather than buying it. When IV is low, the debit spread is often the better bullish structure.
Risk Considerations
- Maximum loss exceeds maximum profit.
- Sharp falls reach maximum loss quickly.
- Correlated positions multiply downside exposure.
Important Terminology
| Term | Meaning |
|---|---|
| Bull put spread | Short higher-strike put, long lower-strike put. |
| Net credit | Premium received minus premium paid. |
| Short strike | The sold put's strike. |
| Loss limit | A preset exit level for a losing spread. |
| Expected move | The move implied by option prices. |
What is a bull put spread?
A credit spread that sells a put and buys a lower-strike put, profiting if the underlying stays above the short strike.
Does a bull put spread need the market to rise?
No. It profits if the market stays above the short strike, whether it rises, stays flat or falls slightly.
What is the maximum loss?
The width between strikes minus the net credit received.
Bull put spread or bull call spread?
Credit spreads suit higher IV and modest views; debit spreads suit lower IV and a clear expected rise.
Where should the short strike be?
Often below a meaningful support level and outside the expected move for the period.
Does the trend matter for bull put spreads?
In our test, a great deal. On two years of real NIFTY prices with modelled premiums, 30-day bull put spreads sold with NIFTY above its 50-day average won 84% of the time and made money; those sold below it won 68% and lost about as much as the others made.
Should a bull put spread be two weeks or a month?
In our NIFTY test, both followed the trend, but two-week spreads earned less in uptrends and lost more in downtrends than 30-day spreads. A short strike close to the price has little room when only a few sessions remain.
Practical Exercise
Plan a bull put spread.
Your task
Step 1: Find support
On the daily Nifty chart in an uptrend.
Step 2: Choose strikes
Short below support; long 100–200 points lower.
Step 3: Calculate
Credit, maximum loss and breakeven per lot.
Step 4: Size
How many lots keep maximum loss within your risk limit?
Check Your Understanding
A bull put spread sells:
Related Lessons
Previous: Credit Spreads Explained. Next: Bear Call Spread. See also Bull Call Spread.