
Trend Identification on Daily and Weekly Charts
JustWolves is an educational platform and is not a SEBI-registered investment advisor. Trading financial instruments involves significant risk of loss and may not be suitable for all investors. Past performance is not indicative of future results. Read our full disclaimer →
What you'll learn
- A trend is defined by its swings: higher highs and higher lows for up, lower highs and lower lows for down
- Moving average slope and price position confirm what the swings show
- Use the weekly chart for the main trend and the daily chart for the swing you trade
- When weekly and daily disagree, trade the daily only in the weekly direction, or stand aside
- Ranging markets need different tactics or no trades at all
In this article · 15 sections
Almost every swing trading method starts with the same question: which way is the market going? Swing traders who get the trend right can afford imperfect entries; those who trade against it struggle even with good ones. This lesson covers how to identify trends on the daily and weekly charts using swing structure and moving averages, and what to do when the two timeframes disagree.
What You Will Learn
- How to define a trend from swing structure
- How moving averages confirm the trend
- How to combine weekly and daily charts
- When to stand aside
Before You Start
This lesson applies Market Trends and Swing Highs and Swing Lows from the Price Action course to swing trading. Read those first if you haven't.
Structure First
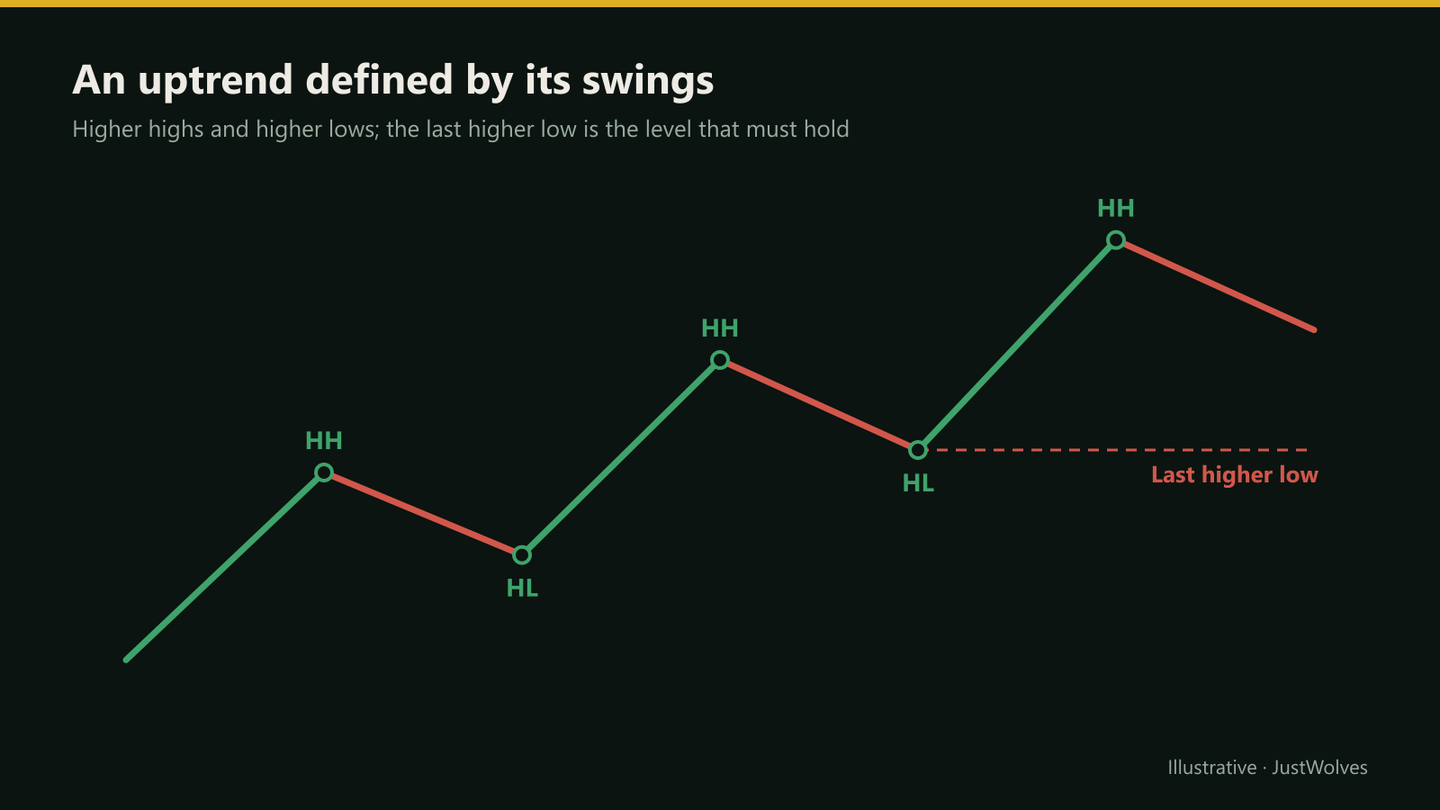
- Uptrend: a sequence of higher highs and higher lows.
- Downtrend: lower highs and lower lows.
- Range: highs and lows at roughly the same levels.
The trend stays intact as long as the last swing that defined it holds. In an uptrend, that's the most recent higher low; a daily close below it is the first sign the trend may be ending.
Moving Averages as Confirmation
| Check | Uptrend | Downtrend |
|---|---|---|
| Price vs 50-day MA | Mostly above | Mostly below |
| 50-day MA slope | Rising | Falling |
| 50-day vs 200-day | 50 above 200 | 50 below 200 |
Moving averages lag, so they confirm a trend after the swings have shown it. Their value is consistency: the same rules applied to every chart give the same answer.
Weekly and Daily Together
| Weekly | Daily | Common approach |
|---|---|---|
| Up | Up | Look for long setups |
| Up | Pulling back | Prepare for longs when the daily pullback ends |
| Up | Down for several weeks | Caution: the weekly trend may be ending; reduce size or wait |
| Down | Up (bounce) | Avoid longs, or treat as short-term only; look for shorts when the bounce fails |
| Range | Any | Trade the range edges or stand aside |
Real Prices: NIFTY's Weekly Trend, Its Last Higher Low and the Break
The diagram above is schematic. The chart below shows real NIFTY 50 weekly candles from August 2025 to March 2026: an uptrend built from higher highs and higher lows, the last higher low that had to hold, and the weeks in which it did not.
Real NIFTY weekly prices: an uptrend, its last higher low, and the break, 2025–2026
Step 1 of 4
Structure: higher highs and lows
From August to November 2025 NIFTY's weekly chart makes higher lows (about 24,340, 24,590, 25,320) and higher highs (25,450, 26,100, 26,310). By this lesson's definition, the weekly trend is up.
- What to observe
- Each pullback holds above the last one.
- Condition
- The uptrend stays intact while the last higher low holds.
Ranges and Choppy Markets
Not every chart trends. When swings overlap, moving averages flatten and price crosses them repeatedly, the market is ranging. Trend-following swing setups fail often in these conditions.
Options: trade only the edges of a clear range, wait for a breakout, or move on to a stock that is trending. Many swing traders keep a rule that they only trade stocks in clear trends.
A Simple Trend Checklist
Writing the trend decision down as a checklist makes it repeatable and stops you from reading the chart differently depending on the trade you want. A practical version for each stock on the watchlist: Is the weekly chart making higher highs and higher lows, lower highs and lower lows, or neither? Is price above or below a rising or falling 50-week average? On the daily chart, where is the last swing that defines the trend, and is price above or below it?
Answer the questions in the same order every time and record the result as a short label, such as 'weekly up, daily pullback' or 'weekly range'. Over a few weeks, these labels show you which conditions your setups work best in. They also make the decision explicit before you look for an entry, so a tempting candle can't quietly change your view of the trend.
Review the labels each weekend. Trends change gradually, and a stock that was 'weekly up' a month ago may now be 'weekly range'. Updating the label when the structure changes, rather than when a trade goes wrong, keeps your direction calls honest.
Practical Example
Hypothetically, a stock's weekly chart shows higher highs and lows, with price above a rising 50-week average. On the daily chart, it has pulled back for two weeks from ₹1,320 to ₹1,245 but remains above the last daily higher low at ₹1,220.
Priya classifies it as 'weekly up, daily pullback' and adds it to her watchlist with a trigger: a daily bullish candle above ₹1,260. If the stock closes below ₹1,220, she'll remove it.
Does Trading With the Weekly Trend Help? Our Test
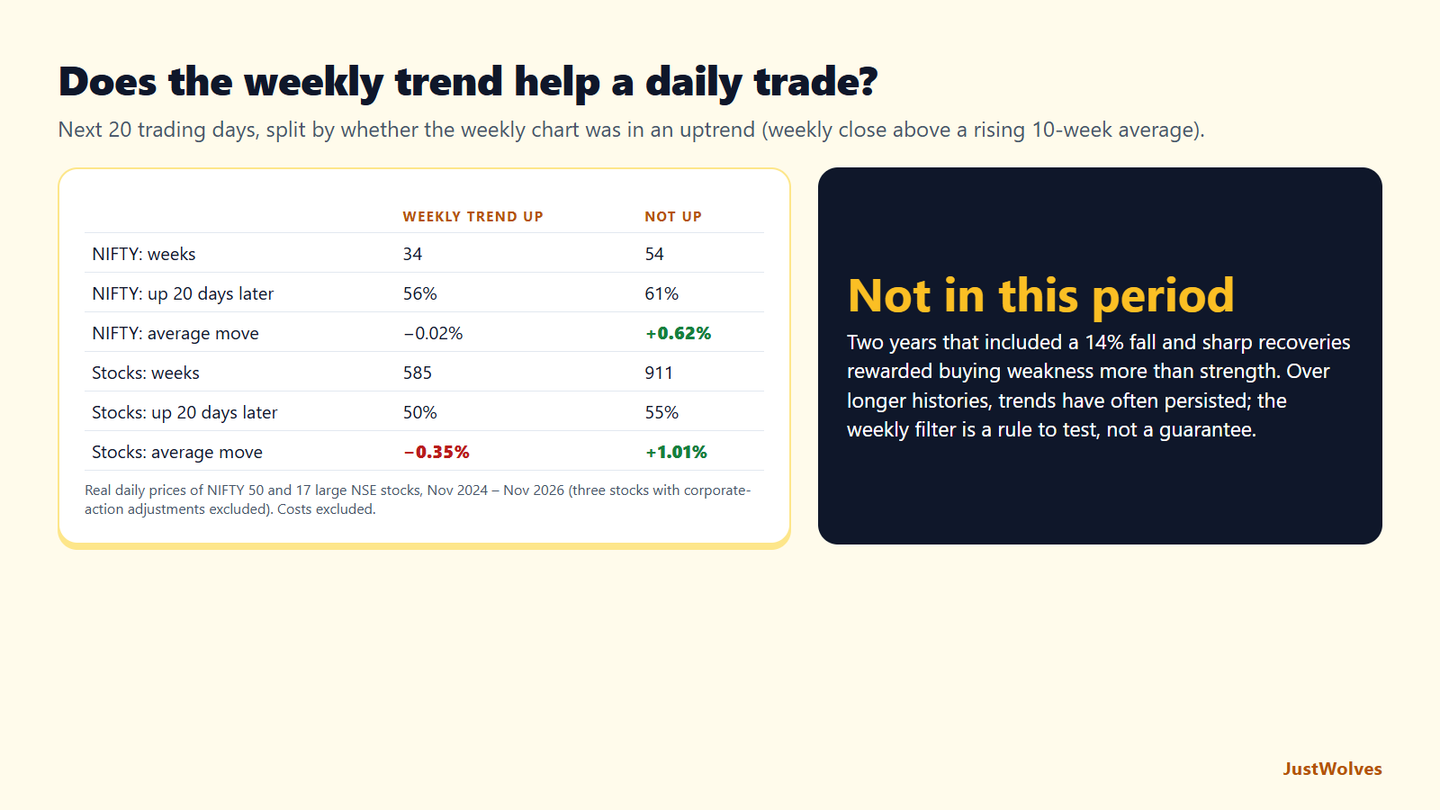
This lesson's callout recommends taking daily setups only in the direction of the weekly trend. JustWolves tested the simplest version on about two years of real data (November 2024 to November 2026) for NIFTY 50 and 17 large NSE stocks. Weekly trend up: the weekly close above a rising 10-week average. For each week, we measured the move over the next 20 trading days and compared weeks with the weekly trend up against all other weeks.
| Weekly trend up | Weekly trend not up | |
|---|---|---|
| NIFTY: weeks | 34 | 54 |
| NIFTY: higher 20 days later | 56% | 61% |
| NIFTY: average move | −0.02% | +0.62% |
| Stocks: weeks | 585 | 911 |
| Stocks: higher 20 days later | 50% | 55% |
| Stocks: average move | −0.35% | +1.01% |
In these two years, the weekly filter did not help. Weeks in which NIFTY and the stocks were in a weekly uptrend were followed by slightly weaker 20-day results than other weeks. This period was shaped by two sharp falls and quick recoveries, in which buying weakness paid better than buying strength; the Price Action course's tests on this site found the same for trend filters on daily charts.
That does not make this lesson's rule wrong, but it changes what it is for. The chart above shows its real value: the weekly structure marked the warning line, the last higher low, months before the March 2026 low, and a trader who stopped taking daily long setups when that line broke avoided the worst of the fall. The weekly trend is a risk filter more than a return filter: it tells you when to stand aside, even if in calm periods it does not add to returns.
Over longer histories, trends in many markets have tended to persist more than they did here. Record the trend label for each trade, as this lesson's checklist suggests, and check after a few months whether your own results are better with the weekly trend or against it.
Common Mistakes
- Trading daily signals against the weekly trend.
- Calling a trend change on one large candle.
- Using moving averages alone without swing structure.
- Trading trend setups in ranges.
- Changing timeframes to find a trend that agrees with a desired trade.
Professional Insight
Many experienced swing traders spend more time deciding direction than choosing entries. Once the weekly and daily trends are clear, the setup and entry become straightforward; when they aren't clear, the best trade is often no trade.
Risk Considerations
- Trends change; the last swing is the warning line.
- Moving averages lag at turning points.
- Ranges produce repeated false signals.
Important Terminology
| Term | Meaning |
|---|---|
| Higher high / higher low | Swing points above the previous ones. |
| Swing structure | The sequence of swing highs and lows. |
| Moving average slope | Whether the average is rising, falling or flat. |
| Range | Price moving sideways between similar highs and lows. |
| Timeframe alignment | Weekly and daily trends pointing the same way. |
How do I identify a trend for swing trading?
Look for higher highs and higher lows (uptrend) or lower highs and lower lows (downtrend) on the daily and weekly charts, confirmed by moving average slope.
Which timeframe defines the trend?
Many swing traders use the weekly for the main trend and the daily for the swing they trade.
What if the weekly and daily trends disagree?
Trade the daily only in the weekly direction, or wait until they align.
Which moving averages confirm a trend?
Commonly the 50-day and 200-day: price above a rising 50-day, and the 50-day above the 200-day, for an uptrend.
When does an uptrend end?
A close below the last higher low is the first warning; a lower high afterwards strengthens it.
Does trading with the weekly trend improve results?
Not in our two-year test. On NIFTY and 17 large NSE stocks, weeks with the weekly trend up (close above a rising 10-week average) were followed by slightly weaker 20-day returns than other weeks. Its value was in flagging breakdowns, such as March 2026, rather than adding return.
How do I know when a weekly uptrend has ended?
Mark the last higher low. On NIFTY's weekly chart, the week of 5 January 2026 closed just below the December higher low of 25,693; a lower high followed in February and a fall of about 14% by the end of March.
Practical Exercise
Classify your watchlist.
Your task
Step 1: Take ten stocks
From your watchlist.
Step 2: Classify the weekly trend
Up, down or range.
Step 3: Classify the daily trend
Up, down, pullback or range.
Step 4: Decide
Which stocks are tradable under the weekly-direction rule?
Check Your Understanding
An uptrend consists of:
Related Lessons
Previous module: Swing Trading Indicators and Timeframes. Next: Moving Average Swing Strategies. See also Market Trends.