
Market Selection, Scanning and Watchlists for Swing Trading
JustWolves is an educational platform and is not a SEBI-registered investment advisor. Trading financial instruments involves significant risk of loss and may not be suitable for all investors. Past performance is not indicative of future results. Read our full disclaimer →
What you'll learn
- Start from a liquid universe, such as Nifty 200 or F&O stocks, to keep spreads tight
- Filter for trend (price above rising moving averages) and relative strength against the index
- Prefer stocks with enough volatility to move, but not so much that stops become impractical
- Build a short watchlist of setups forming, not a long list of every stock that passed a scan
- A weekly routine for scanning and a daily check keeps swing trading manageable
In this article · 16 sections
With thousands of listed companies in India, choosing what to trade is half the work of swing trading. A good process narrows the universe to liquid stocks, filters for trend and strength, and ends with a short watchlist of setups that are close to triggering. This lesson walks through that process and a weekly routine that keeps it manageable.
What You Will Learn
- How to choose a tradable universe
- Trend, strength and volatility filters
- How to build a useful watchlist
- A weekly scanning routine
Before You Start
Read Swing Trading vs Day Trading and, from the Price Action course, Market Trends.
Step 1: Choose a Universe
Start with stocks that trade actively, so you can enter and exit near quoted prices. Common choices are the Nifty 100, Nifty 200 or the list of stocks in the F&O segment, which are among the more liquid names.
Avoid very illiquid stocks for swing trading: wide bid-ask spreads, gaps and occasional circuit limits can make stops unreliable.
Step 2: Filter
| Filter | Example rule | Purpose |
|---|---|---|
| Liquidity | Average daily traded value above a set amount | Tradable size, tight spreads |
| Trend | Close above a rising 50-day moving average | Trade with the trend |
| Long-term context | Close above the 200-day moving average | Avoid long-term downtrends for longs |
| Relative strength | Stock outperforming Nifty over 3 months | Focus on leaders |
| Volatility | Average true range between set bounds | Enough movement, manageable stops |
Most charting platforms and several Indian screening websites let you build these filters. Start with three or four; too many filters leave nothing to trade.
Step 3: Look for Setups
A scan produces candidates, not trades. Open each chart and look for a setup forming: a pullback to support or a moving average in an uptrend, a tight consolidation under resistance, or a breakout retest. Those setups are covered in Module 09.03.
Charts without a clear setup go back into the pool; don't force them onto the watchlist.
Step 4: Build a Watchlist
- Keep it short: five to fifteen names you can actually follow.
- Note the trigger: for each, write the level or event that would make it a trade.
- Set alerts: at trigger levels, so you don't need to watch constantly.
- Remove stale names: if a setup breaks or doesn't trigger within a set time, drop it.
A Weekly Routine
Example routine
Step 1: Weekend
Review Nifty and sector trends on weekly charts; run scans; build the watchlist.
Step 2: Each evening
Check alerts, update triggers, and place or adjust orders for the next day.
Step 3: During the week
Manage open positions with planned stops and targets.
Step 4: Month-end
Review the journal and refine filters only if the records justify it.
Market Context Comes First
Before running stock scans, check the broader market. When Nifty is in a clear uptrend above its rising 50-day average, long swing setups have the market's direction behind them. When Nifty is falling or choppy, even strong individual setups fail more often, and many swing traders reduce the number of positions or size.
Sector indices add a second layer. A stock in a strong sector, such as one whose sector index is also trending up, has more support than a stock moving against its sector. Checking Nifty and the main sector indices for five minutes before scanning prevents many low-quality trades.
Real Prices: From Scan to Trigger
Neha's example in this lesson follows a weekly scan to a watchlist. The chart below follows one real candidate through the same steps, ICICI Bank in August 2026: passing the scan, forming a setup, triggering, and the result.
Real prices: from scan to watchlist to trigger, ICICI Bank, August 2026
Step 1 of 4
It passes the scan
In early August 2026 ICICI Bank trades near ₹1,450–1,460, above a rising 50-day average (about ₹1,360) and its 200-day average, and stronger than NIFTY over three months: it would pass this lesson's scan filters.
- What to observe
- A candidate, not a trade.
- Condition
- No setup yet: price is extended above its averages.
Practical Example
Hypothetically, on Saturday, Neha scans the Nifty 200 for stocks above a rising 50-day average, above the 200-day average, and outperforming Nifty over three months. The scan returns 38 names.
She reviews the charts and keeps nine with clear setups: five pullbacks to support, three consolidations under resistance, and one breakout retest. For each, she notes the trigger and sets alerts. By Wednesday, two have triggered and four are still pending; she removes three whose setups broke down.
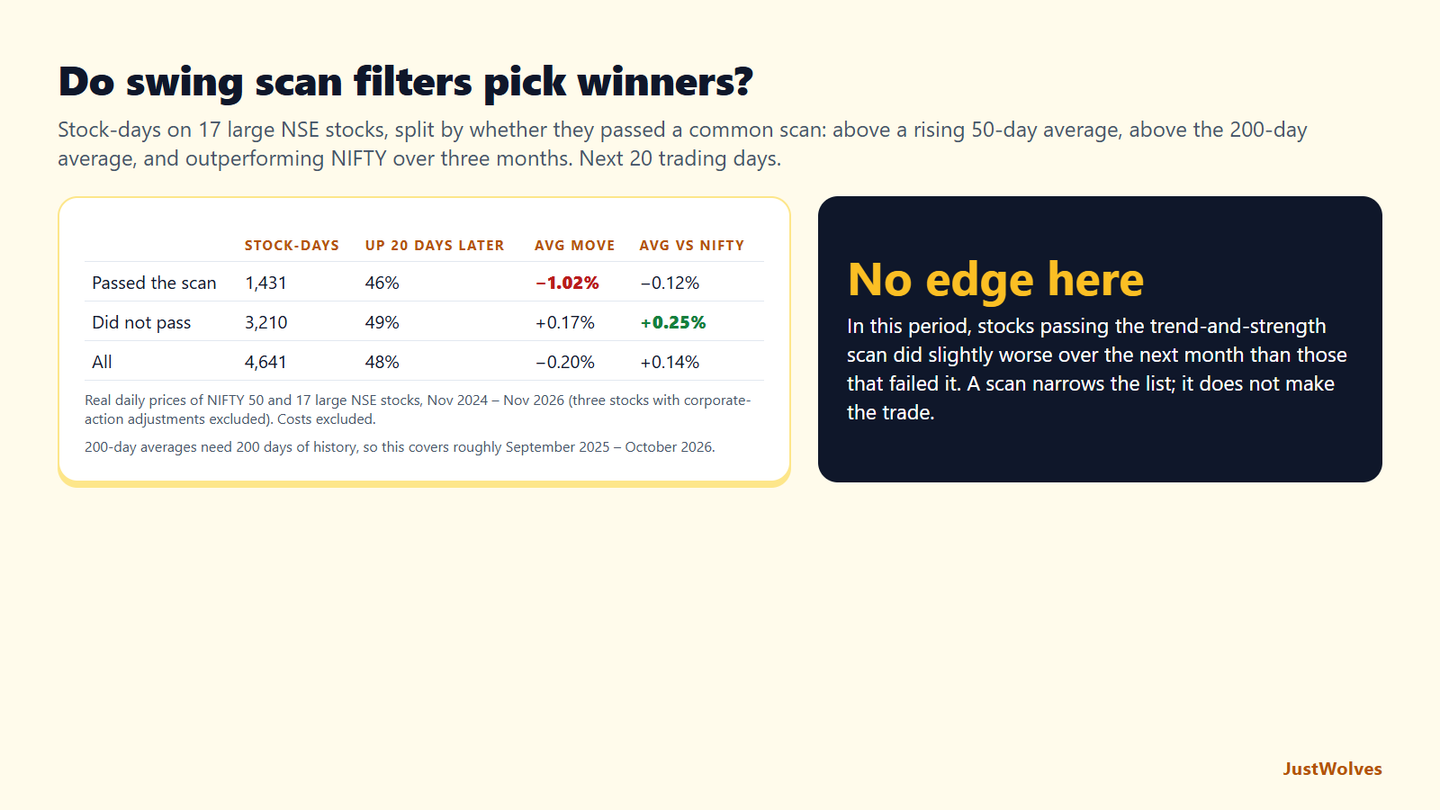
Do Scan Filters Pick Winners? Our Test
JustWolves tested this lesson's core scan on about two years of daily prices for 17 large NSE stocks (November 2024 to November 2026). The scan: price above a rising 50-day average, above the 200-day average, and outperforming NIFTY over the previous three months. On every trading day, we split the stocks into those that passed and those that did not, and measured the next 20 trading days. Because the 200-day average needs 200 days of history, the test covers roughly September 2025 to October 2026.
| Stock-days | Up 20 days later | Average move | Average vs NIFTY | |
|---|---|---|---|---|
| Passed the scan | 1,431 | 46% | −1.02% | −0.12% |
| Did not pass | 3,210 | 49% | +0.17% | +0.25% |
| All | 4,641 | 48% | −0.20% | +0.14% |
In this period, the scan did not pick winners. Stocks that passed the trend-and-strength filters did slightly worse over the next month than those that did not, both in absolute terms and against NIFTY. This window included the sharp fall of February–March 2026, when stocks that had been strongest often fell hardest, and quick recoveries that favoured laggards.
That does not make scanning useless; it confirms the point in this lesson's setups section: a scan produces candidates, not trades. Its real job is practical: to narrow a large universe to liquid stocks in a condition you know how to trade, so that your attention goes to a short list of charts. Whether a candidate becomes a trade depends on the setup, the trigger, the market context in this lesson's final section, and a stop you can accept.
Two cautions apply. With 17 stocks and one year of 200-day data, this is a small sample, and research over longer periods in many markets has found that strength often persists. Treat the result as a reason to test your own scan on your own universe before trusting it.
Common Mistakes
- Trading illiquid stocks.
- Too many filters or too many watchlist names.
- Treating scan results as buy signals.
- Ignoring sector concentration.
- Never removing stale setups.
Professional Insight
Experienced swing traders often say their edge comes more from what they choose to trade than how they enter. A disciplined scanning process that consistently brings strong, liquid stocks with clear setups to the top does much of the work before any order is placed.
Risk Considerations
- Scans reflect the past; trends can change.
- Sector concentration multiplies risk.
- Results announcements can gap a stock on the watchlist.
Important Terminology
| Term | Meaning |
|---|---|
| Universe | The set of stocks you consider trading. |
| Scan | A filter applied to a universe to find candidates. |
| Relative strength | Performance compared with an index. |
| Watchlist | A short list of stocks with setups forming. |
| Trigger | The level or event that turns a setup into a trade. |
How do I find stocks for swing trading?
Start with liquid stocks, filter for trend and relative strength, then review charts for setups forming.
Which stocks are best for swing trading in India?
Liquid stocks, often from the Nifty 100 or 200 or the F&O list, that are trending and have clear setups.
How many stocks should be on my watchlist?
Usually five to fifteen, enough to find setups but few enough to follow properly.
What is relative strength?
How a stock has performed compared with an index such as the Nifty over a period.
How often should I scan?
Many swing traders scan weekly and check their watchlist each evening.
Do stocks above their 50-day and 200-day averages perform better?
Not reliably in our data. On 17 large NSE stocks from about September 2025 to October 2026, stocks above a rising 50-day average, above the 200-day and outperforming NIFTY were up 20 days later 46% of the time, slightly less than other stocks.
What is the purpose of a stock scan for swing trading?
To narrow the universe to liquid stocks in a condition you know how to trade, so you can study a short list of charts. In our test, passing the scan did not predict the next month's move by itself; the setup, trigger and stop make the trade.
Practical Exercise
Run your first scan.
Your task
Step 1: Choose a universe
Nifty 200 or the F&O list.
Step 2: Apply three filters
Liquidity, trend and relative strength.
Step 3: Review charts
Keep only those with clear setups.
Step 4: Write triggers
And set alerts for each.
Check Your Understanding
Why start with a liquid universe?
Related Lessons
Previous: Swing Trading vs Day Trading. Next: Swing Trading Indicators and Timeframes. See also Volume Analysis.