
The Three Core Swing Setups
JustWolves is an educational platform and is not a SEBI-registered investment advisor. Trading financial instruments involves significant risk of loss and may not be suitable for all investors. Past performance is not indicative of future results. Read our full disclaimer →
What you'll learn
- Most swing trading strategies are variations of three setups: pullbacks, breakouts and reversals
- Pullbacks trade with an established trend; they're usually the most forgiving setup for beginners
- Breakouts trade the start of a new move from a base; they fail often and need volume and a clean level
- Reversals trade against the recent trend at a major level; they need the most confirmation
- Each setup has its own conditions, entry, stop and target logic; mixing them creates confused trades
In this article · 15 sections
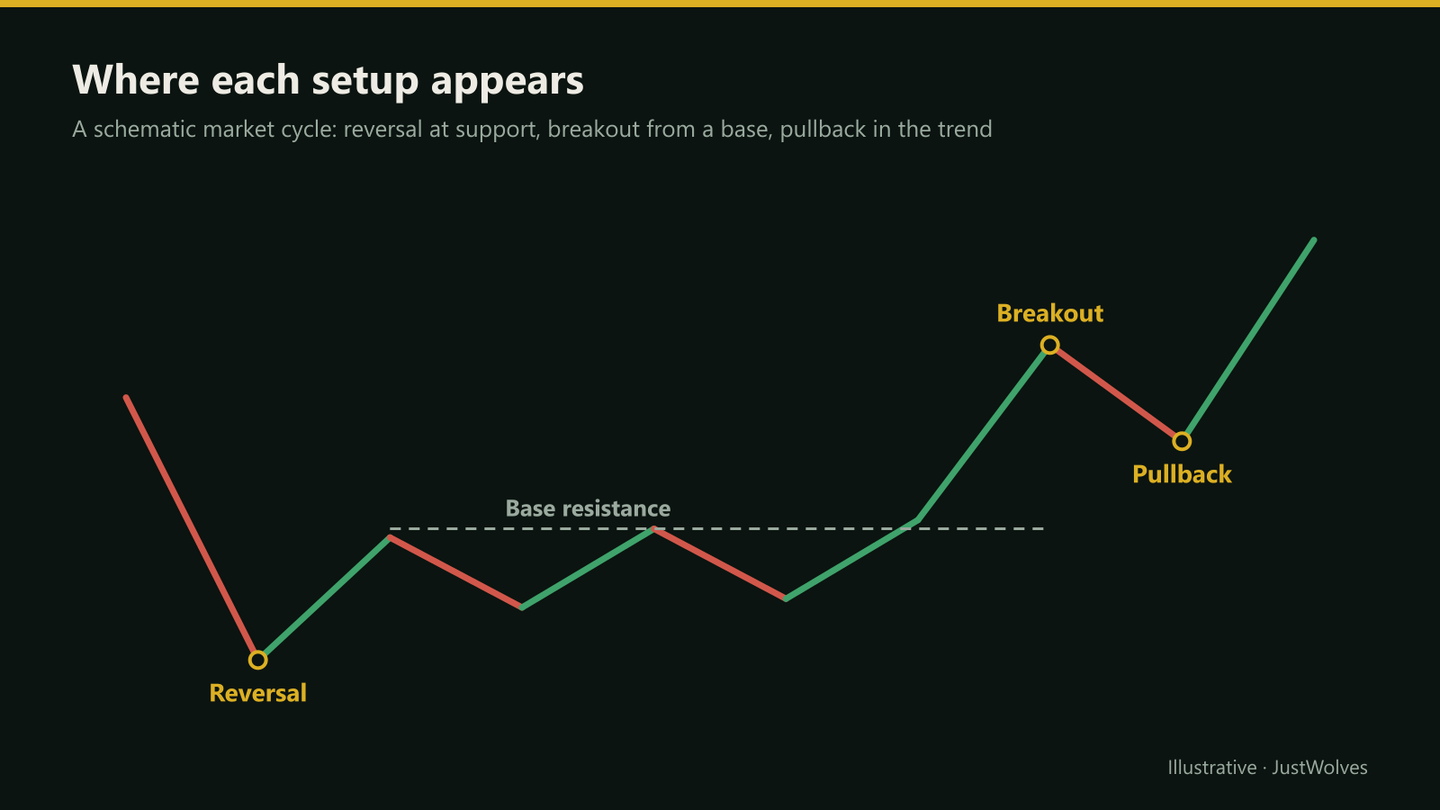
Swing trading strategies come with many names, but almost all of them reduce to three ideas: buy a pullback in a trend, buy a breakout from a base, or buy a reversal at a major level (and the mirror images for shorts). Knowing which of the three you're trading tells you what conditions to require, where the entry goes, where you're proven wrong and what a realistic target is. This lesson sets out the three setups side by side; the rest of this module goes into each.
What You Will Learn
- The three core swing setups
- The conditions each one needs
- Where entries, stops and targets usually go
- How to choose a setup for the market you're in
Before You Start
This module builds on Module 2, especially Trend Identification on Daily and Weekly Charts and Multi-Timeframe Swing Analysis.
The Three Setups at a Glance
| Pullback | Breakout | Reversal | |
|---|---|---|---|
| Market condition | Established uptrend | Tight base or range below resistance | Extended downtrend reaching major support |
| Idea | Trend resumes after a pause | New move starts from the base | Trend turns at a major level |
| Entry | Bullish trigger at support in the pullback | Close or break above the base | After a higher low or break of structure |
| Stop | Below the pullback low | Below the base or breakout candle | Below the reversal low |
| First target | Prior swing high | Measured move or next resistance | First resistance above |
| Main risk | Pullback becomes a reversal | False breakout | Downtrend resumes |
Shorts reverse each column: rallies in downtrends, breakdowns from bases below support, and reversals at major resistance.
Setup 1: The Trend Pullback
In an established uptrend, price rarely rises in a straight line. It pulls back toward support, a rising moving average or a previous breakout level, then resumes. The pullback setup waits for that pause to end and enters as the trend restarts.
Because the trend is already in place, pullbacks are often the most forgiving setup: if the entry is a little early, the trend frequently bails it out. The main danger is that a pullback grows into a reversal, so the stop goes below the pullback low or the last higher low. Pullback Continuation Setups covers this in detail.
Setup 2: The Breakout From a Base
A base is a period of sideways movement, often several weeks long, beneath a clear resistance level. When price closes above that level, especially on higher than usual volume, it may start a new upswing. The breakout setup buys that close, or a retest of the broken level.
Breakouts can produce the largest moves of the three setups, but they also fail often: price pokes above resistance and falls back into the range. Requiring a close above the level, a tight base and rising volume filters out some failures. The Breakout Trading course covers breakouts in depth.
Setup 3: The Reversal at a Major Level
After an extended decline, price may reach a major weekly support level and stop falling. The reversal setup waits for evidence that the downtrend has ended, such as a failed breakdown below support or a higher low followed by a break above the last lower high, and buys that change in structure.
Reversals offer good prices but trade against the recent trend, so they need the most confirmation. Entering on the first bullish candle at support, before structure changes, is one of the most common swing trading mistakes. Reversal Setups covers the confirmation process.
Real Prices: A Reversal With Confirmation
The reversal setup needs the most evidence. The chart below shows what that evidence looked like on real Larsen & Toubro prices in March and April 2026: an oversold fall, a final low, a higher low, and a close above the last lower high.
Real prices: a confirmed reversal after a sharp fall, Larsen & Toubro, March–April 2026
Step 1 of 4
A sharp fall to a major level
After its failed pullback in early March 2026 (see Swing Trading Indicators and Timeframes), Larsen & Toubro falls from about ₹4,420 to ₹3,439 on 13 March, with RSI at 26 and volume 3.5 times average. It bounces to ₹3,608 and falls back to ₹3,435.
- What to observe
- Oversold, but still making lower lows.
- Condition
- This lesson's warning: do not buy the first bullish candle at support.
Choosing a Setup for the Market
The market condition decides which setup is available. In a clear trend, pullbacks are the natural trade and reversals are low-probability. In a tightening base under resistance, the breakout is the setup to watch. After a long decline into major support, a reversal may be worth considering, but only with confirmation.
Many swing traders specialise in one setup, usually pullbacks, until their records show it works for them. Adding a second setup later is easier once the first is routine. Trying to trade all three from the start often leads to forcing whichever one justifies the trade you want.
Practical Example
Hypothetically, Neha reviews three stocks on a Sunday. Stock A is in a weekly and daily uptrend and has pulled back to its rising 50-day average: a pullback setup. Stock B has traded between ₹410 and ₹445 for seven weeks with shrinking ranges: a possible breakout setup above ₹445. Stock C has fallen 30% into a weekly support zone but is still making lower lows: not yet a reversal setup.
She plans an entry on Stock A with a bullish trigger, sets an alert at ₹445 on Stock B, and leaves Stock C on the watchlist until it makes a higher low and breaks its last lower high.
Which Setup Worked? Our Two-Year Test
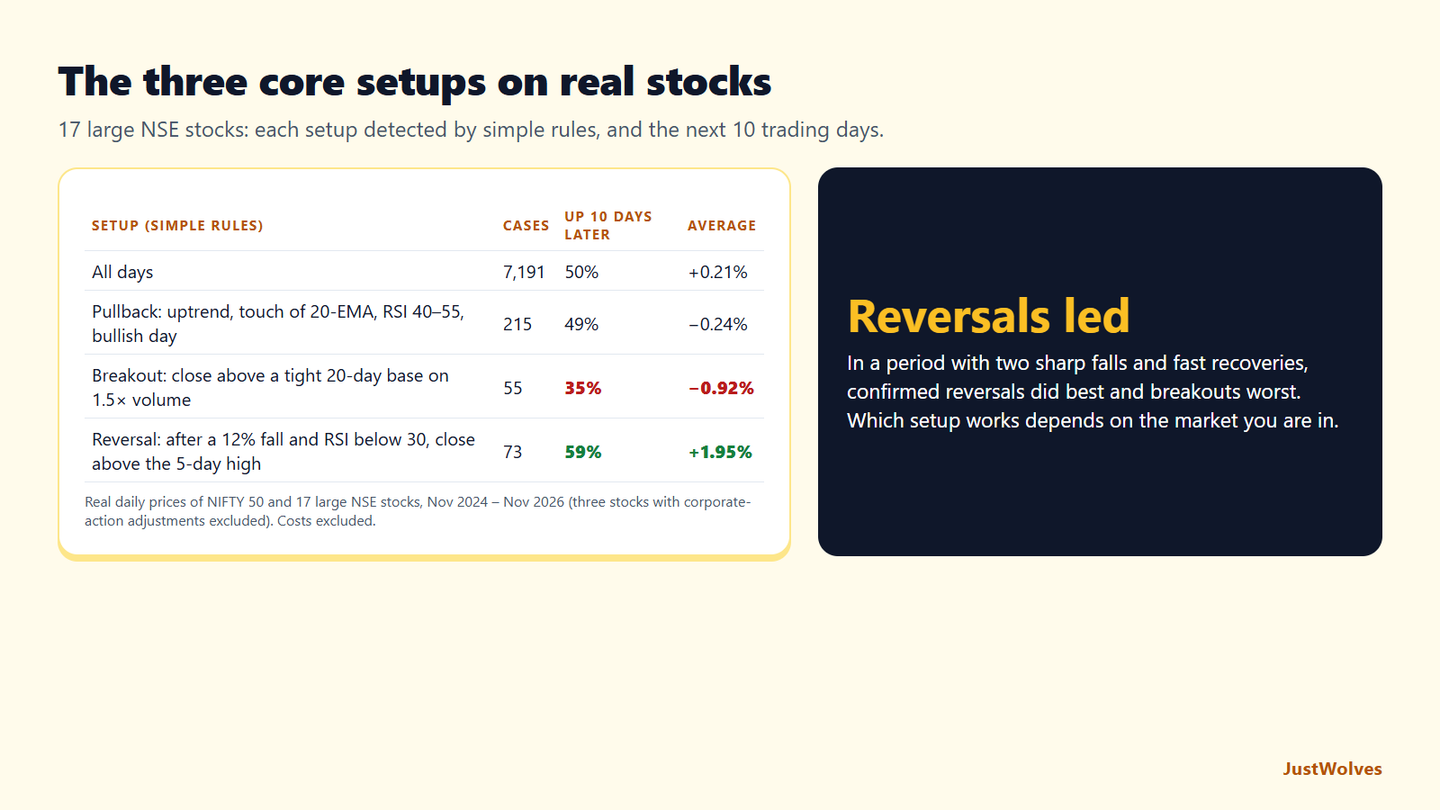
JustWolves detected each of the three setups with simple rules on about two years of daily prices for 17 large NSE stocks (November 2024 to November 2026), and measured the next 10 trading days. Pullback: price above the 200-day with a rising 50-day average, a touch of the 20-day EMA, RSI 40–55 and a bullish day. Breakout: a close above a 20-day base narrower than 8%, on at least 1.5 times average volume. Reversal: after a fall of more than 12% from the 50-day high with RSI below 30, a close above the prior five-day high. Real traders add judgement; these rules are deliberately mechanical.
| Setup | Cases | Up 10 days later | Average move |
|---|---|---|---|
| All days | 7,191 | 50% | +0.21% |
| Pullback in an uptrend | 215 | 49% | −0.24% |
| Breakout from a tight base on volume | 55 | 35% | −0.92% |
| Reversal after a 12% fall, confirmed | 73 | 59% | +1.95% |
The best setup depended on the market. In two years with two sharp falls and fast recoveries, confirmed reversals after a large drop were the strongest, up 59% of the time with an average gain of nearly 2% in 10 days. Breakouts were the weakest: 65% of them were lower 10 days later, matching this lesson's note that breakouts fail often. Mechanical pullbacks did about as well as an average day.
That is this lesson's section on choosing a setup for the market, measured. In a choppy, falling-and-recovering market, reversals with confirmation were available and worked; tight bases breaking out on volume tended to fail. In a calmer, steadily rising market, the ranking would likely change, with pullbacks easier and reversals rarer.
Two cautions apply. The reversal rule required clear confirmation, a close above the five-day high, not a guess at the bottom; buying the first bullish candle, which this lesson warns against, is a different and riskier trade. And 73 reversals and 55 breakouts are small samples. The lesson's advice to specialise in one setup and keep records stands: your own records are the real test.
Common Mistakes
- Trading reversals before structure changes.
- Buying breakouts from loose, wide ranges.
- Calling any dip a pullback, even in a downtrend.
- Mixing setup rules, such as a reversal entry with a pullback stop.
- Trading all three setups before mastering one.
Professional Insight
Experienced swing traders often describe their edge in terms of one setup traded in the right conditions, rather than a large toolkit. A trader who knows exactly what a good pullback looks like, and skips everything else, usually does better than one who trades every pattern in the book.
Risk Considerations
- Pullbacks can turn into reversals.
- Breakouts can fail and fall back into the range.
- Reversals can be early, and the downtrend can resume.
- Gaps affect all three.
Important Terminology
| Term | Meaning |
|---|---|
| Pullback | A temporary move against the trend. |
| Base | A sideways period below resistance. |
| Breakout | A close beyond a range or level. |
| Reversal | A change in trend direction. |
| Break of structure | Price breaking the last swing that defined the trend. |
What is the best swing trading strategy?
There's no single best one. Many swing traders start with trend pullbacks because they trade with the existing trend.
What are the main swing trading setups?
Pullbacks in a trend, breakouts from a base, and reversals at major levels.
Which setup is best for beginners?
Trend pullbacks are often considered the most forgiving, because the trend is already in place.
Why do breakouts fail?
Price often pokes above resistance and falls back. A close above the level, a tight base and higher volume help filter failures.
When should I trade a reversal?
After structure changes, such as a higher low and a break of the last lower high, not on the first bullish candle.
Which swing setup works best in India?
It depends on the market. In our two-year test on 17 large NSE stocks, a period with two sharp falls, confirmed reversals were up 10 days later 59% of the time, pullbacks 49% and breakouts 35%. In steadier trends, pullbacks are usually the easier setup.
Why do breakouts fail so often?
Because price often pokes above resistance and falls back into the range. In our test, breakouts from tight 20-day bases on 1.5 times average volume were lower 10 days later 65% of the time in this period. Waiting for a close above the level and a retest can filter some failures.
Practical Exercise
Classify setups on your watchlist.
Your task
Step 1: Review ten stocks
Weekly and daily charts.
Step 2: Label each
Pullback, breakout, reversal, or no setup.
Step 3: Write conditions
What must happen before each setup triggers?
Step 4: Track for two weeks
Which labels led to valid triggers?
Check Your Understanding
A pullback setup trades:
Related Lessons
Previous module: Multi-Timeframe Swing Analysis. Next: Pullback Continuation Setups. See also the Breakout Trading course.