
RSI and MACD for Swing Traders
JustWolves is an educational platform and is not a SEBI-registered investment advisor. Trading financial instruments involves significant risk of loss and may not be suitable for all investors. Past performance is not indicative of future results. Read our full disclaimer →
What you'll learn
- RSI measures the speed of recent price changes on a 0–100 scale; MACD measures the gap between two moving averages
- In uptrends, RSI tends to hold above about 40; in downtrends, below about 60
- 'Overbought' and 'oversold' readings often persist in strong trends; they aren't sell or buy signals by themselves
- Divergence between price and RSI or MACD can warn that momentum is fading
- Use one momentum indicator, not several measuring the same thing
In this article · 15 sections
RSI and MACD are the two momentum indicators swing traders use most. Both are calculated from closing prices, and both are frequently misused: selling because RSI is 'overbought' in a strong uptrend, or buying every MACD crossover in a range. This lesson explains what each actually measures, how to use them within a trend, and what divergence does and doesn't tell you.
What You Will Learn
- What RSI and MACD measure
- How RSI behaves in trends
- How to read MACD lines and histogram
- Divergence and its limits
Before You Start
Read Moving Average Swing Strategies first.
RSI
The Relative Strength Index (RSI) compares the size of recent gains with recent losses over a set period, usually 14, and plots the result from 0 to 100. Readings above 70 are traditionally called overbought, and below 30 oversold.
In practice, trends shift RSI's normal range. In uptrends, RSI often stays between about 40 and 80, with pullbacks bottoming near 40–50. In downtrends, it often stays between about 20 and 60.
| Situation | Common reading |
|---|---|
| Uptrend pullback holds RSI near 40–50 | Normal pullback; trend likely intact |
| Uptrend pullback drives RSI below 30 | Momentum has weakened more than usual |
| RSI above 70 in a strong uptrend | Strong momentum, not a sell signal on its own |
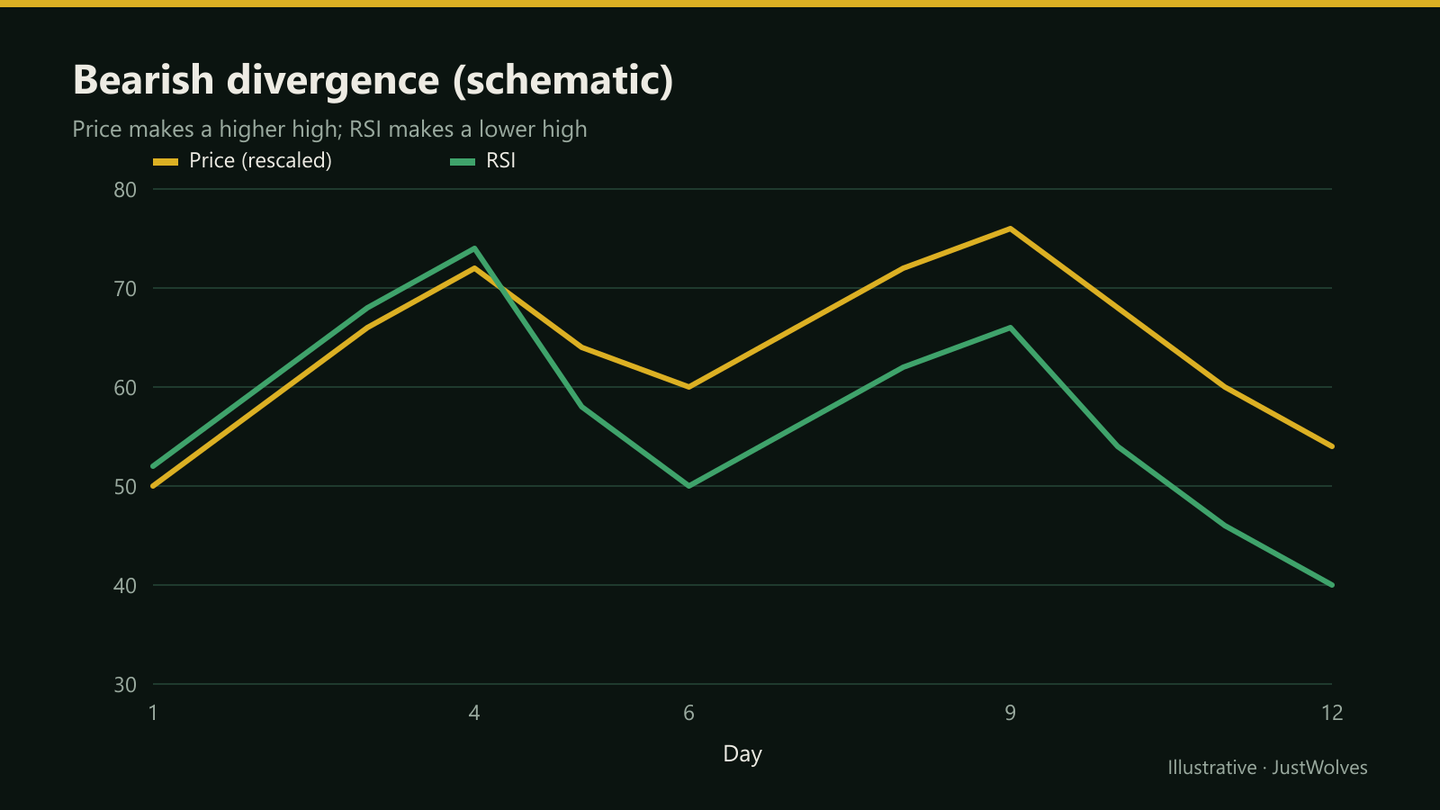
| RSI fails to make a new high while price does | Bearish divergence: momentum fading |
MACD
The MACD (moving average convergence divergence) line is the difference between a 12-period and a 26-period EMA. A signal line, a 9-period EMA of the MACD line, is plotted alongside, and the histogram shows the gap between them.
MACD above zero means the shorter average is above the longer one, an upward bias. The histogram shrinking shows momentum slowing, even if price is still rising.
Divergence
Bearish divergence: price makes a higher high while RSI or MACD makes a lower high. Bullish divergence: price makes a lower low while the indicator makes a higher low.
Divergence shows momentum fading, which is a warning, not a timing signal. Trends can show divergence for weeks before turning. Many swing traders use it to tighten stops or skip new entries, and wait for a break of structure before acting on a reversal.
Using Them in a Swing Plan
- Filter: in an uptrend, prefer pullback entries where RSI holds above about 40.
- Confirmation: a turn up in RSI or the MACD histogram as price leaves a support level.
- Warning: divergence at a resistance level after a long run.
- Pick one: RSI or MACD, not both plus Stochastic.
Real Prices: From Oversold to Overbought, Then a Divergence
The divergence diagram above is schematic. The chart below follows TCS through July and August 2026, with RSI(14) calculated from its real daily closes: an oversold reading in a downtrend, an overbought reading in a rally, and a bearish divergence at the high.
Real prices: RSI from oversold to overbought, and a divergence, TCS, July–August 2026
Step 1 of 4
"Oversold" in a downtrend
On 1 July 2026 TCS closes at ₹1,983 with RSI at 29, below a falling 50-day average near ₹2,290. By the rule in this lesson's mistakes list, buying because RSI is below 30 in a downtrend is risky; here, the stock steadied between ₹2,050 and ₹2,100.
- What to observe
- Oversold readings in downtrends can lead anywhere.
- Condition
- In our data, RSI below 30 was followed by a bounce more often than not in this period.
Momentum at Support and Resistance
Momentum readings are most useful at the price levels where you're already considering a trade. An RSI turning up from about 40 means more when price is also holding a support level, a rising moving average or the last higher low. The same reading in the middle of a range, away from any level, tells you little.
Similarly, bearish divergence carries more weight when it appears at a major resistance level or after an extended run from the last base. At those points, fading momentum combined with a known supply area gives a reason to tighten stops or take partial profit. Divergence in the middle of a young trend is more often noise.
A practical approach is to decide the level first from the price chart, then glance at RSI or MACD only to ask one question: does momentum support the trade at this level, or argue against it? If momentum argues against it, the usual responses are a smaller position, waiting for a clearer trigger, or skipping the setup. Keeping the indicator in this supporting role stops it from generating trades on its own.
Practical Example
Hypothetically, an IT stock in a weekly uptrend pulls back to support at ₹1,410 on the daily chart. RSI dips to 44 and turns up; the MACD histogram stops falling. A bullish candle closes at ₹1,428.
Ravi buys at ₹1,430 with a stop at ₹1,395. Three weeks later, price makes a new high at ₹1,540 while RSI makes a lower high than at the previous peak. He reads the divergence as fading momentum and takes most of his profit.
What Did RSI and MACD Readings Lead To? Our Test
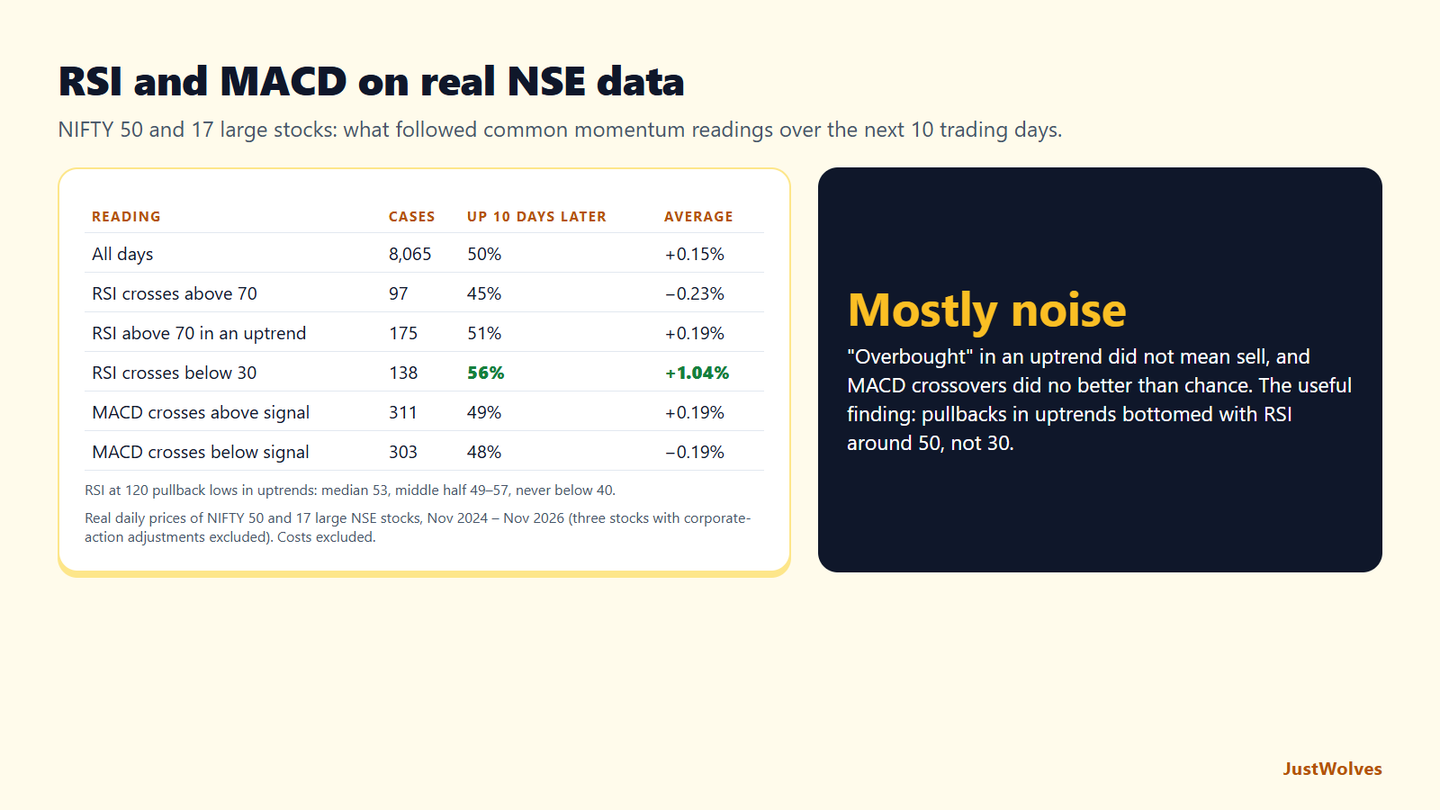
JustWolves measured what followed the most common RSI and MACD readings on about two years of daily prices for NIFTY 50 and 17 large NSE stocks (November 2024 to November 2026), over the next 10 trading days. We also recorded RSI at 120 pullback lows in uptrends, to check this lesson's description of RSI's normal range in trends.
| Reading | Cases | Up 10 days later | Average move |
|---|---|---|---|
| All days | 8,065 | 50% | +0.15% |
| RSI crosses above 70 | 97 | 45% | −0.23% |
| RSI above 70 while the 50-day is above the 200-day | 175 | 51% | +0.19% |
| RSI crosses below 30 | 138 | 56% | +1.04% |
| MACD crosses above its signal line | 311 | 49% | +0.19% |
| MACD crosses below its signal line | 303 | 48% | −0.19% |
| Measure | RSI(14) |
|---|---|
| Median | 53 |
| Middle half of cases | 49–57 |
| Share below 40 | 0% |
"Overbought" was not a sell signal in an uptrend. With the 50-day above the 200-day, RSI above 70 was followed by gains about as often as an average day. This is this lesson's first mistake, measured. "Oversold" did better than average in this period: RSI crossing below 30 was followed by a higher price 10 days later 56% of the time, because the two-year window included sharp falls followed by fast recoveries. That is a feature of this period, not a rule; in a long downtrend, oversold readings can keep coming.
MACD signal-line crossovers did no better than chance, in either direction, matching this lesson's callout that crossovers lag and whipsaw.
The most useful result confirms this lesson's RSI table. At pullback lows in uptrends, RSI was usually around 50, between 49 and 57 in the middle half of cases, and never below 40. A pullback that drives RSI below 40 is not a normal uptrend pullback; it is a warning that the trend may be changing.
Common Mistakes
- Selling because RSI is above 70 in a strong trend.
- Buying because RSI is below 30 in a downtrend.
- Trading every MACD crossover.
- Treating divergence as an entry signal.
- Stacking momentum indicators.
Professional Insight
Experienced traders tend to read RSI and MACD as descriptions of momentum within the trend they've already identified. They ask whether momentum supports the trade, not whether the indicator has 'given a signal'.
Risk Considerations
- Extreme readings persist in strong trends.
- Divergence can last for weeks.
- Crossovers whipsaw in ranges.
Important Terminology
| Term | Meaning |
|---|---|
| RSI | Relative Strength Index, a 0–100 momentum oscillator. |
| MACD | The difference between 12 and 26-period EMAs. |
| Signal line | A 9-period EMA of the MACD line. |
| Histogram | The gap between MACD and its signal line. |
| Divergence | Price and indicator moving in different directions. |
What RSI setting is best for swing trading?
The standard 14-period setting is widely used; consistency matters more than the exact value.
Should I sell when RSI is above 70?
Not on that alone; in strong uptrends RSI can stay above 70 for long periods.
What is MACD divergence?
When price makes a new high or low that MACD doesn't confirm, suggesting momentum is fading.
RSI or MACD: which is better?
Neither; both measure momentum. Pick one and use it consistently.
Is divergence a reversal signal?
It's a warning. Many traders wait for a break of structure before acting.
Where does RSI usually bottom in an uptrend pullback?
In our data on NIFTY 50 and 17 large NSE stocks, RSI(14) at pullback lows in uptrends had a median of 53, was between 49 and 57 in the middle half of cases, and never fell below 40. A drop below 40 suggests more than a normal pullback.
Do MACD crossovers work for swing trading?
Not on their own, in our test. On two years of NSE data, the 10 trading days after a MACD bullish crossover were up 49% of the time and after a bearish crossover 48%, about the same as an average day. Use MACD with trend and structure.
Practical Exercise
Study RSI in trends.
Your task
Step 1: Pick three trending stocks
Two uptrends and one downtrend.
Step 2: Record RSI at each pullback
Over one year.
Step 3: Find the range
Where did pullbacks usually bottom in RSI terms?
Step 4: Mark divergences
And note how long until the trend actually turned.
Check Your Understanding
RSI ranges from:
Related Lessons
Previous: Moving Average Swing Strategies. Next: Fibonacci Retracements and Extensions. See also Reversals, Momentum and Exhaustion.