
Swing Trading Indicators and Timeframes
JustWolves is an educational platform and is not a SEBI-registered investment advisor. Trading financial instruments involves significant risk of loss and may not be suitable for all investors. Past performance is not indicative of future results. Read our full disclaimer →
What you'll learn
- Common swing timeframes: weekly for context, daily for setups, 1-hour or 4-hour for entry timing
- A small set of indicators covers most needs: moving averages for trend, volume for participation, RSI for momentum, ATR for stops
- Each indicator should answer a different question
- Indicators support price action; they don't replace it
- Keep settings standard and consistent while testing
In this article · 16 sections
Swing trading doesn't need a crowded chart. Most swing traders work with three timeframes and a handful of indicators, each answering a specific question: what's the trend, is anyone participating, how strong is the move, and how far should the stop be? This lesson covers the timeframes and indicators that suit swing trading and how to keep them in their proper, supporting role.
What You Will Learn
- Which timeframes swing traders use and why
- A core set of indicators
- What each indicator is for
- How to avoid indicator overload
Before You Start
Read Market Selection, Scanning and Watchlists and, from the Price Action course, Dynamic Support and Resistance.
Timeframes
| Timeframe | Role |
|---|---|
| Weekly | Big-picture trend and major levels |
| Daily | Setups, stops and targets |
| 1-hour or 4-hour | Optional entry timing |
Most decisions happen on the daily chart. The weekly chart prevents trading against a major trend; the lower timeframe helps refine entries when a setup triggers. The Multi-Timeframe Analysis lesson covers the method in detail.
A Core Indicator Set
| Indicator | Common settings | Question it answers |
|---|---|---|
| Moving averages | 20 or 21 EMA; 50 SMA; 200 SMA | What's the trend, and where is dynamic support? |
| Volume (with average) | 20-day average | Is there participation behind the move? |
| RSI | 14 | How strong is momentum? Is a pullback stretched? |
| ATR | 14 | How volatile is the stock, and how wide should the stop be? |
Using the Indicators Together
- Trend first: for longs, price above a rising 50-day average and above the 200-day.
- Location: a pullback to the 20 or 50-day average, ideally near a horizontal support level.
- Momentum: RSI pulling back toward 40–50 in an uptrend, rather than collapsing below 30, suggests a normal pullback.
- Participation: lighter volume on the pullback and higher volume on the bounce.
- Risk: a stop beyond the pullback low, at least 1–1.5 × ATR from entry.
Avoiding Overload
Adding more indicators rarely adds information. RSI, Stochastic and MACD all measure momentum from closing prices; using all three tells you the same thing three times.
Choose standard settings and keep them while testing. Tuning settings until past charts look perfect usually produces rules that fail on new data.
Moving Average Choices
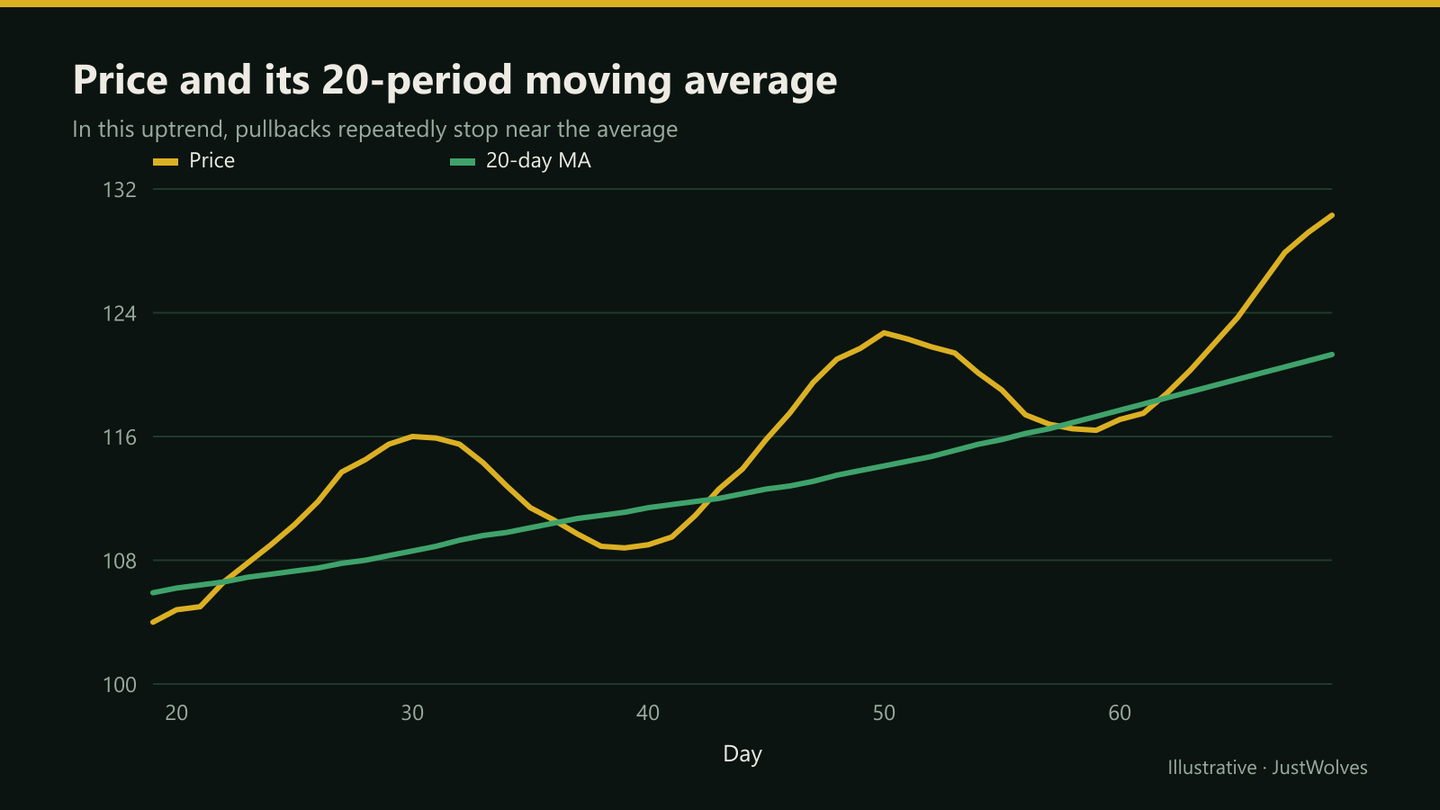
The 20 or 21-period EMA reacts quickly and tends to hold pullbacks in strong trends. The 50-day SMA is slower and tends to hold pullbacks in steadier trends. The 200-day SMA defines the long-term trend; many swing traders only take longs when price is above it.
When price respects the 20 EMA on pullbacks, the trend is usually strong; when pullbacks start reaching the 50-day average instead, momentum is easing. When price closes below the 50-day and the average flattens, many swing traders stop looking for longs in that stock.
ATR for Stops and Sizing
ATR tells you how much a stock typically moves in a day. A stop placed closer than about one ATR from entry is likely to be hit by normal daily noise. Placing it beyond the swing low, and checking that it's at least 1 to 1.5 ATR away, keeps it outside that noise.
ATR also helps compare stocks. A stock with an ATR of ₹40 needs a wider stop than one with ₹10, so the position must be smaller to keep the rupee risk the same. Swing Position Sizing and Portfolio Heat, later in this course, covers that calculation.
Real Prices: The Setup Failed, the ATR Stop Worked
Vikram's example in this lesson is a pullback that works. The chart below shows the same checklist, trend, location, momentum and an ATR-based stop, on real Larsen & Toubro prices from February and March 2026, when the setup failed and the stop decided the outcome.
Real prices: a textbook pullback that failed, and an ATR stop that worked, Larsen & Toubro, 2026
Step 1 of 4
A strong uptrend
In February 2026 Larsen & Toubro rises from about ₹4,190 to ₹4,418, well above its rising 20-day EMA and 50-day average, with RSI reaching 76. Every check in this lesson's "using the indicators together" list says uptrend.
- What to observe
- Trend, location and momentum all line up.
- Condition
- The setup is waiting for a pullback.
Practical Example
Hypothetically, a stock's weekly chart is in an uptrend. On the daily chart, price has pulled back to its rising 50-day average at ₹860, near a prior breakout level, with RSI at 44 and volume below average during the pullback. ATR is ₹18.
Vikram buys at ₹868 after a bullish daily candle, with a stop at ₹842 (below the pullback low and about 1.4 × ATR from entry) and a target at the prior high of ₹930: ₹26 of risk for ₹62 of potential reward.
Do the Indicators Add an Edge? Our Test
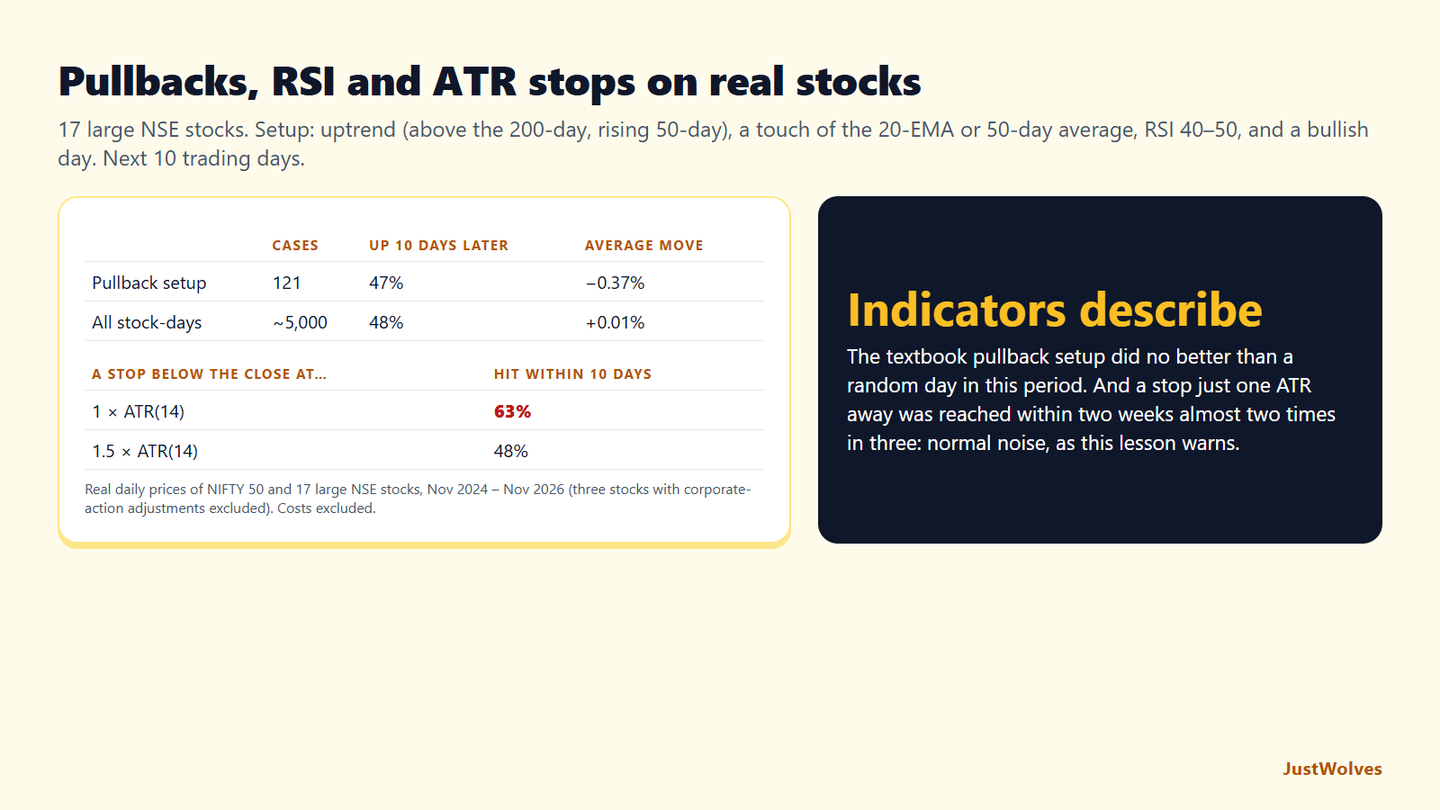
JustWolves tested this lesson's combined checklist on about two years of daily prices for 17 large NSE stocks (November 2024 to November 2026). The setup: price above the 200-day average with a rising 50-day average, a touch of the 20-day EMA or 50-day average, RSI between 40 and 50, and a bullish day. We compared the next 10 trading days with all other stock-days, and measured how often stops placed one and one-and-a-half ATRs below the close were reached within 10 days.
| Cases | Up 10 days later | Average move | |
|---|---|---|---|
| Pullback setup (all conditions met) | 121 | 47% | −0.37% |
| All stock-days | about 5,000 | 48% | +0.01% |
| Stop distance below the close | Reached |
|---|---|
| 1 × ATR(14) | 63% |
| 1.5 × ATR(14) | 48% |
The indicator checklist did not produce an edge in this period. Pullbacks meeting every condition were up 10 days later 47% of the time, no better than a random day. That matches this lesson's warning that indicators describe conditions and do not predict, and the result of similar tests in the Price Action course on this site.
ATR mattered for a different reason. A stop just one ATR below the close was reached within two weeks almost two times in three; at 1.5 ATR, about half the time. That is the arithmetic behind this lesson's advice to keep stops at least 1 to 1.5 ATR away: closer stops are mostly hit by ordinary movement. It also shows the cost of wider stops: with half of 1.5-ATR stops still reached, position size has to come down as the stop widens, which the Swing Position Sizing lesson covers.
The practical conclusion is this lesson's own: keep a bare chart, use indicators to decide what is worth looking at, and rely on the stop and the size, not the signal, to manage risk.
Common Mistakes
- Too many indicators answering the same question.
- Trading indicator signals without price context.
- Ignoring the weekly chart.
- Constantly changing settings.
- Using RSI 'overbought' readings to short strong uptrends.
Professional Insight
Many experienced swing traders use a nearly bare chart: price, two or three moving averages and volume, with ATR for sizing. They find that simplicity makes decisions faster and more consistent, which matters more than any extra signal.
Risk Considerations
- Lagging signals arrive after moves begin.
- Moving averages whipsaw in ranges.
- Overfitted settings fail on new data.
Important Terminology
| Term | Meaning |
|---|---|
| EMA / SMA | Exponential and simple moving averages. |
| RSI | Relative Strength Index, a momentum oscillator from 0 to 100. |
| ATR | Average True Range, a measure of volatility. |
| Volume average | A moving average of volume used as a baseline. |
| Timeframe | The period each candle represents. |
What are the best indicators for swing trading?
A small set: moving averages for trend, volume for participation, RSI for momentum and ATR for stops.
Which timeframe is best for swing trading?
The daily chart for setups, with the weekly for context and optionally the 1-hour or 4-hour for entries.
Which moving averages do swing traders use?
Commonly the 20 or 21 EMA, the 50-day SMA and the 200-day SMA.
Should I use many indicators?
No. Several indicators measuring the same thing add noise, not information.
Do indicators predict price?
No. They're calculated from past data and describe current conditions.
Does an RSI pullback strategy work on Indian stocks?
Not by itself, in our test. On 17 large NSE stocks, uptrend pullbacks to the 20-EMA or 50-day average with RSI between 40 and 50 and a bullish day were up 10 trading days later 47% of the time, about the same as an average day.
How far should a swing stop be in ATR terms?
At least about 1 to 1.5 ATR. In our NSE stock data, a stop one ATR below the close was reached within 10 trading days 63% of the time, and 1.5 ATR about 48% of the time. Wider stops need smaller positions to keep the rupee risk the same.
Practical Exercise
Set up a clean chart.
Your task
Step 1: Add indicators
20 EMA, 50 SMA, 200 SMA, volume with a 20-day average, RSI 14, ATR 14.
Step 2: Review ten stocks
From your watchlist.
Step 3: Answer four questions
Trend, location, momentum, volatility, for each.
Step 4: Remove anything unused
After a week, drop indicators you never consulted.
Check Your Understanding
The main timeframe for swing setups is usually:
Related Lessons
Previous: Market Selection, Scanning and Watchlists. Next module: Trend Identification on Daily and Weekly Charts. See also Best Indicators for Price Action Traders.