
Multi-Timeframe Swing Analysis
JustWolves is an educational platform and is not a SEBI-registered investment advisor. Trading financial instruments involves significant risk of loss and may not be suitable for all investors. Past performance is not indicative of future results. Read our full disclaimer →
What you'll learn
- Top-down analysis uses a higher timeframe for direction, a middle one for setups and a lower one for timing
- For swing traders, a common set is weekly, daily and 60-minute or 4-hour
- The higher timeframe overrides the lower: a daily buy signal against a weekly downtrend is lower quality
- Lower timeframes can tighten entries and stops, but the stop must still respect the daily structure
- A fixed order and fixed questions stop timeframe-hopping to justify trades
In this article · 14 sections
A swing trade sits inside a larger trend and is made of smaller moves. Looking at only one chart misses one of those layers: the daily setup that looks perfect may be running into weekly resistance, or a good weekly trend may offer a poor daily entry. Multi-timeframe analysis puts the layers in a fixed order so each one answers a different question. This lesson builds that process and the rules for when the timeframes disagree.
What You Will Learn
- The three-timeframe framework for swing trading
- Which question each timeframe answers
- How to use a lower timeframe for entries
- How to handle conflicts between timeframes
Before You Start
Read Trend Identification on Daily and Weekly Charts and Fibonacci Retracements and Extensions. The Price Action course covers the general idea in Multi-Timeframe (Top-Down) Analysis for Price Action Traders.
Three Timeframes, Three Questions
| Timeframe | Role | Question it answers |
|---|---|---|
| Weekly | Direction | Which way is the main trend, and where are the major levels? |
| Daily | Setup | Is there a pullback, base or breakout at a meaningful level? |
| 60-minute or 4-hour | Timing | Has the pullback actually turned, and where is a tighter entry? |
A common guideline is that each timeframe should be roughly four to six times the next one down. Weekly, daily and 60-minute fit that loosely; some swing traders use monthly, weekly and daily instead for longer holds.
The point is that each chart has a single job. You don't look for entries on the weekly, or for trend direction on the 60-minute.
Top-down sequence
Step 1: Weekly
Write the trend and the nearest major levels.
Step 2: Daily
Look for a setup at a meaningful level, in the weekly direction.
Step 3: 60-minute or 4-hour
Wait for the pullback to turn, and find the entry.
Step 4: Back to the daily
Check that the stop sits beyond the daily structure and the target stops short of weekly levels.
Using the Lower Timeframe for Entries
Once the daily chart shows a pullback to support in a weekly uptrend, the 60-minute chart can show when selling has stopped: a series of lower highs that breaks, a higher low forming, or a break above a small intraday range. Entering on that turn, rather than at the daily close, can improve the entry price.
The risk is false precision. A tight stop under a 60-minute swing may sit well inside the daily range, where normal noise can trigger it. Many traders use the lower timeframe for the entry but keep the stop beyond the daily structure, or reduce position size if they want to use a tighter stop.
Real Prices: Timing a Daily Setup on the 60-Minute Chart
The bank-stock example in this lesson waits for the 60-minute chart to stop making lower highs, then places the stop beyond the daily structure. The chart below shows the same process on real NIFTY 50 hourly prices from 10 to 15 June 2026.
Real NIFTY 60-minute prices: timing a daily-chart idea, 10–15 June 2026 (IST)
Step 1 of 4
The daily idea
On the daily chart, NIFTY has pulled back in early June 2026 to about 23,070, where it held on 8 June. On Thursday 11 June it dips to 23,072 again in the first hour: a daily support test, the kind of setup this lesson's daily chart is for.
- What to observe
- Daily chart: the setup. Not yet the entry.
- Condition
- The 60-minute chart is still making lower highs.
When Timeframes Disagree
| Situation | Common response |
|---|---|
| Weekly up, daily setup long | Trade normally |
| Weekly up, daily setup long, but weekly resistance just overhead | Smaller size or wait for the breakout |
| Weekly down, daily setup long | Skip, or treat as a short-term trade with smaller size and nearer targets |
| Weekly range, daily setup at range edge | Trade toward the opposite edge only |
| Daily setup good, 60-minute still falling | Wait for the lower timeframe to turn |
The general principle: the higher timeframe has priority. A lower-timeframe signal can delay or refine a trade, but it shouldn't override the higher timeframe's direction.
Avoiding Timeframe-Hopping
A common failure is flicking between charts until one agrees with the trade you already want. If the daily looks weak, the 4-hour looks strong; if the weekly is down, the monthly is up. Every trade can be justified this way.
The fix is procedural: decide your three timeframes in advance, always analyse them in the same order, and write the answer to each question before moving to the next chart. If the weekly answer is 'down', a long setup on the daily is already marked as lower quality before you see it.
Practical Example
Hypothetically, a bank stock is in a weekly uptrend, with the nearest weekly resistance at ₹960. On the daily chart, it has pulled back to a former breakout level at ₹880, near the 50% retracement of its last swing. Arjun marks it as a valid setup.
On the 60-minute chart, price is still making lower highs. He waits. Two sessions later, the 60-minute chart breaks above its last lower high at ₹889. He buys at ₹890. His stop goes below the daily pullback low at ₹871, not under the smaller 60-minute swing at ₹882, risking ₹19 a share. His target is ₹950, just below weekly resistance, about 3.2R.
Where Should a Swing Stop Go? Our Test
This lesson's callout warns that a stop under a 60-minute swing often sits inside normal daily movement. JustWolves measured that on six months of real NIFTY 50 hourly prices (May to November 2026). At the close of each of 119 trading days, we placed two hypothetical stops below the close: one under the lowest low of the last three 60-minute candles, and one under the lowest low of the last two daily candles. We then checked whether each was reached within the next five trading days.
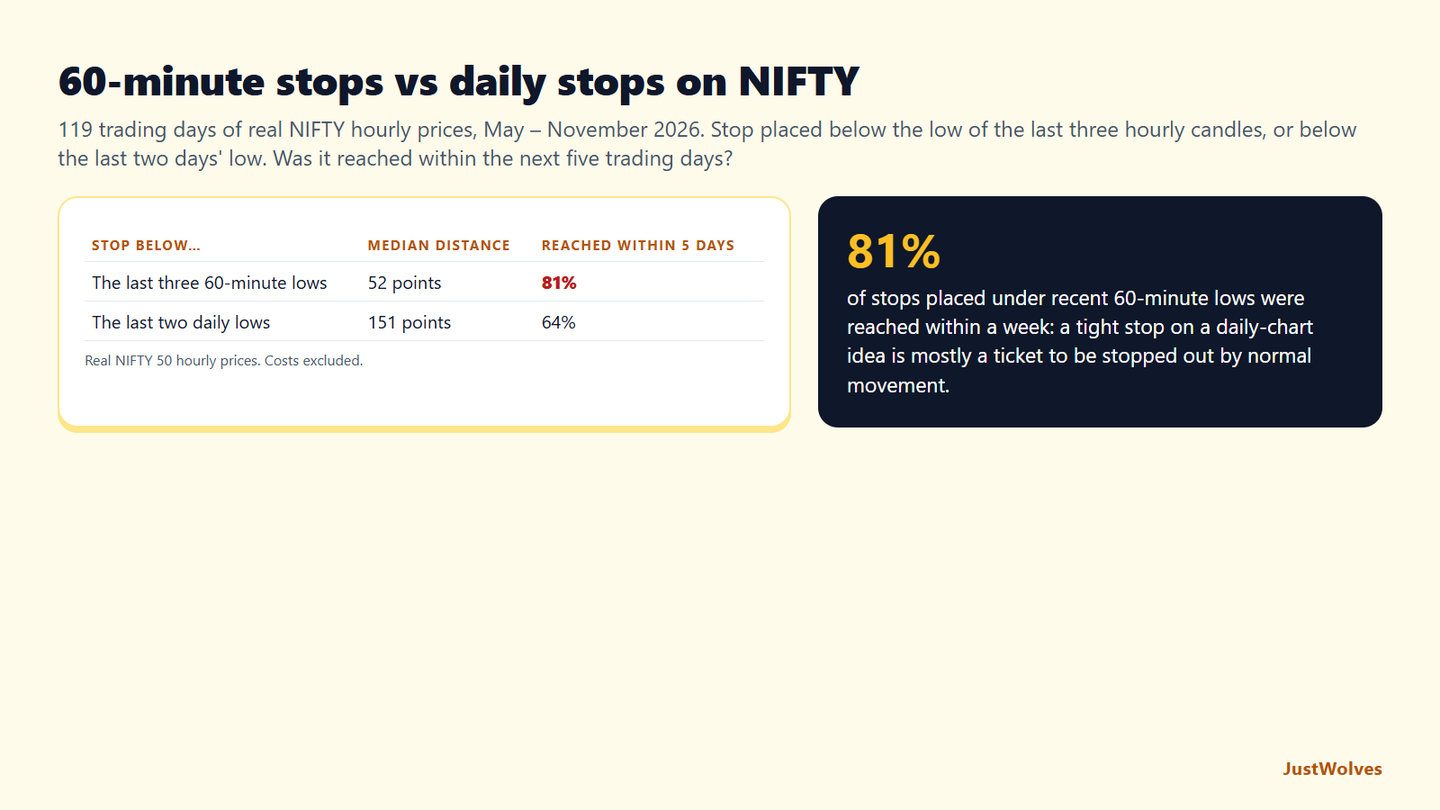
| Stop placed below… | Median distance from the close | Reached within 5 trading days |
|---|---|---|
| The lowest of the last three 60-minute candles | 52 points | 81% |
| The lowest of the last two daily candles | 151 points | 64% |
A stop under recent 60-minute lows was reached within a week in four cases out of five. At a median of about 52 points, it sat well inside NIFTY's normal daily range of roughly 150–200 points. That is the false precision this lesson describes: a tighter stop allows a larger position for the same rupee risk, but it is touched so often that the trade usually ends before the daily-chart idea has had a chance to work.
A stop below the daily structure was reached less often but still often, 64% of the time within five days at about 151 points. Even daily-chart stops need room, which is why the swing position-sizing lesson starts from the stop distance and sizes the position down to fit, rather than the other way round.
The practical rule from this lesson holds: use the 60-minute chart to decide when to enter, and the daily chart to decide where you are wrong. If the only stop that makes the trade worth taking is a 60-minute stop, it is really an intraday trade.
Common Mistakes
- Changing timeframes to find agreement.
- Lower-timeframe stops on daily-chart trades.
- Ignoring weekly levels when setting targets.
- Using too many timeframes, producing conflicting signals.
- Letting a 60-minute signal override the weekly trend.
Professional Insight
Many experienced swing traders do most of their multi-timeframe work at the weekend: the weekly chart sets the direction and levels for the week ahead, so weekday analysis is limited to the daily setup and, if they use one, a lower-timeframe trigger. Keeping the higher-timeframe decision separate from live price action makes it far less likely to change under pressure.
Risk Considerations
- Tighter entries can mean tighter, more fragile stops.
- More charts mean more conflicting signals.
- Higher-timeframe levels can stop a good daily setup short of its target.
Important Terminology
| Term | Meaning |
|---|---|
| Top-down analysis | Analysing from the highest timeframe to the lowest. |
| Higher timeframe | The chart that sets direction, such as the weekly. |
| Setup timeframe | The chart where the trade idea forms, usually the daily. |
| Trigger timeframe | A lower chart used to time the entry. |
| Timeframe-hopping | Switching charts to justify a desired trade. |
What timeframes should swing traders use?
A common set is weekly for direction, daily for setups and 60-minute or 4-hour for entry timing.
What if the weekly and daily charts disagree?
The higher timeframe usually takes priority. Many traders skip setups against the weekly trend or trade them smaller with nearer targets.
Should I use the 60-minute chart for my stop?
Usually the stop should respect the daily structure, because the trade is a daily-chart idea.
How many timeframes should I use?
Three is common. More often adds conflicting signals without adding clarity.
What is timeframe-hopping?
Switching charts until one supports the trade you want, which undermines objective analysis.
How often is a 60-minute stop hit on a swing trade?
Very often. In our six months of NIFTY hourly data, a stop under the lowest of the last three 60-minute candles, about 52 points away on average, was reached within five trading days 81% of the time.
Should I use a 60-minute chart for entries in swing trading?
For timing, yes: waiting for the 60-minute chart to stop making lower highs can improve the entry. But keep the stop beyond the daily-chart structure and size the position to that stop, because tighter 60-minute stops are usually reached by ordinary movement.
Practical Exercise
Run a top-down review.
Your task
Step 1: Pick three stocks
From your current watchlist.
Step 2: Weekly
Write the trend and the nearest major levels.
Step 3: Daily
Note any setup at a meaningful level.
Step 4: Lower timeframe
Note whether the pullback has turned, and where a stop beyond the daily structure would go.
Check Your Understanding
In top-down swing analysis, the weekly chart is mainly for:
Related Lessons
Previous: Fibonacci Retracements and Extensions. Next module: The Three Core Swing Setups. See also Multi-Timeframe (Top-Down) Analysis for Price Action Traders.