
Swing Position Sizing and Portfolio Heat
JustWolves is an educational platform and is not a SEBI-registered investment advisor. Trading financial instruments involves significant risk of loss and may not be suitable for all investors. Past performance is not indicative of future results. Read our full disclaimer →
What you'll learn
- Risk a fixed small fraction of the account per trade, commonly 0.5–1%
- Shares = rupee risk ÷ (entry − stop); the stop decides the size
- Cap each position's value too, because gaps can exceed the stop
- Portfolio heat is the total open risk; many swing traders cap it around 4–6%
- Correlated positions count as one larger bet
In this article · 14 sections
A swing trader usually holds several positions at once, for days or weeks. That makes sizing a two-level problem: how much to risk on each trade, and how much to have at risk across all of them. Getting the first right but ignoring the second is how traders with sensible per-trade rules still suffer large drawdowns. This lesson covers both levels, with worked examples in rupees.
What You Will Learn
- Fixed-fractional risk per trade
- The position size formula
- Position value caps
- Portfolio heat and correlation
Before You Start
Read Overnight and Gap Risk and Stop Placement for Swing Trades. Position Sizing and the 1% Rule covers sizing in general, and Portfolio Exposure and Correlation Risk covers correlation.
Level 1: Risk Per Trade
Fixed-fractional sizing risks the same percentage of the account on each trade, commonly 0.5% to 1% for swing traders. On a ₹5,00,000 account, 1% is ₹5,000. If a trade hits its stop, the loss is about ₹5,000, plus costs and any slippage.
The formula: shares = rupee risk ÷ (entry − stop). With an entry of ₹820 and a stop of ₹790, risk per share is ₹30, so 1% risk allows 166 shares.
| Entry | Stop | Risk per share | Shares | Position value |
|---|---|---|---|---|
| ₹820 | ₹790 | ₹30 | 166 | ₹1,36,120 |
| ₹820 | ₹805 | ₹15 | 333 | ₹2,73,060 |
| ₹820 | ₹760 | ₹60 | 83 | ₹68,060 |
A tight stop creates a large position. That's where the second check is needed.
Position Value Caps
Because gaps can skip stops, many swing traders also cap each position's value at a share of the account, often 10–25%. With a 20% cap on ₹5,00,000, no position exceeds ₹1,00,000.
In the table above, the first trade at 166 shares (₹1,36,120) exceeds the cap, so the position is cut to 121 shares (₹99,220), and the rupee risk falls to about ₹3,630. The tight-stop trade is cut even further. The cap means some trades risk less than the full 1%, which is the point: it limits the damage from a gap.
Level 2: Portfolio Heat
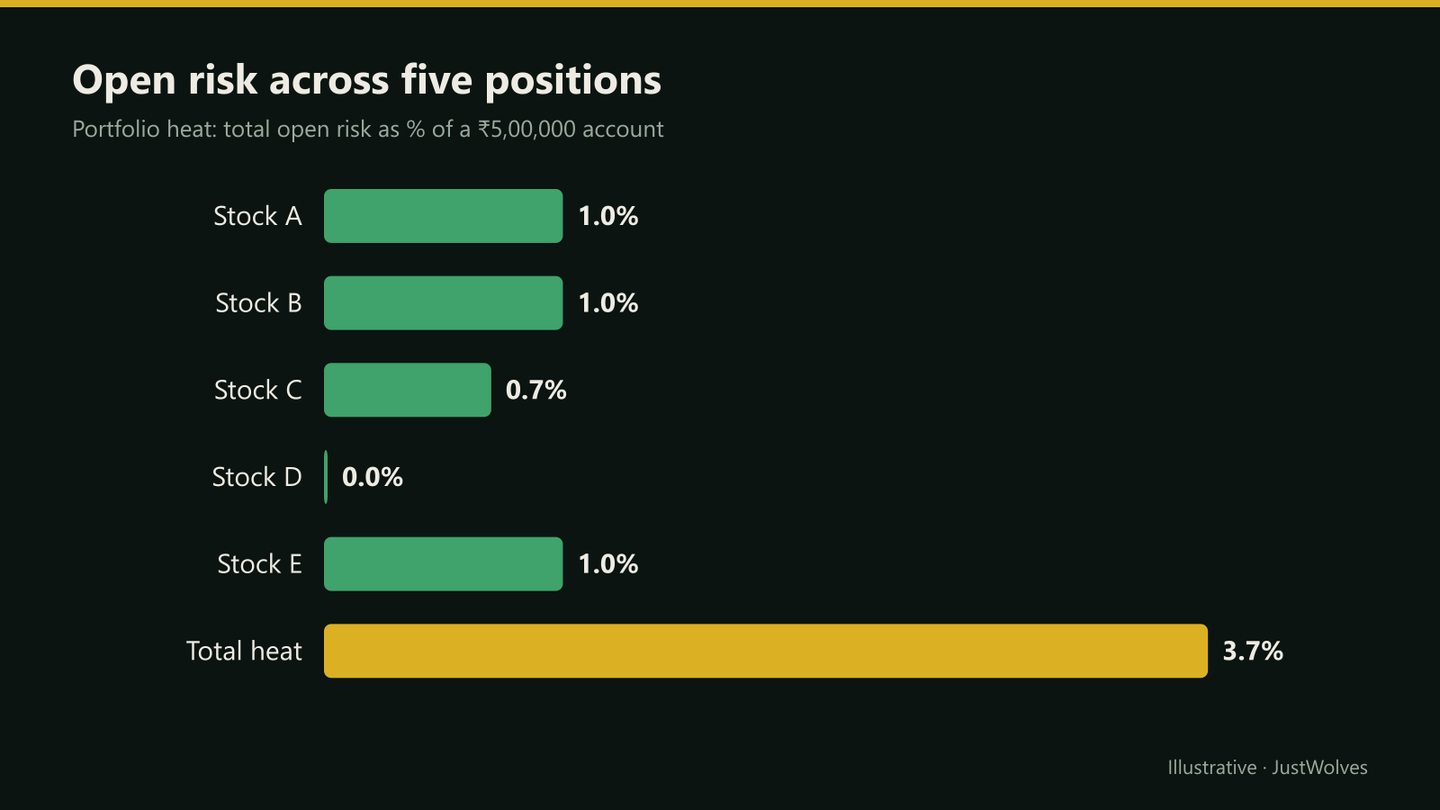
Portfolio heat is the total amount you would lose if every open position hit its stop at once, expressed as a percentage of the account. Five positions each risking 1% means 5% heat.
Many swing traders cap heat at around 4–6%. When heat is at the cap, no new trades are added until existing positions are closed or their stops move up to reduce open risk. A position whose stop has moved to breakeven contributes no heat (apart from gap risk).
Real Prices: The Morning Many Stops Hit Together
Portfolio heat matters on the days when several positions fail at once. The chart below shows one of them in real NIFTY 50 prices, 13 June 2025, with the number of simulated swing positions in our study that were stopped out that morning.
Real NIFTY prices: the morning many swing stops hit together, June 2025
Step 1 of 4
Setups everywhere
In late May and early June 2025 NIFTY holds near 24,500–25,000 and then rallies to 25,100. Across our 17 stocks, pullback signals trigger in banks, telecom and consumer names: on paper, several separate trades.
- What to observe
- Each one sized at 1% looks small.
- Condition
- Together they are one bet on the market not falling.
Correlation
Five stocks from the same sector tend to move together, especially on sector news. If all five fall together, it behaves like one position at five times the risk. A simple rule: count positions in the same sector as a group and cap the group's total risk, for example at 2%.
The broader market also matters. In a sharp market-wide fall, most long positions drop together. That's one reason heat caps exist: in a bad week, many stops can trigger at once.
Practical Example
Hypothetically, Anil has ₹5,00,000, risks 1% per trade, caps each position at 20% of capital, caps heat at 5% and caps any one sector at 2% risk.
He holds two bank stocks at 1% risk each and one IT stock at 1%. Heat is 3%. A third bank stock sets up well, but it would take the banking group to 3%, so he skips it. Instead, he takes a pharma setup at 1%, bringing heat to 4%. When one bank position reaches its first target and the stop moves to breakeven, heat falls to 3%, leaving room for new trades.
Does a Heat Cap Help? Our Simulation
JustWolves ran the 379 pullback trades used in this module through a simple portfolio, on about two years of daily prices for 17 large NSE stocks (November 2024 to November 2026). Rules: a ₹5,00,000 start, 1% risk per trade from the stop, positions capped at 20% of the account, and new trades skipped whenever total open risk would exceed the heat cap. We ran it with heat caps of 3%, 5% and 10%, and with no cap. The setup itself had no edge in this period, which makes it a fair test of what sizing can and cannot do.
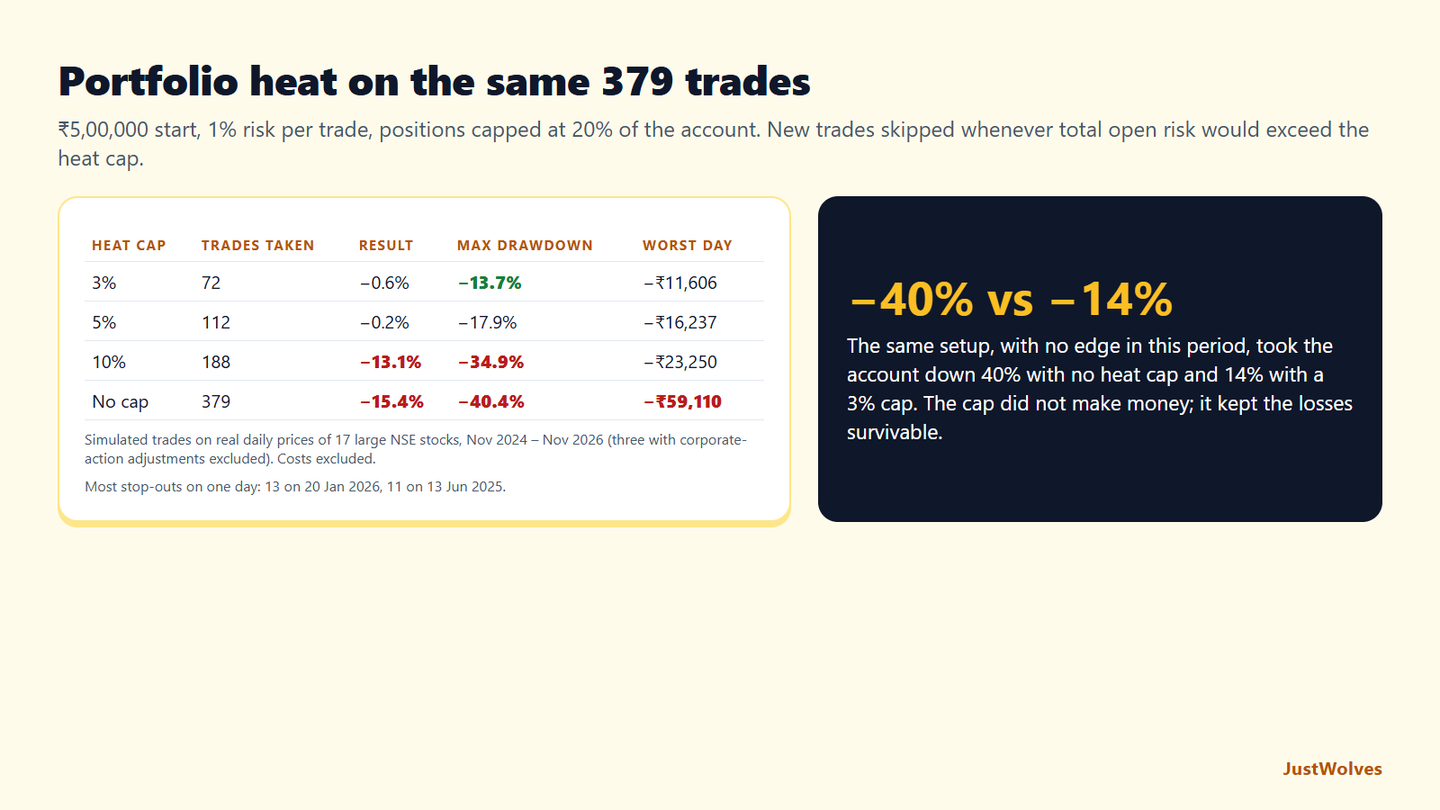
| Heat cap | Trades taken | Result | Maximum drawdown | Worst single day |
|---|---|---|---|---|
| 3% | 72 | −0.6% | −13.7% | −₹11,606 |
| 5% | 112 | −0.2% | −17.9% | −₹16,237 |
| 10% | 188 | −13.1% | −34.9% | −₹23,250 |
| No cap | 379 | −15.4% | −40.4% | −₹59,110 |
The heat cap could not make a setup with no edge profitable, but it decided how much it cost. With no cap, taking every signal led to a 40% drawdown and a worst single day of about ₹59,000. With a 5% cap, the same setup ended roughly flat with an 18% drawdown, and with 3% about 14%. That is this lesson's professional insight in numbers: per-trade risk keeps individual losses small; the heat cap protects you in the weeks when everything goes wrong together.
Losses clustered. On 20 January 2026, 13 of the simulated positions were stopped out on the same day; on 13 June 2025, 11, as in the chart above. Positions in different stocks behaved like one position on those days, which is this lesson's correlation section, measured.
The caps also skipped trades: with a 5% cap, about 70% of signals were not taken because heat was full. That is the trade-off. A tighter cap means fewer trades and smaller drawdowns; if your setup has a real edge, the cap also limits how much you can earn, which is why the right level depends on your own tested results.
Common Mistakes
- Sizing by conviction instead of by the stop.
- No position value cap, so tight stops create huge positions.
- Ignoring total heat across open trades.
- Several positions in one sector counted as separate bets.
- Increasing risk after losses to 'win it back'.
Professional Insight
Experienced swing traders often say the heat cap is what protects them in the weeks they get wrong, which tend to be the weeks the whole market turns. Per-trade risk keeps individual losses small; the heat cap keeps a cluster of losses from becoming a drawdown that takes months to recover.
Risk Considerations
- Gaps can make actual losses exceed planned risk.
- Correlation rises in market sell-offs.
- Costs reduce the effective size of each win and add to each loss.
Important Terminology
| Term | Meaning |
|---|---|
| Fixed-fractional sizing | Risking a fixed percentage of the account per trade. |
| Risk per share | Entry price minus stop price. |
| Position value cap | A maximum value for any one position. |
| Portfolio heat | Total open risk across all positions. |
| Sector cap | A limit on combined risk in one sector. |
How much should I risk per swing trade?
Commonly 0.5% to 1% of the account. Many beginners start at the lower end.
How do I calculate position size?
Divide your rupee risk by the distance between entry and stop. ₹5,000 ÷ ₹30 = 166 shares.
What is portfolio heat?
The total amount you'd lose if every open position hit its stop, as a percentage of the account.
How many swing trades should I hold at once?
It depends on your heat cap. With 1% risk each and a 5% cap, up to five full-risk positions.
Why cap position value as well as risk?
Because gaps can skip stops; a value cap limits the damage from a large gap.
What heat cap should a swing trader use?
Many use 4–6% of the account. In our simulation of 379 NSE swing trades with 1% risk each, a 5% heat cap limited the maximum drawdown to about 18%, against 40% with no cap; a 3% cap held it to about 14% but took far fewer trades.
Do several swing positions in different stocks reduce risk?
Less than you might expect. In our simulation, 13 positions in different NSE stocks were stopped out on the same day, 20 January 2026. In sharp market falls, long positions tend to fall together, so count them against one total heat limit.
Practical Exercise
Build a sizing sheet.
Your task
Step 1: Set your rules
Risk per trade, position cap, heat cap and sector cap.
Step 2: Build a spreadsheet
Entry, stop, shares, value, risk and sector for each position.
Step 3: Add totals
Total heat and risk per sector.
Step 4: Use it before every entry
Check that the new trade fits all caps.
Check Your Understanding
Risk ₹5,000, entry ₹820, stop ₹790. Shares:
Related Lessons
Previous: Overnight and Gap Risk. Next: Trade Journal, Backtesting and Case Studies. See also the Risk Management course.