
Moving Average Swing Strategies
JustWolves is an educational platform and is not a SEBI-registered investment advisor. Trading financial instruments involves significant risk of loss and may not be suitable for all investors. Past performance is not indicative of future results. Read our full disclaimer →
What you'll learn
- Moving averages are useful to swing traders as trend filters, pullback zones and trailing exits
- The pullback strategy buys a bounce from a rising 20 or 50-day average in a confirmed uptrend
- Crossovers work better as trend filters than as entry signals, because they lag
- Trailing a stop under a moving average keeps winners running in trends but gives back profit at turns
- All MA strategies struggle in sideways markets; filter them out
In this article · 14 sections
Moving averages are the most widely used tool in swing trading, partly because they're simple and partly because many traders watch the same ones. This lesson covers three practical ways to use them: buying pullbacks to a rising average, using crossovers as a trend filter, and trailing stops under an average to manage winners. Each has clear rules and clear weaknesses.
What You Will Learn
- The moving average pullback strategy
- Using crossovers as trend filters
- Trailing stops with moving averages
- Where MA strategies fail
Before You Start
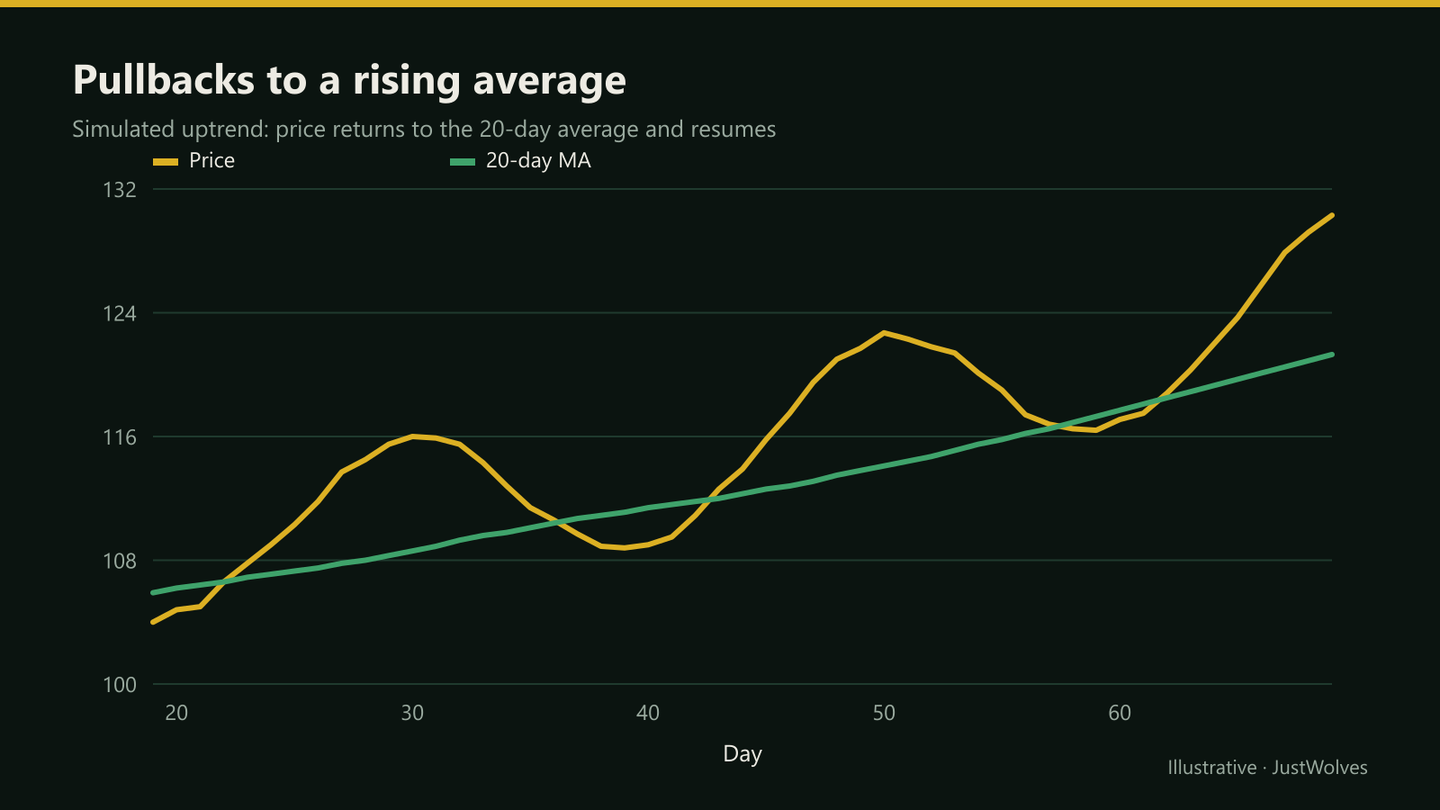
Strategy 1: Pullback to a Rising Average
Rules (long)
Step 1: Trend
Price above a rising 50-day MA, and the 50-day above the 200-day.
Step 2: Pullback
Price pulls back to the 20 or 50-day MA, ideally near a horizontal support level.
Step 3: Trigger
A bullish daily candle closing above the average, or a break of the previous day's high.
Step 4: Stop
Below the pullback low, at least about 1 ATR from entry.
Step 5: Target
The recent swing high, then trail the remainder.
Strategy 2: Crossovers as a Trend Filter
A crossover happens when a faster average crosses a slower one, such as the 50-day crossing above the 200-day. Because both lag, crossovers usually happen well after the turn, and in sideways markets they flip back and forth.
That makes crossovers poor entry signals but useful filters: for example, only take long swing setups while the 50-day is above the 200-day, and only short setups while it's below.
Strategy 3: Trailing Under an Average
Once a trade is in profit, some swing traders exit on a daily close below the 20-day average (for strong trends) or the 50-day (for steadier trends). This keeps them in the trade as long as the trend persists.
The cost is that exits come after the turn, giving back part of the gain. It suits traders who want to capture larger trends rather than single swings.
Real Prices: A Pullback Entry With a Trailing Exit
Sunil's example in this lesson combines a pullback entry with a moving-average trail. The chart below applies the same two rules to real Tata Steel prices from January to March 2026: buy a bullish close after a pullback to the rising 20-day EMA, and exit on the first daily close below it.
Real prices: a 20-day pullback entry and a moving-average trailing exit, Tata Steel, January–March 2026
Step 1 of 4
A pullback to the 20-day EMA
In early January 2026 Tata Steel is in an uptrend, its 50-day average rising beneath price. After a high near ₹188, it pulls back to ₹178.4 on 9 January, touching its rising 20-day EMA at about ₹177.
- What to observe
- Strategy 1 in this lesson: a pullback to a rising average.
- Condition
- Wait for a bullish close before buying.
Choosing Periods and Types
Simple moving averages (SMA) weight every day equally; exponential moving averages (EMA) give more weight to recent prices, so they turn sooner. Many swing traders use a 20-day EMA to follow strong, fast trends and a 50-day SMA for steadier ones, with the 200-day SMA as long-term context. The 50-day and 200-day are widely watched, which is part of why price often reacts near them.
There's no single correct setting. A shorter average gives earlier signals but more false ones; a longer average gives fewer, later signals. What matters is choosing settings before you test, using them consistently, and judging them over many trades and different market conditions rather than tuning them to fit a few recent charts.
Whichever average you use, combine it with structure. A pullback to the 50-day that also lands on a previous breakout level or the last higher low has two reasons to hold. A pullback to the average in empty space has only one, and deserves either a smaller position or a skip.
Practical Example
Hypothetically, a pharma stock's 50-day average is rising and above the 200-day. Price pulls back from ₹1,560 to ₹1,482, touching its rising 50-day average at ₹1,480. A bullish candle closes at ₹1,498.
Sunil buys at ₹1,500 with a stop at ₹1,462, below the pullback low and about 1.3 ATR away. He takes half at the prior high of ₹1,560 and trails the rest with a daily close below the 20-day average, exiting at ₹1,612 three weeks later.
Do Moving-Average Rules Work on Real Stocks? Our Test
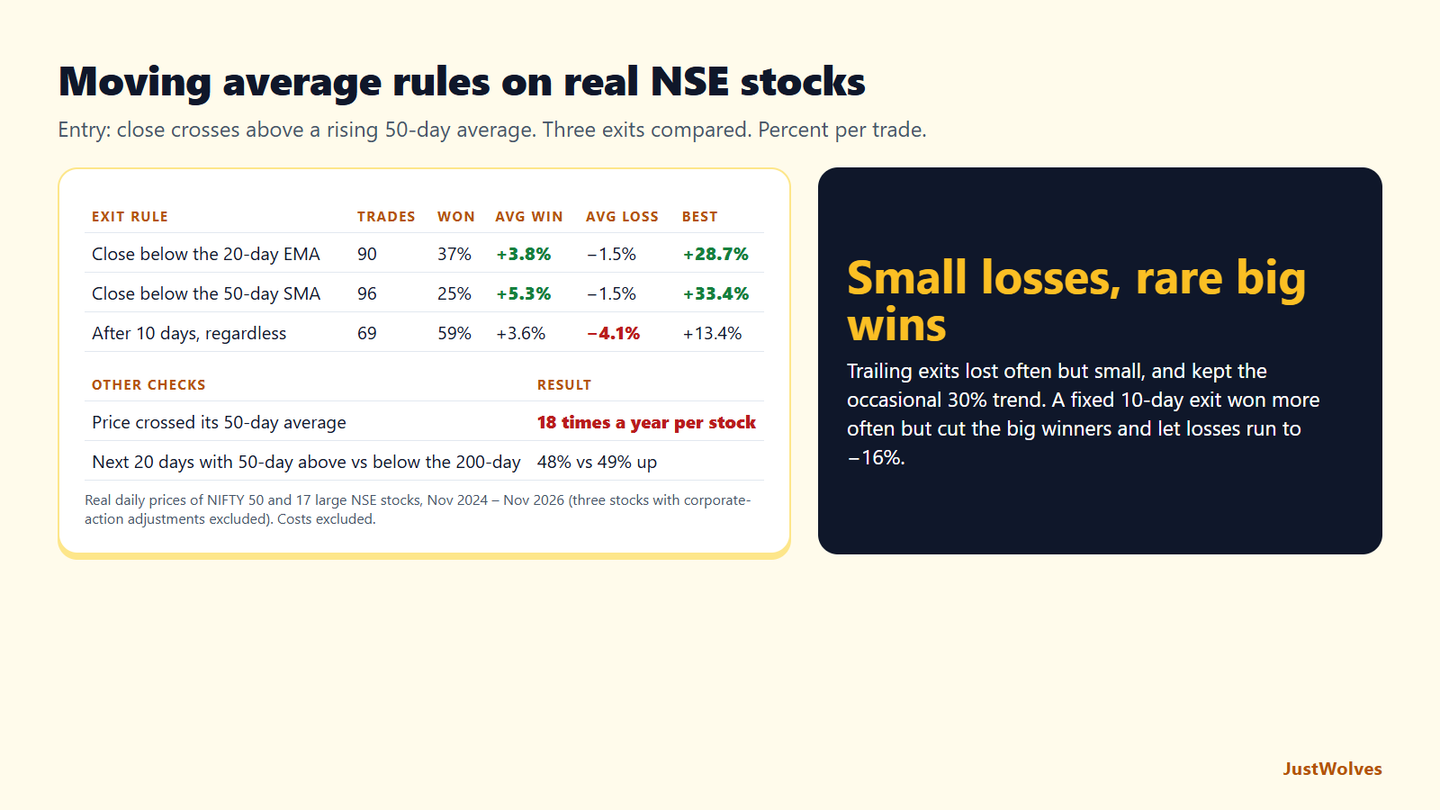
JustWolves tested this lesson's three uses of moving averages on about two years of daily prices for NIFTY 50 and 17 large NSE stocks (November 2024 to November 2026). Entry: a close back above a rising 50-day average. Exits compared: a close below the 20-day EMA, a close below the 50-day average, or a fixed 10-day hold. We also checked the 50/200 crossover as a filter, and how often price crossed its 50-day average.
| Exit rule | Trades | Won | Average win | Average loss | Best | Average per trade |
|---|---|---|---|---|---|---|
| Close below the 20-day EMA | 90 | 37% | +3.8% | −1.5% | +28.7% | +0.46% |
| Close below the 50-day SMA | 96 | 25% | +5.3% | −1.5% | +33.4% | +0.23% |
| Fixed 10-day hold | 69 | 59% | +3.6% | −4.1% | +13.4% | +0.46% |
| Check | Result |
|---|---|
| Next 20 days, 50-day above the 200-day | Up 48%, average −0.21% |
| Next 20 days, 50-day below the 200-day | Up 49%, average −0.19% |
| Times price crossed its 50-day average | About 18 a year per stock |
The trailing exits behaved exactly as this lesson describes. Exiting on a close below the 20-day EMA or the 50-day average produced many small losses, most trades lasted only a few days, and the average loss was about 1.5%. But they kept the rare big trends, up to +29% and +33%. The fixed 10-day exit won more often but cut those trends short and let losing trades run as far as −16%.
The whipsaw warning in this lesson's callout was the bigger story. Price crossed its own 50-day average about 18 times a year per stock, so most crossings were noise, and most MA trades were short-lived small losses. Overall, all three exits earned only a small average profit before costs: moving averages organised the trading, but did not create an edge on their own in this period.
As a filter, the 50/200 crossover did not separate good and bad periods here: the next 20 days were up about as often with the 50-day above the 200-day as below it. Its use, as the professional insight in this lesson says, is mainly in telling you what not to do in clear downtrends, rather than in improving returns in mixed markets.
Common Mistakes
- Buying pullbacks to a flat or falling average.
- Using crossovers as entry signals.
- Expecting exact touches of the average.
- Stops right at the average, inside normal noise.
- Optimising periods until past charts look perfect.
Professional Insight
Experienced swing traders often say moving averages are best at telling you what not to do: don't buy below a falling 50-day, don't hold longs after the 50 crosses below the 200. Used as filters, they remove many poor trades without needing to be precise. That is a more modest role than many beginners expect, but it holds up across very different markets and conditions.
Risk Considerations
- Lag at turning points.
- Whipsaws in ranges.
- Gaps through the average.
Important Terminology
| Term | Meaning |
|---|---|
| Pullback to the MA | A retracement to a rising moving average. |
| Crossover | A faster average crossing a slower one. |
| Trend filter | A rule that allows trades only in one direction. |
| Trailing stop | A stop that moves with the trade. |
| Whipsaw | Repeated false signals in sideways markets. |
Which moving average is best for swing trading?
Commonly the 20-day EMA for strong trends and the 50-day SMA for steadier ones, with the 200-day for long-term context.
How do I trade pullbacks to a moving average?
In a confirmed uptrend, wait for price to reach a rising average, then enter on a bullish trigger with a stop below the pullback low.
Are moving average crossovers good signals?
They lag and whipsaw, so they're better as trend filters than as entries.
How do I trail a stop with a moving average?
Exit on a daily close below the chosen average, such as the 20 or 50-day.
When do MA strategies fail?
In sideways markets where averages flatten and price crosses them repeatedly.
Is a 20-day EMA or 50-day SMA better for trailing a swing trade?
In our test on 17 NSE stocks, trailing under the 20-day EMA won 37% of trades and the 50-day SMA 25%, with similar small average losses. The slower average kept the biggest trends a little longer (best trade +33% vs +29%) but exited later after turns.
How often does price cross the 50-day moving average?
Often. In our two years of data, a large NSE stock crossed its 50-day average about 18 times a year. Most crossings were followed by small moves, which is why crossovers work better as filters than as entry signals.
Practical Exercise
Test the pullback strategy.
Your task
Step 1: Pick five trending stocks
Daily charts, two years of data.
Step 2: Apply the rules
Mark every qualifying pullback to the 50-day.
Step 3: Record outcomes
Did price reach the prior high before the stop?
Step 4: Add the filter
Compare results with and without the 50/200 crossover filter.
Check Your Understanding
The pullback strategy buys near:
Related Lessons
Previous: Trend Identification on Daily and Weekly Charts. Next: RSI and MACD for Swing Traders. See also Dynamic Support and Resistance.