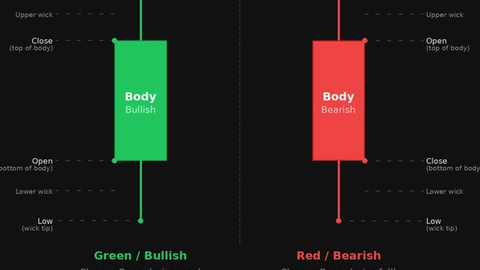
Other Multi-Candle Formations: Three Line Strike and More
JustWolves is an educational platform and is not a SEBI-registered investment advisor. Trading financial instruments involves significant risk of loss and may not be suitable for all investors. Past performance is not indicative of future results. Read our full disclaimer →
What you'll learn
- Most multi-candle patterns combine simpler patterns you already know
- Three line strike: three trend candles, then one large candle reversing all three; commonly read either as continuation or reversal, so context decides
- Rising and falling three methods: a strong candle, a small counter-move inside its range, then a strong candle in the original direction
- Three inside up/down: a harami confirmed by a third candle; three outside up/down: an engulfing confirmed by a third
- The more candles a pattern needs, the rarer it is and the later the entry
In this article · 15 sections
Beyond stars and soldiers lies a long list of named multi-candle patterns. You don't need to memorise them all, because most are combinations of the single- and two-candle patterns already covered. This lesson explains a handful that traders commonly discuss, the three line strike, the rising and falling three methods, and the three inside and three outside patterns, and shows how each one breaks down into simpler pieces.
What You Will Learn
- The three line strike and why it's read two ways
- Rising and falling three methods
- Three inside and three outside patterns
- How to break any multi-candle pattern into simpler parts
Before You Start
Read Three White Soldiers and Three Black Crows, Harami Patterns and Bullish and Bearish Engulfing Patterns first.
The Three Line Strike
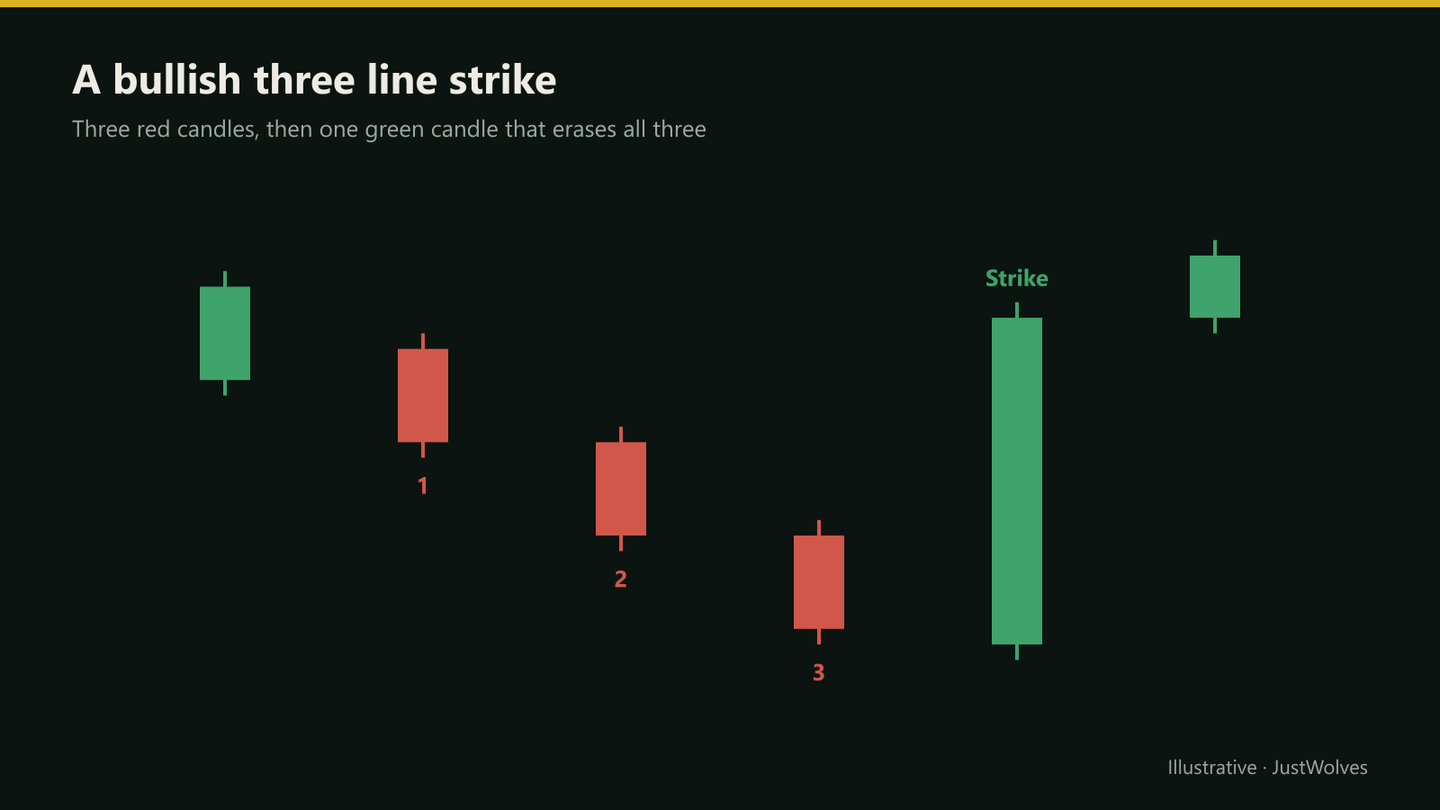
A bearish three line strike has three consecutive bullish candles, each closing higher, followed by one large bearish candle that opens above the third close and closes below the first candle's open, erasing all three. The bullish version is the mirror: three bearish candles, then one large bullish candle reversing all of them.
It's interpreted in two opposite ways. Classical candlestick texts often describe the bullish three line strike (three red candles, then a big green one) as a continuation of the prior downtrend after a brief shakeout. Many modern price action traders read the fourth candle as a reversal signal instead. Both readings exist because the pattern itself only shows a sharp swing in control; the trend and the level decide what it means.
Real Case: A Three Line Strike on ICICI Bank
The chart below uses real daily candles for ICICI Bank from September and October 2025. Step through it to see a bullish three line strike at the end of a decline, and how the two opposite readings described above played out on the same candles.
Real case: a bullish three line strike, ICICI Bank, September–October 2025
Step 1 of 5
A steady decline
ICICI Bank falls from 1,432.8 on 18 September 2025 to 1,342.6 on 30 September, with lower closes almost every day.
- What to observe
- A short-term downtrend.
- Condition
- Watch for a change in behaviour.
Rising and Falling Three Methods
- Rising three methods: in an uptrend, a large bullish candle is followed by several (classically three) small candles drifting lower but staying within the first candle's range, then another large bullish candle closes above the first candle's close.
- Falling three methods: the bearish mirror in a downtrend.
These are continuation patterns. In price action terms, they're a tiny bull or bear flag: a strong move, a shallow pause inside its range, and a resumption, just like the flags in Continuation Patterns.
Three Inside and Three Outside
| Pattern | Made of | Third candle |
|---|---|---|
| Three inside up | A bullish harami | Closes above the first candle's high |
| Three inside down | A bearish harami | Closes below the first candle's low |
| Three outside up | A bullish engulfing | Closes higher than the engulfing candle |
| Three outside down | A bearish engulfing | Closes lower than the engulfing candle |
These are exactly the confirmations recommended in the harami and engulfing lessons. The names simply describe the pattern once the confirmation candle has closed.
Why Longer Patterns Are Rarer
Every extra condition makes a pattern less common. A pattern requiring four specific candles appears far less often than one requiring two, so you'll see fewer trades, and the entry comes later, after more of the move has happened.
That isn't automatically bad. Later entries come with more evidence. But it means multi-candle patterns are best treated as one more input at a level you've already marked, not as setups to search for across hundreds of charts.
Which Multi-Candle Patterns Hold Up? Our Test
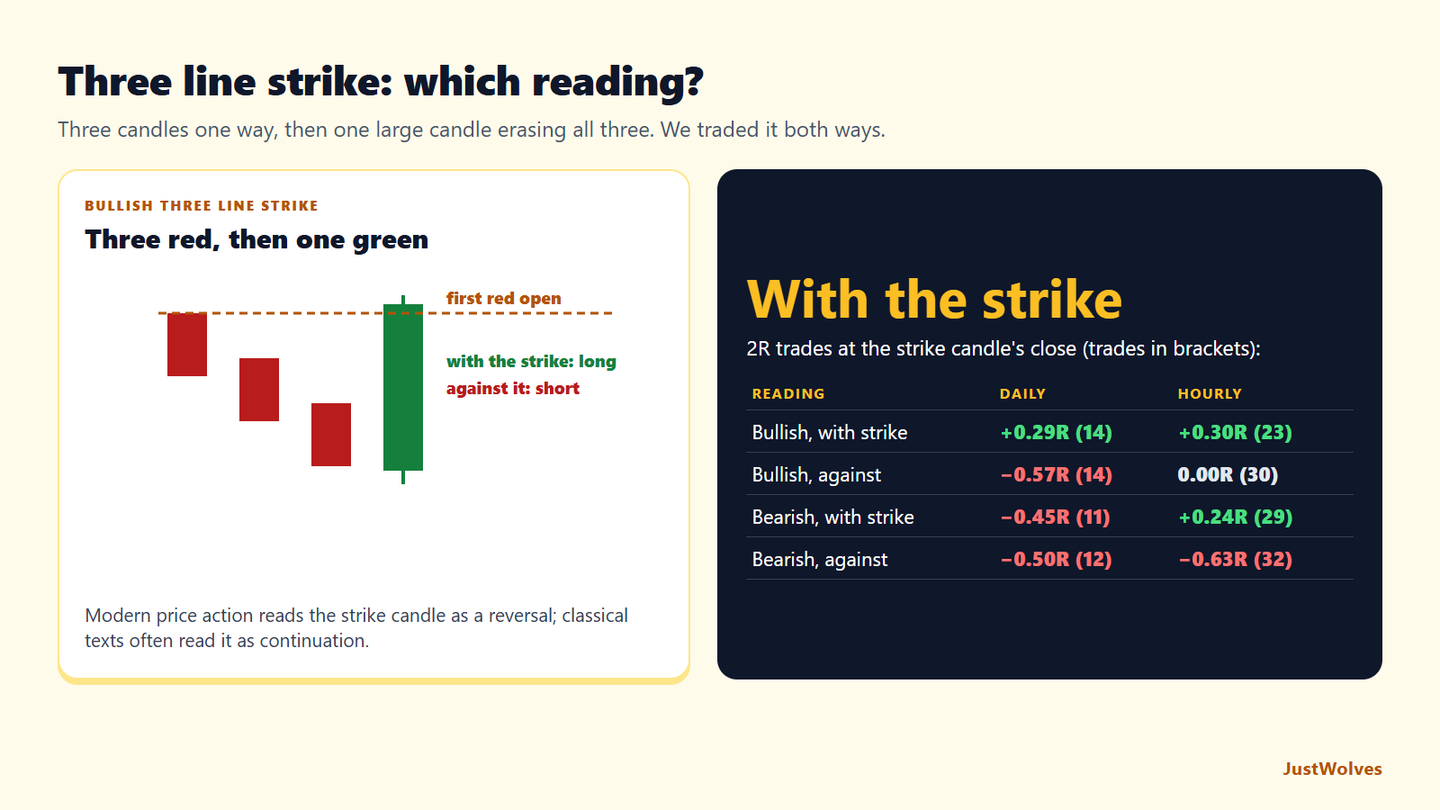
JustWolves tested the patterns in this lesson on about two years of real daily candles for 20 large NSE stocks, NIFTY 50, four currency pairs and gold, and six months of hourly candles for the five markets, with bearish versions tested on mirrored prices. All trades used a 2R target, with the stop beyond the pattern, entered at the close of the final candle. Three line strike: three candles of one colour with successively lower (or higher) closes, then one opposite candle that opens at or beyond the third close and closes beyond the first candle's open. We traded it both ways: with the strike candle (the reversal reading) and against it (the classical continuation reading, stop beyond the strike candle).
| Reading | Daily | Hourly |
|---|---|---|
| Bullish strike, traded with the strike candle | 14 trades, 43% wins, +0.29R | 23 trades, 43% wins, +0.30R |
| Bullish strike, traded against it | 14 trades, 14% wins, −0.57R | 30 trades, 33% wins, 0.00R |
| Bearish strike, traded with the strike candle | 11 trades, 18% wins, −0.45R | 29 trades, 41% wins, +0.24R |
| Bearish strike, traded against it | 12 trades, 17% wins, −0.50R | 32 trades, 13% wins, −0.63R |
In three of the four groups, trading in the direction of the strike candle did better than the classical continuation reading. The one exception, bearish strikes on daily charts, lost both ways. With 11 to 32 trades per row, these are hints rather than proof, but they lean the same way as the ICICI Bank example: the big candle that erases three others usually tells you more about the next few sessions than the three candles it erased.
| Pattern | Daily | Hourly |
|---|---|---|
| Rising three methods (bullish) | 7 trades, 29% wins, −0.14R | 13 trades, 31% wins, −0.08R |
| Falling three methods (bearish) | 4 trades, 50% wins, +0.50R | 12 trades, 50% wins, +0.50R |
| Three inside up (bullish) | 3 trades | 5 trades, 20% wins, −0.40R |
| Three inside down (bearish) | 7 trades, 14% wins, −0.57R | 8 trades, 25% wins, −0.25R |
| Three outside up (bullish) | 41 trades, 29% wins, −0.12R | 46 trades, 24% wins, −0.28R |
| Three outside down (bearish) | 41 trades, 29% wins, −0.12R | 46 trades, 37% wins, +0.11R |
This table is the clearest support for this lesson's section on rarity. Across 25 markets and two years of daily data, we found only 3 to 7 cases of the three methods and three inside patterns. That is far too few to say anything about whether they work.
The three outside patterns were more common and give a useful comparison. They are engulfing patterns confirmed by a third candle. In the engulfing lesson, bullish engulfing patterns traded at their own close averaged −0.13R on daily charts; waiting for the confirming third candle gave −0.12R, essentially the same, at a later entry. Bearish engulfing patterns averaged +0.29R at their own close; the confirmed three outside down averaged −0.12R. Waiting for an extra candle did not improve results in our data.
Practical Example
Hypothetically, Nifty in a daily uptrend pulls back into support at 24,100 with three red candles closing at 24,280, 24,190 and 24,120. The next session opens at 24,105 and closes at 24,360, above the first red candle's open of 24,340: a bullish three line strike at support in an uptrend.
Read in context, it suggests the pullback has ended. Meghna buys Nifty futures at 24,365 with a stop at 24,060 below the strike candle's low, targeting the swing high at 24,800: 305 points of risk for 435 points of reward.
Measuring the ICICI Bank Three Line Strike
| Candle | Open → close | Notes |
|---|---|---|
| Red 1 (26 Sep) | 1,368.0 → 1,359.6 | Its open, 1,368.0, is the level to beat |
| Red 2 (29 Sep) | 1,359.6 → 1,348.1 | Lower close |
| Red 3 (30 Sep) | 1,353.7 → 1,348.0 | Lower close by just 0.1 |
| Strike (1 Oct) | 1,348.0 → 1,372.0 | Opens at the third close; closes 4 points above red 1's open |
| Pattern low | 1,342.6 (30 Sep) | Stop for the reversal reading at 1,341 |
Break it down as this lesson's tip suggests. The three red candles were not dramatic: the third closed only 0.1 lower than the second, a sign that selling was already slowing. The strike candle opened at the low and closed near its high (1,372.0 against a high of 1,379.4), a 24-point body, almost as large as the three red bodies combined (8.4 + 11.5 + 5.7 = 25.6 points). In plain terms: sellers spent three sessions pushing price down, and buyers took it all back in one. Read that way, the reversal reading is the natural one, which is what our data also leaned towards.
Common Mistakes
- Memorising names instead of reading the candles.
- Ignoring context for patterns with two possible readings.
- Counting a pattern and its parts as separate confirmations.
- Forcing loose matches to fit rare patterns.
- Overlooking the late entry and wide stop.
Professional Insight
Few experienced traders track dozens of named patterns. They tend to focus on a small set they understand well, read everything else candle by candle, and let the level and trend do most of the work.
Risk Considerations
- Rare patterns give small samples for testing.
- Ambiguous patterns can be read either way.
- Wide multi-candle ranges inflate stop distance.
Important Terminology
| Term | Meaning |
|---|---|
| Three line strike | Three trend candles reversed by one large opposite candle. |
| Rising three methods | A strong candle, a small pause within it, then continuation. |
| Three inside up | A bullish harami confirmed by a third candle. |
| Three outside up | A bullish engulfing confirmed by a third candle. |
| Continuation pattern | A pattern suggesting the existing trend will resume. |
What is a three line strike?
Three consecutive candles in one direction followed by a single large candle that reverses all three.
Is the three line strike bullish or bearish?
It's read both ways in different sources. The trend and the level it forms at decide the more sensible reading.
What is the rising three methods pattern?
A continuation pattern: a strong bullish candle, small candles drifting lower within its range, then another strong bullish candle.
What is three inside up?
A bullish harami followed by a candle closing above the first candle's high.
Do I need to learn every candlestick pattern?
No. Understanding body, wicks, close location and context lets you read unfamiliar patterns candle by candle.
Does the three line strike signal a reversal or a continuation?
In our data, trading in the direction of the strike candle (the reversal reading) did better than the continuation reading in three of four groups, for example +0.29R against −0.57R for bullish strikes on daily charts. The samples were small, 11 to 32 trades per group.
Do three outside up and three inside up patterns work better than engulfing and harami?
Not in our data. Three outside up, an engulfing pattern confirmed by a third candle, averaged −0.12R on daily charts, about the same as the bullish engulfing pattern on its own. Three inside up patterns were too rare to measure.
Practical Exercise
Decompose patterns.
Your task
Step 1: Find five multi-candle patterns
Of any kind covered here, on daily charts.
Step 2: Break each down
Name the single- and two-candle patterns inside it.
Step 3: Add context
Trend and level at the time.
Step 4: Decide the reading
Continuation or reversal, and why.
Check Your Understanding
A bullish three line strike's fourth candle:
Related Lessons
Previous: Three White Soldiers and Three Black Crows. Next module: Candlestick Patterns: Complete Guide and Cheat Sheet. See also Continuation Patterns.