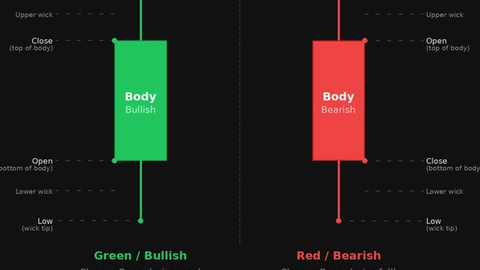
Pin Bars: How to Identify and Trade Pin Bar Candles
JustWolves is an educational platform and is not a SEBI-registered investment advisor. Trading financial instruments involves significant risk of loss and may not be suitable for all investors. Past performance is not indicative of future results. Read our full disclaimer →
What you'll learn
- A pin bar has one long wick (the tail), a small body and a short opposite wick
- Hammers and shooting stars are pin bars; 'pin bar' is the general price action term
- Quality: tail roughly two-thirds or more of the range, body near the opposite end, tail sticking out from nearby candles
- Location matters most: the tail should probe a meaningful level
- Common entries: a break of the pin's body end, or a retrace into the tail; stop beyond the tail
In this article · 16 sections
The pin bar is one of the most widely taught price action candles. It's the general name for a candle with one long wick and a small body at the other end, a shape that shows a sharp push being rejected. This lesson covers how pin bars relate to hammers and shooting stars, what separates a good pin bar from a poor one, and how to trade them.
What You Will Learn
- What a pin bar is
- How it relates to hammers and shooting stars
- Quality rules for pin bars
- Entry, stop and target methods
Before You Start
Read Hammer and Hanging Man and Inverted Hammer and Shooting Star. The Price Action course's Price Rejection lesson shows how pin bars fit into reading levels.
What a Pin Bar Is
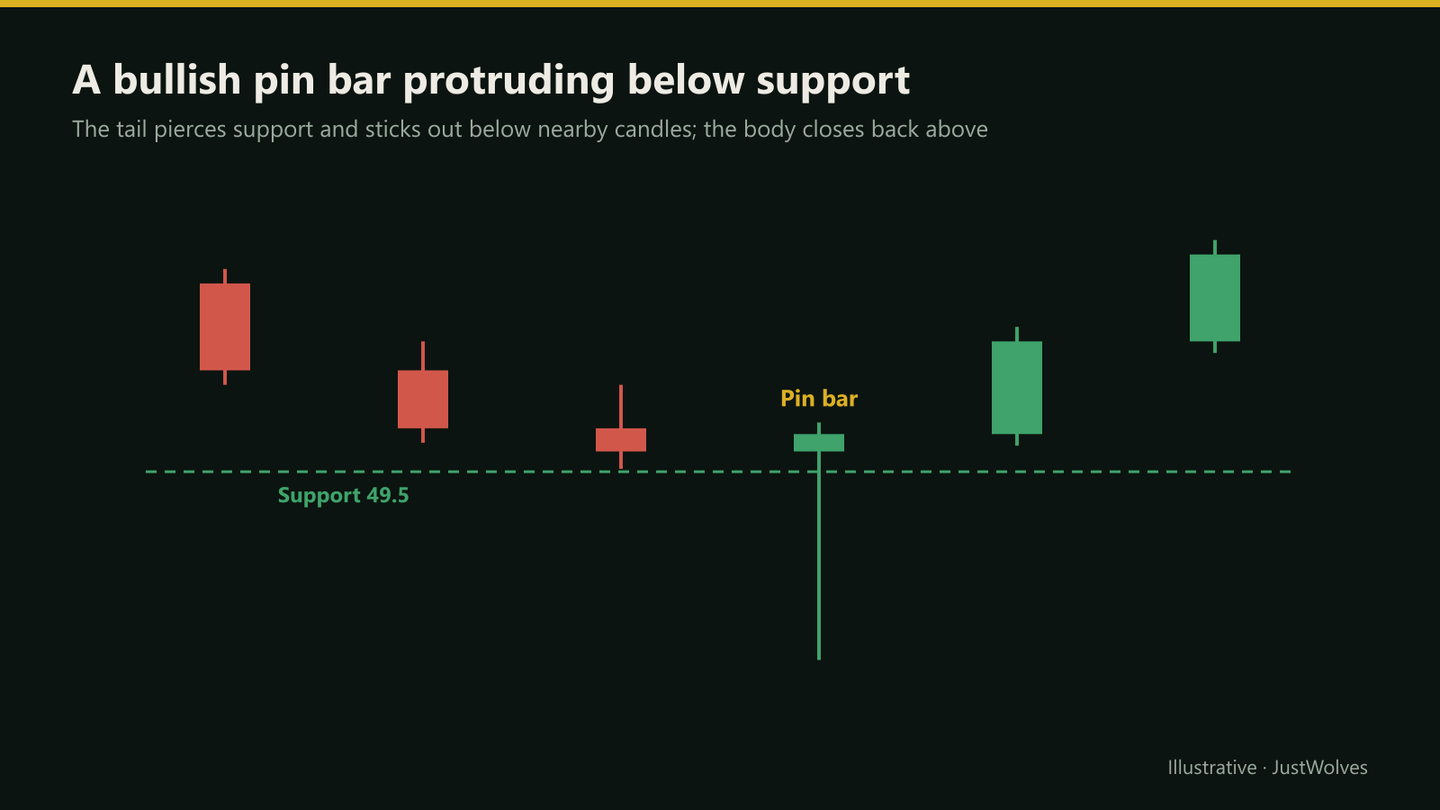
A pin bar (short for 'Pinocchio bar', a name popularised by price action educators) has a long wick called the tail or nose, a small body at the opposite end, and little or no wick on the body side.
A bullish pin bar has a long lower tail: price was pushed down and rejected. A bearish pin bar has a long upper tail. Hammers and shooting stars are pin bars; the pin bar term simply ignores the trend-based naming and focuses on the rejection.
Quality Rules
| Feature | Stronger | Weaker |
|---|---|---|
| Tail length | Roughly two-thirds or more of the full range | Tail similar to the body |
| Body position | In the opposite third of the range | Near the middle |
| Protrusion | Tail sticks out beyond nearby candles | Tail inside recent ranges |
| Location | Tail probes a key level, then closes back | No level nearby |
| Size | Range larger than recent candles | Tiny compared with recent candles |
Entry Methods
| Method | How | Trade-off |
|---|---|---|
| Break entry | Buy-stop just above the pin bar's high (bullish) | Requires follow-through; worse price |
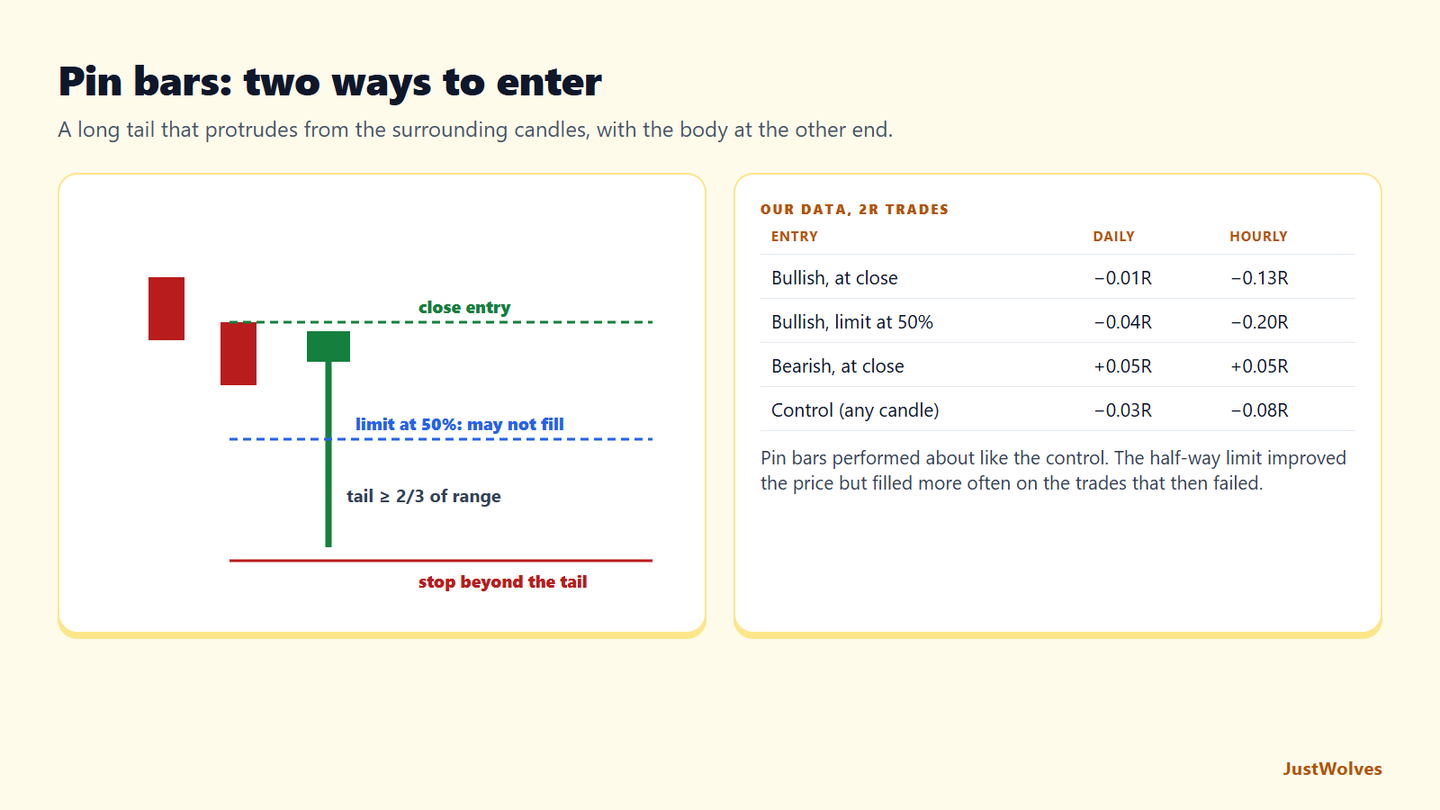
| Retrace entry | Limit order around the 50% of the pin bar's range | Better price and tighter risk; may not fill |
In both cases, the stop usually goes just beyond the tail's extreme. The target is the next opposing level; many traders skip pin bars where that level is less than about twice the risk away.
Pin Bars and Trend
Pin bars in the direction of the trend, such as a bullish pin bar at support during an uptrend pullback, are generally considered higher quality than counter-trend pin bars. A bullish pin bar in a strong downtrend asks buyers to reverse the whole move from one candle, which happens less often.
Real Case: A Pin Bar on a Crash Day
The chart below uses real daily candles for Larsen & Toubro from March and April 2025. Step through it to compare the two entry methods from this lesson on a real pin bar: the close entry reached 2R, while the midpoint limit never filled.
Real case: a crash-day pin bar, Larsen & Toubro, April 2025
Step 1 of 5
A sharp decline
Larsen & Toubro slips from 3,528 on 27 March 2025 and falls hard on 4 April, closing at 3,260.
- What to observe
- Selling accelerating.
- Condition
- Watch for a sign of exhaustion.
Pin Bars Inside Ranges
In a sideways range, pin bars at the range edges can be useful: a bullish pin bar whose tail probes below the range low and closes back inside is a classic failed-breakout signal. Pin bars in the middle of the range, by contrast, usually have no level behind them and little room to the target. Many range traders only consider pin bars whose tails touch or pierce the range boundaries.
How Do Pin Bars Perform? Our Test
JustWolves tested pin bars on about two years of real daily candles for 20 large NSE stocks, NIFTY 50, four currency pairs and gold, and six months of hourly candles for the five markets, with bearish pin bars tested on mirrored prices. Pin bar: tail at least two thirds of the range, close in the third of the range away from the tail, range at least one average candle. Trades: 2R targets, stop just beyond the tail, entered at the close or with a limit at the candle's midpoint within three candles.
| Setup | Daily | Hourly |
|---|---|---|
| Bullish pin bar, at the close | 145 trades, 33% wins, −0.01R | 246 trades, 29% wins, −0.13R |
| Bullish pin bar, limit at the midpoint | 112 trades, 32% wins, −0.04R | 191 trades, 27% wins, −0.20R |
| Bullish pin bar at a 20-candle low | 39 trades, 31% wins, −0.08R | 79 trades, 29% wins, −0.13R |
| Bearish pin bar, at the close | 152 trades, 35% wins, +0.05R | 225 trades, 35% wins, +0.05R |
| Bearish pin bar at a 20-candle high | 42 trades, 45% wins, +0.36R | 59 trades, 36% wins, +0.07R |
| Control: any candle, same trade | about 2,200 trades, −0.02 to −0.03R | about 2,500 trades, −0.07 to −0.10R |
Three findings stand out. Pin bars at their close performed close to the control: the shape alone did not add much. The midpoint limit did worse than the close entry in every group, even though it gives a better price. Limit orders fill more often on the trades that keep going against you and miss many of the trades that work at once, as the Larsen & Toubro example shows. Bearish pin bars at 20-day highs did best on daily charts (+0.36R over 42 trades), which is interesting but needs a larger sample before you rely on it.
The practical message for this lesson: the pin bar gives a clear stop and a clear trigger. Whether it gives an edge depends on where it forms and on your own records, not on the shape.
Practical Example
Hypothetically, a stock in a daily uptrend pulls back to a broken resistance level at ₹1,240. One session's low reaches ₹1,214, below the level and below the prior three candles' lows, but it closes at ₹1,252 near its high of ₹1,256. The range is ₹42 and the tail is ₹30: about 71% of the range.
Varun places a buy limit at ₹1,235, roughly the midpoint, with a stop at ₹1,209 below the tail. It fills the next day. His target is the prior high at ₹1,320: ₹26 of risk for ₹85 of reward.
Measuring the Larsen & Toubro Pin Bar
| Measure | Calculation | Result |
|---|---|---|
| Range | 3,090.6 − 2,965.3 | 125.3 |
| Tail (lower wick) | 3,049.1 − 2,965.3 | 83.8 (67% of range) |
| Body | 3,068.5 − 3,049.1 | 19.4 |
| Close location | (3,068.5 − 2,965.3) ÷ 125.3 | 0.82 |
| Protrusion | Low vs the previous five lows | About 270 points below them |
The tail passes the two-thirds test, the close sits in the top fifth of the range, and the low protruded far below the surrounding candles. On a day of broad market selling, that kind of protrusion records a sharp flush that buyers absorbed. It also explains the risk: a 108-point stop on a ₹3,068 stock is 3.5% of the price, so the position has to be small.
Common Mistakes
- Trading pin bars with no level behind the tail.
- Accepting short tails or bodies in the middle of the range.
- Ignoring the trend.
- Stops inside the tail.
- Taking every lower-timeframe pin bar.
Professional Insight
Pin bars are popular partly because they combine a reason (rejection at a level) and a stop location (beyond the tail) in one candle. Their weakness is that they're easy to see in hindsight. Writing your quality rules in advance keeps the selection honest.
Risk Considerations
- Long tails mean wide stops.
- Retrace entries may miss the strongest moves.
- Counter-trend pin bars fail more often.
Important Terminology
| Term | Meaning |
|---|---|
| Pin bar | A candle with one long wick and a small body at the other end. |
| Tail (nose) | The long wick of a pin bar. |
| Protrusion | How far the tail sticks out beyond nearby candles. |
| Break entry | Entering when price moves past the pin bar's body end. |
| Retrace entry | Entering on a pullback into the pin bar's range. |
What is a pin bar in trading?
A candle with a long wick on one side and a small body at the other end, showing a push that was rejected.
Is a hammer a pin bar?
Yes. A hammer is a bullish pin bar after a decline; a shooting star is a bearish pin bar after a rise.
How long should a pin bar's tail be?
Many traders look for a tail of roughly two-thirds or more of the full range.
Where do I enter a pin bar trade?
Either on a break past the pin bar's body end or on a retrace toward the middle of its range.
Where does the stop go?
Just beyond the tail's extreme.
Should I enter a pin bar at the close or at its midpoint?
In our data, entering at the close did better on average than a limit at the midpoint, for both daily and hourly bullish pin bars. The midpoint gives a better price but often misses the trades that work immediately.
Do pin bars work?
As a structure for trades, they give a clear stop and trigger. As a predictor, pin bars traded at their close performed close to the same trade on any candle in our data. Bearish pin bars at 20-day highs looked better on daily charts, on a modest sample.
Practical Exercise
Grade twenty pin bars.
Your task
Step 1: Find twenty
On daily charts of liquid stocks or indices.
Step 2: Grade each
Tail length, body position, protrusion, location and trend.
Step 3: Track outcomes
Did price reach 2R before the stop?
Step 4: Compare
Did higher-graded pin bars do better in your sample?
Check Your Understanding
A bullish pin bar has:
Related Lessons
Previous: Marubozu Candles. Next module: Bullish and Bearish Engulfing Patterns. See also Price Rejection.