How Reliable Are Candlestick Patterns? Limits and Context
JustWolves is an educational platform and is not a SEBI-registered investment advisor. Trading financial instruments involves significant risk of loss and may not be suitable for all investors. Past performance is not indicative of future results. Read our full disclaimer →
What you'll learn
- No candlestick pattern guarantees direction; each one is a small piece of evidence
- Academic studies of candlestick patterns have reached mixed conclusions, and results vary by market and period
- Hindsight, selective memory and loose definitions make patterns look more reliable than they are
- Context (level, trend, timeframe) usually matters more than the pattern itself
- Test patterns on your own markets, with strict definitions, before relying on them
In this article · 16 sections
Most candlestick material shows patterns that worked. This lesson looks at the other side: why patterns fail, what independent research has found, and the biases that make candles look more predictive than they are. The aim isn't to dismiss candlesticks, but to use them with realistic expectations and to test them properly.
What You Will Learn
- Why no pattern is a guarantee
- What research broadly suggests
- The biases that inflate pattern reliability
- How to test patterns yourself
Before You Start
Read Candlestick Patterns and Market Structure first.
Patterns Are Evidence, Not Signals
A candle summarises what happened in one period. It can show that buyers recovered a drop or that sellers erased a rally, but it can't tell you what will happen next. News, larger participants, other timeframes and simple randomness all affect the following candles.
That's why every lesson in this course has treated patterns as context: something that shifts the odds when combined with a level and a trend, not something that decides the trade on its own.
Real Case: Three Good-Looking Signals, Three Losses
The chart below uses real daily candles for NIFTY 50 from July and August 2026. It shows something most candlestick material leaves out: three textbook bullish pin bars, all with the trend, all stopped out within seven sessions.
Real case: three bullish pin bars in an uptrend, all stopped out, NIFTY 50, August 2026
Step 1 of 5
A strong rally
NIFTY 50 rallies from 23,606 on 24 July 2026 to 24,774.3 on 3 August, closing at the high of the day, above a rising 50-day average.
- What to observe
- An uptrend: bullish patterns are with-trend.
- Condition
- Look for pullbacks to buy.
What Research Suggests
Candlestick charting is traditionally traced to Japanese rice markets centuries ago, and became widely used by traders around the world from the early 1990s. Since then, academic researchers have tested many patterns on stock, index and currency data.
The results are mixed. Some studies have found little or no predictive value after accounting for costs, particularly in large, liquid markets. Others have reported that certain patterns showed some value in particular markets or periods. Results also tend to depend heavily on how patterns are defined and on the period tested. The fair summary is that no pattern has been shown to work reliably everywhere, and that context and testing matter.
Biases That Inflate Reliability
| Bias | What happens |
|---|---|
| Hindsight | On a finished chart, the patterns at turning points stand out; the many identical patterns that led nowhere don't. |
| Selective memory | Traders remember the hammer that marked the low, not the ten hammers that failed. |
| Loose definitions | If 'almost an engulfing' counts when it works and is ignored when it doesn't, results look better than they are. |
| Small samples | A few examples can look convincing by chance. |
| Ignoring costs | Brokerage, taxes and slippage reduce small edges. |
What Seems to Matter More
- Location: a pattern at a meaningful level answers a real question.
- Trend: with-trend patterns only need to mark the end of a pullback.
- Timeframe: higher-timeframe candles summarise more trading.
- Risk management: a clear stop beyond the pattern limits the damage when it fails.
In practice, a modest pattern in excellent context is often more useful than a perfect-looking pattern in poor context.
How to Test a Pattern Yourself
A simple test
Step 1: Define it strictly
Write exact rules, for example: second body covers the first body; first candle at least as large as the 10-candle average.
Step 2: Define the context
For example: at a marked daily support level, in a weekly uptrend.
Step 3: Define the trade
Entry, stop beyond the pattern, target at 2R.
Step 4: Collect every instance
Using bar replay, without skipping awkward ones.
Step 5: Compare
Results with and without the context filter, after costs.
The How to Backtest lesson covers the method in more detail.
Our Test: Patterns Against a Control
Throughout the Candlestick course, JustWolves tested each pattern on real data: about two years of daily candles for 20 large NSE stocks, NIFTY 50, four currency pairs and gold, and six months of hourly candles for the five markets. Every test used strict written definitions, a fixed 2R target, a stop just beyond the pattern, and, most importantly, a control: the same trade placed on ordinary candles. A pattern only shows value if it beats that control.
For this lesson we pooled the main reversal patterns (pin bars, engulfing patterns, tweezers and stars) and compared them with the control, then tested the two filters this lesson recommends: context and confirmation.
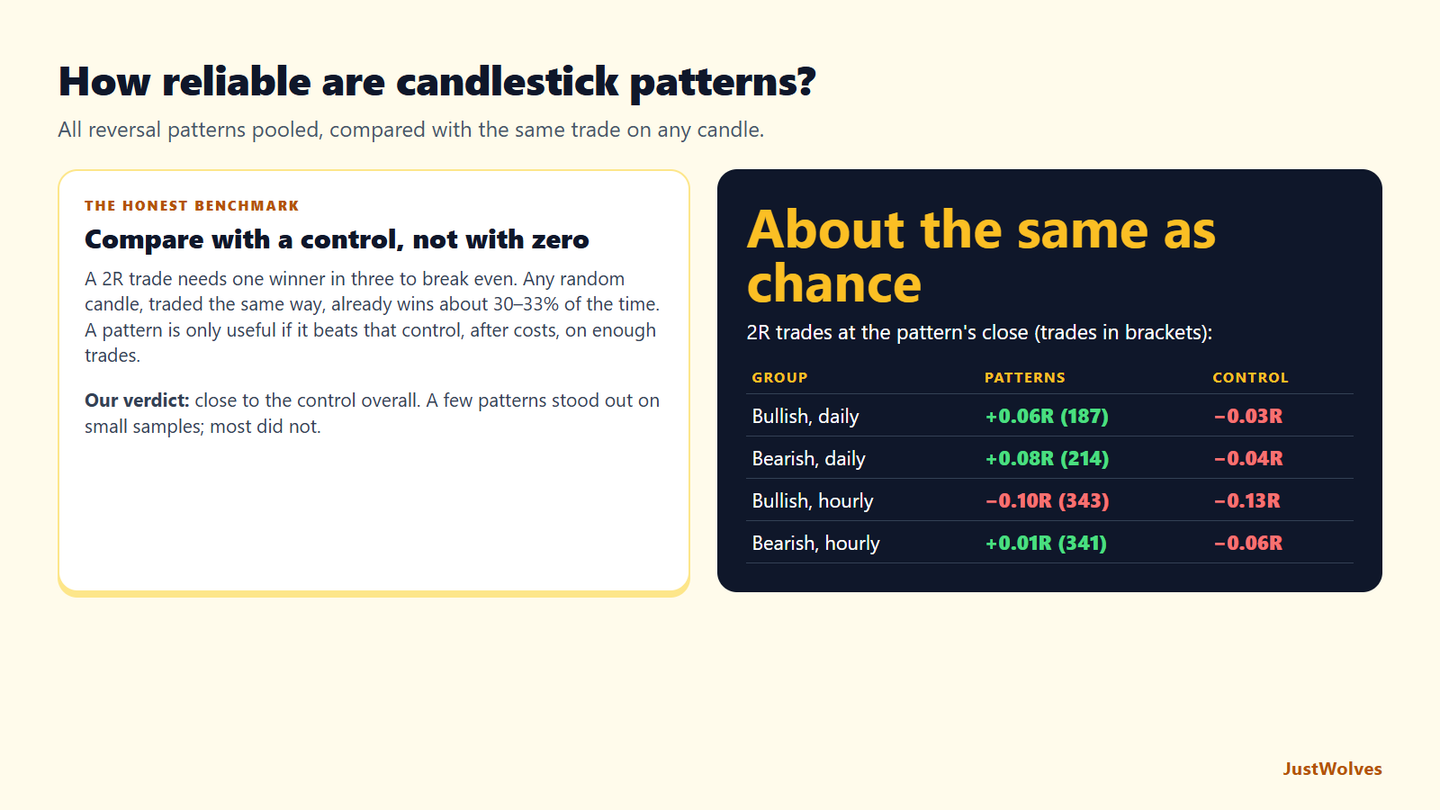
| Group | Patterns | Control: any candle |
|---|---|---|
| Bullish, daily | 187 trades, 35% wins, +0.06R | about 3,300 trades, 32% wins, −0.03R |
| Bearish, daily | 214 trades, 36% wins, +0.08R | about 3,300 trades, 32% wins, −0.04R |
| Bullish, hourly | 343 trades, 30% wins, −0.10R | about 4,200 trades, 29% wins, −0.13R |
| Bearish, hourly | 341 trades, 34% wins, +0.01R | about 4,200 trades, 31% wins, −0.06R |
Pooled together, reversal patterns did a little better than the control in every group, by 0.03 to 0.12R per trade. That is a real but small difference, of the size that trading costs, slippage and a few unlucky trades can easily erase. It is consistent with this lesson's summary of independent research: some value in some places, nothing that works reliably on its own.
We then tested confirmation: waiting for the next candle to close beyond the pattern's high (or low, for bearish patterns) and entering at that close, with the same stop.
| Group | Enter at the pattern's close | Enter after a confirming close |
|---|---|---|
| Bullish, daily | 187 trades, +0.06R | 47 trades, +0.02R |
| Bearish, daily | 214 trades, +0.08R | 57 trades, −0.26R |
| Bullish, hourly | 343 trades, −0.10R | 76 trades, −0.01R |
| Bearish, hourly | 341 trades, +0.01R | 90 trades, +0.33R |
| Control, daily (both) | −0.03 to −0.04R | −0.09R |
| Control, hourly (both) | −0.06 to −0.13R | −0.06 to +0.06R |
Confirmation helped on hourly charts and hurt on daily charts. The reason is partly mechanical: waiting a candle gives a later entry with the same stop, so the risk per trade grows, and on daily charts the confirming candle often uses up much of the move. Confirmation is a trade-off, not a free improvement.
Finally, the context filters from earlier lessons, location at a prior swing level and agreement with a simple trend, did not consistently improve results either (see the support and resistance and market structure lessons for the full tables). Stacking all three filters left only 23 trades across both timeframes and both directions, too few to judge.
The honest conclusion, from strictly defined patterns on real data: candlestick patterns are weak evidence on their own. That is exactly the position this lesson takes. Note that the hypothetical result in the practical example below, where context made a large difference, is the kind of claim worth testing yourself: in our data, a simple version of that filter did not.
Practical Example
Hypothetically, Kabir believes bullish engulfing patterns 'always work'. He defines the pattern strictly and replays two years of daily charts on five liquid stocks, logging every instance.
He finds that engulfing patterns anywhere on the chart barely broke even in his sample after costs, while those at marked support in an uptrend did noticeably better. His conclusion isn't that the pattern works, but that his context filter seems to matter, which he now tests on different stocks before trading it.
What Losing Streaks Look Like
The NIFTY 50 example is not unusual. If a pattern wins about one trade in three, as most of ours did with 2R targets, losing streaks are a normal part of trading it. The table below shows how often streaks appear in 100 trades at different win rates, from simple probability.
| Win rate | 3 losses in a row | 5 in a row | 8 in a row |
|---|---|---|---|
| 33% (about break-even at 2R) | Almost certain | Almost certain (99.7%) | About 75% |
| 40% | Almost certain | About 98% | About 49% |
| 50% | Almost certain | About 81% | About 17% |
At a one-in-three win rate, a run of eight losses in a row is more likely than not over 100 trades. A trader who risks 5% of the account per trade would lose about a third of it in such a streak; a trader who risks 1% would lose about 8%. That is why this lesson ends on risk management rather than on patterns: when the evidence is weak, position size decides whether you survive long enough for any edge to show.
Common Mistakes
- Believing published success rates without knowing how they were measured.
- Judging patterns from memory instead of records.
- Changing definitions to fit outcomes.
- Testing without costs.
- Abandoning a tested approach after a few losses.
Professional Insight
Many experienced traders say candles are best used to read behaviour, not to predict. They ask what a candle shows about who is in control at a level, then let their risk management handle the fact that they'll often be wrong.
Risk Considerations
- Edges can disappear as markets change.
- Overconfidence in patterns leads to oversized positions.
- Small samples produce misleading results.
Important Terminology
| Term | Meaning |
|---|---|
| Predictive value | How much a pattern improves the odds of a direction. |
| Hindsight bias | Seeing outcomes as more obvious after they happen. |
| Sample size | The number of examples in a test. |
| Out-of-sample test | Checking results on data not used to build the rules. |
| Edge | A small, repeatable advantage after costs. |
Do candlestick patterns work?
Only slightly, in our tests. Pooled reversal patterns (pin bars, engulfing, tweezers and stars) beat the same trade on any candle by 0.03 to 0.12R per trade, before costs, on about two years of daily data and six months of hourly data. That is weak evidence, not a reliable signal. Independent research has reached mixed conclusions too.
What is the most reliable candlestick pattern?
There's no universally most reliable pattern. Results depend on definition, market, timeframe and context.
Why do candlestick patterns fail?
A candle only summarises one period; news, larger players, other timeframes and randomness affect what comes next.
Should I trust candlestick success-rate statistics?
Only if you know how patterns were defined, which data was tested, whether costs were included and whether results held on new data.
How can I find out if a pattern works for me?
Define it strictly, add your context rules, and backtest every instance with costs before trading it.
Does waiting for confirmation make candlestick patterns more reliable?
It depended on the timeframe in our data. Waiting for a confirming close improved hourly results (for example from −0.10R to −0.01R for bullish patterns) but worsened daily results, partly because the later entry with the same stop increases the risk per trade.
How many losses in a row should I expect with candlestick patterns?
With a win rate around one in three, as most patterns had in our tests with 2R targets, a run of eight losses in a row is more likely than not over 100 trades. Size positions so that such a streak is survivable.
Practical Exercise
Test one pattern honestly.
Your task
Step 1: Pick one pattern
Engulfing, pin bar or morning star.
Step 2: Write strict rules
For the pattern and its context.
Step 3: Log thirty instances
Using bar replay on daily charts.
Step 4: Compare
All instances versus those meeting the context rules.
Check Your Understanding
A candlestick pattern is best treated as:
Related Lessons
Previous: Candlestick Patterns and Market Structure. Next: Candlestick Trading Setups. See also How to Backtest.