Piercing Line and Dark Cloud Cover Patterns
JustWolves is an educational platform and is not a SEBI-registered investment advisor. Trading financial instruments involves significant risk of loss and may not be suitable for all investors. Past performance is not indicative of future results. Read our full disclaimer →
What you'll learn
- Piercing line: after a decline, a bullish candle opens below the prior close and closes above the midpoint of the prior red body
- Dark cloud cover: after a rise, a bearish candle opens above the prior close and closes below the midpoint of the prior green body
- The 50% penetration of the first body is the key rule
- They're partial versions of engulfing patterns and generally treated as somewhat weaker
- Gaps make the classic forms rare on continuous markets like forex
In this article · 17 sections
Between the harami, where the second candle barely moves, and the engulfing pattern, where it covers the first body entirely, sit two patterns where the second candle reverses more than half of the first. After a fall, it's called a piercing line; after a rise, dark cloud cover. This lesson covers both, the 50% rule that defines them, and how to trade them.
What You Will Learn
- How the piercing line and dark cloud cover form
- Why the 50% penetration rule matters
- How they compare with engulfing patterns
- How to trade them
Before You Start
Read Bullish and Bearish Engulfing Patterns and Harami Patterns first.
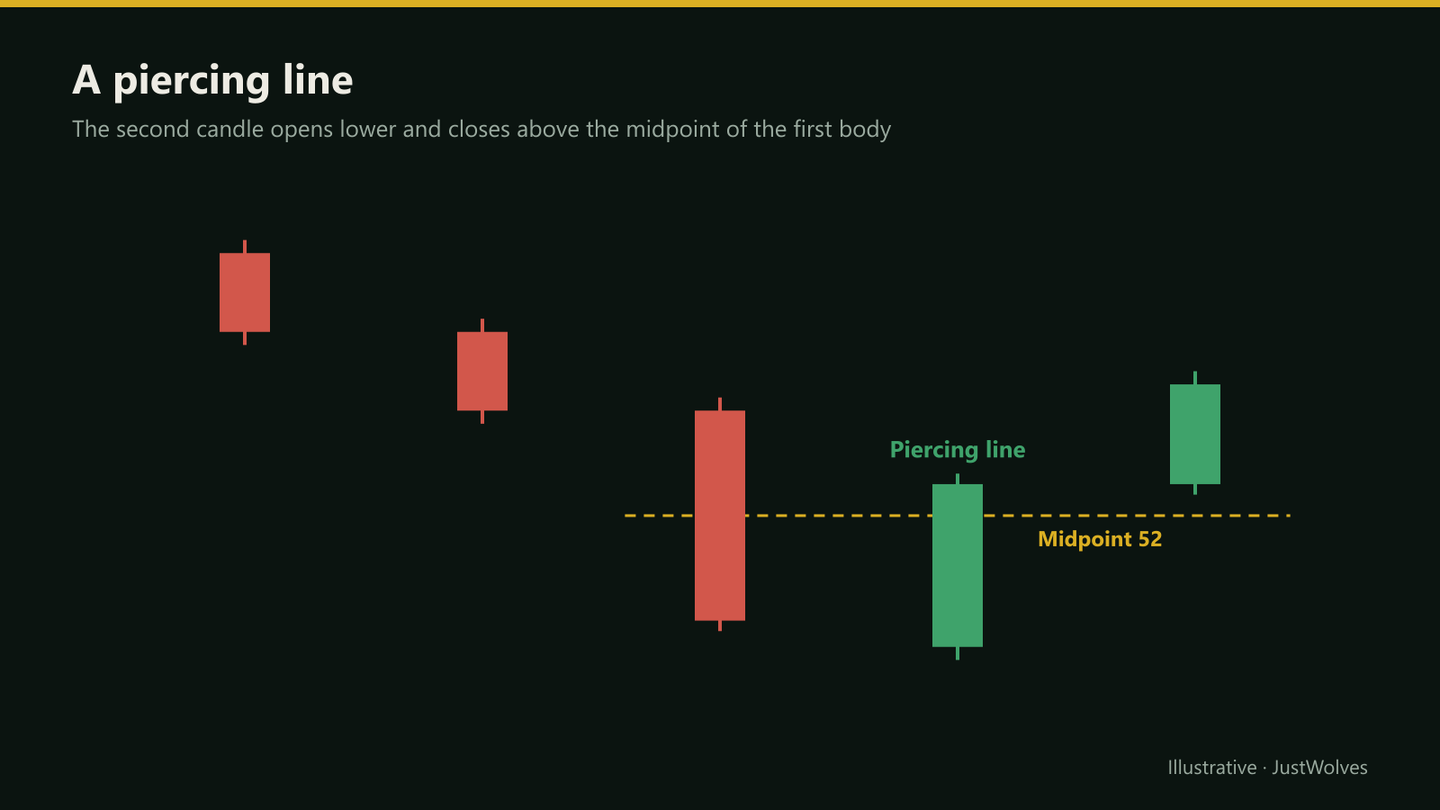
Piercing Line
- Appears after a decline.
- First candle: a large bearish candle.
- Second candle: opens below the first candle's close (in the classic form, below its low), then rallies to close above the midpoint of the first body, but not above its open.
Dark Cloud Cover
- Appears after a rise.
- First candle: a large bullish candle.
- Second candle: opens above the first candle's close (classically above its high), then falls to close below the midpoint of the first body, but not below its open.
The name describes the picture: a dark (bearish) candle covering part of the bright (bullish) one.
The 50% Rule
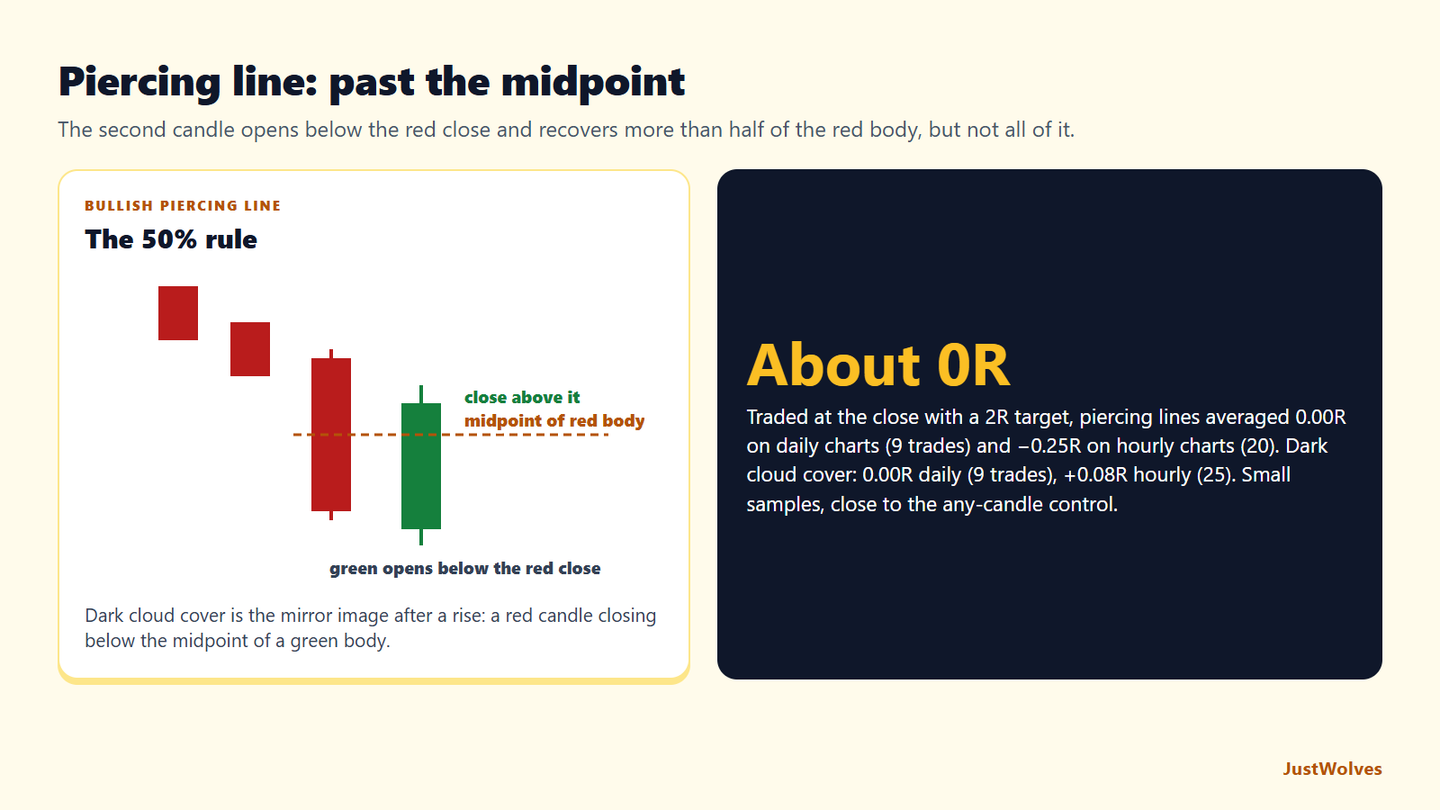
The midpoint of the first body is the dividing line. A second candle that closes beyond it has reversed more than half of the previous period's move, which shows a meaningful shift. One that closes short of the midpoint is usually considered too weak to qualify.
If the second candle closes beyond the first candle's open, the pattern has become an engulfing pattern.
| Pattern | Second candle closes | General strength |
|---|---|---|
| Harami | Inside the first body | Weakest: a stall |
| Piercing line | Above the first body's midpoint | Moderate |
| Engulfing | Above the first body's open | Stronger |
Gaps and Different Markets
The classic forms need the second candle to open beyond the first candle's close. That's common in stocks and indices, which close overnight. In forex and crypto, which trade almost continuously, a candle usually opens at the previous close, so many traders relax the rule and only require the 50% penetration.
On Indian stocks, gaps are frequent after results or global news. A gap down followed by a recovery above the midpoint of the previous red candle is a textbook piercing line.
Trading the Patterns
Piercing line at support
Step 1: Context
A decline into a marked support level.
Step 2: Pattern
Second candle closes above the first body's midpoint.
Step 3: Confirmation (optional)
A close above the first candle's open strengthens it.
Step 4: Stop
Below the pattern's low.
Step 5: Target
The next resistance level.
Real Case: A Piercing Line on NIFTY 50
The chart below uses real daily candles for NIFTY 50 from February and March 2026. Step through it to see a near-perfect piercing line after a steep fall, the rally that followed, and how two overnight gaps turned a promising trade into a loss larger than the planned risk.
Real case: a piercing line that nearly reached 1R, NIFTY 50, March 2026
Step 1 of 5
A steep decline
NIFTY 50 falls from 25,496.6 on 26 February 2026 to 23,151.1 on 13 March, about 2,350 points in two and a half weeks. The 13 March candle is a large red one, from 23,462.5 down to 23,151.1.
- What to observe
- Sellers in control, a large red body at the low.
- Condition
- Watch for a reversal pattern.
Two lessons come out of this example. First, a pattern that meets every rule can still fail; the piercing line here was large, came after a clear decline, and penetrated 83% of the red body. Second, on instruments that close overnight, a stop is not a guaranteed exit price. When the market opens beyond your stop, you are filled at the open, so a planned 1R loss can become 1.2R or worse. Size positions with that in mind, especially when holding through news or global events.
Dark Cloud Cover in Practice
At resistance after a rally, a dark cloud cover forms when a red candle opens above the previous green close, often on a gap, then sells off to close below the midpoint of the green body. Many traders wait for the next candle to close below the pattern's low before shorting, with the stop above the pattern's high. The deeper the red close into the green body, the more weight the pattern is usually given.
How Do These Patterns Perform? Our Test
JustWolves tested both patterns on about two years of real daily candles for 20 large NSE stocks, NIFTY 50, four currency pairs and gold, and six months of hourly candles for the five markets. Piercing line: after a fall of at least 1.5 average ranges, a red candle with a body of at least one average range, followed by a candle that opens at or below its close and closes above its body's midpoint but below its open. Dark cloud cover: the mirror image after a rise, tested on mirrored prices. Trades: at the second candle's close, stop just beyond the pattern's extreme, 2R target.
| Setup | Daily | Hourly |
|---|---|---|
| Piercing line, at the close | 9 trades, 33% wins, 0.00R | 20 trades, 25% wins, −0.25R |
| Dark cloud cover, at the close | 9 trades, 33% wins, 0.00R | 25 trades, 36% wins, +0.08R |
| Control: any candle, same trade | about 2,200 trades, −0.02 to −0.03R | about 2,500 trades, −0.07 to −0.10R |
The first thing to notice is how rare these patterns are when defined strictly: only nine of each on two years of daily data across 25 markets. Most two-candle reversals either fall short of the midpoint (a harami-like pause) or go past the first open (an engulfing pattern). The narrow band in between is small.
On those small samples, neither pattern did meaningfully better than the control. Daily results broke exactly even; hourly piercing lines lost a quarter of the risk per trade. That does not mean the patterns are useless. It means that, like the engulfing and harami patterns in earlier lessons, the shape alone does not give an edge, and the context described in this lesson (a clear prior move, a marked level, and ideally confirmation from the next candle) has to do the work.
Practical Example
Hypothetically, an IT stock falls into support near ₹1,400. A red candle runs from ₹1,452 to ₹1,410. After weak overnight cues, the next session opens at ₹1,398, then rallies to close at ₹1,438, above the midpoint of ₹1,431. The session low is ₹1,392.
Ishaan buys at ₹1,440 the next morning, with a stop at ₹1,385 below the pattern's low, targeting ₹1,520 at the prior swing high: ₹55 of risk for ₹80 of reward.
Measuring Real Patterns
Measuring penetration precisely is the habit this lesson's exercise asks for. Here are the two patterns from real charts: the NIFTY 50 piercing line above, and a dark cloud cover on Mahindra & Mahindra in October 2025.
| Measure | Calculation | Result |
|---|---|---|
| First (red) body | 23,462.5 − 23,151.1 | 311.4 points |
| Midpoint of the red body | (23,462.5 + 23,151.1) ÷ 2 | 23,306.8 |
| Second candle opens below the red close | 23,116.1 < 23,151.1 | Yes, by 35 points |
| Second close vs midpoint and open | 23,306.8 < 23,408.8 < 23,462.5 | Above the midpoint, below the open |
| Penetration of the red body | (23,408.8 − 23,151.1) ÷ 311.4 | 83% |
| Measure | Calculation | Result |
|---|---|---|
| First (green) body | 3,647.2 − 3,561.0 | 86.2 points |
| Midpoint of the green body | (3,561.0 + 3,647.2) ÷ 2 | 3,604.1 |
| Second candle opens above the green close | 3,674.0 > 3,647.2 | Yes, a gap up of 27 points |
| Second close vs midpoint and open | 3,561.0 < 3,599.1 < 3,604.1 | Below the midpoint, above the open |
| Penetration of the green body | (3,647.2 − 3,599.1) ÷ 86.2 | 56% |
The M&M pattern only just qualified: the close was 5 points below the midpoint. A short at the close, 3,599.1, with a stop at 3,683 above the pattern's high, risked about 84 points. The stock fell to 3,483.7 by 31 October, roughly +1.4R, but did not reach the 2R target before bouncing back to 3,633 on 4 November. The NIFTY 50 piercing line was much deeper (83%) and still failed. Penetration depth is worth recording, but in neither case did it decide the outcome on its own.
Common Mistakes
- Accepting closes below the midpoint.
- Ignoring the gap requirement without adjusting for market type.
- Trading the pattern mid-range.
- Confusing it with engulfing, which closes beyond the open.
- Stops inside the pattern.
Professional Insight
Rather than memorising three separate patterns, many experienced traders simply ask how much of the previous candle's move the next candle reversed. Under half suggests stalling; over half suggests a shift; all of it suggests a strong shift. The names are shorthand for that question.
Risk Considerations
- Two-candle patterns often need the third candle for confirmation.
- Gap-driven patterns can be news-driven and unstable.
- Counter-trend use fails more often.
Important Terminology
| Term | Meaning |
|---|---|
| Piercing line | Bullish two-candle pattern closing above the first body's midpoint. |
| Dark cloud cover | Bearish two-candle pattern closing below the first body's midpoint. |
| Penetration | How far the second candle closes into the first body. |
| Gap | An open away from the previous close. |
| Midpoint | Halfway between a body's open and close. |
What is a piercing line pattern?
A bullish two-candle pattern after a decline where the second candle opens lower and closes above the midpoint of the first red body.
What is dark cloud cover?
The bearish mirror: after a rise, a red candle opens higher and closes below the midpoint of the previous green body.
What is the difference between piercing line and bullish engulfing?
Both open below the previous red close. A piercing line closes above the red body's midpoint but below its open; a bullish engulfing pattern closes above the red open, covering the whole body.
Does the piercing line need a gap?
The classic definition requires an open below the previous close. In continuous markets like forex, many traders relax this.
How reliable is dark cloud cover?
Like other patterns, it depends on context. Test it at your own levels and markets.
Is the piercing line pattern reliable?
Not on its own in our data. Strictly defined piercing lines were rare (9 on two years of daily data across 25 markets) and broke even when traded at the close with a 2R target. On hourly charts they averaged −0.25R over 20 trades.
Can a stop loss fail on a piercing line trade?
A stop can be filled worse than planned when the market gaps. In a real NIFTY 50 example from March 2026, the index opened below the stop, turning a planned 1R loss into about 1.2R.
Practical Exercise
Measure penetration.
Your task
Step 1: Find ten two-candle reversals
At support or resistance.
Step 2: Measure
How much of the first body did the second candle reverse?
Step 3: Classify
Harami, piercing/dark cloud, or engulfing.
Step 4: Compare outcomes
Did deeper penetration lead to better follow-through in your sample?
Check Your Understanding
A piercing line closes:
Related Lessons
Previous: Harami Patterns. Next: Tweezer Tops and Bottoms. See also Bullish and Bearish Engulfing Patterns.