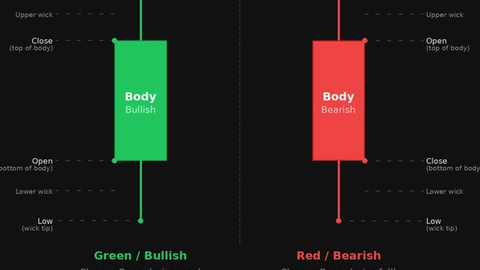
Bullish vs Bearish Candles and Candle Strength
JustWolves is an educational platform and is not a SEBI-registered investment advisor. Trading financial instruments involves significant risk of loss and may not be suitable for all investors. Past performance is not indicative of future results. Read our full disclaimer →
What you'll learn
- Colour shows direction; body size, wicks and close location show strength
- Close location: where the close sits in the high–low range; near the high is bullish, near the low bearish
- Long bodies with small wicks show control; small bodies with long wicks show contest
- Sequences matter more than single candles: growing or shrinking bodies show changing momentum
- A candle means most at a meaningful level; in the middle of a range it says little
In this article · 16 sections
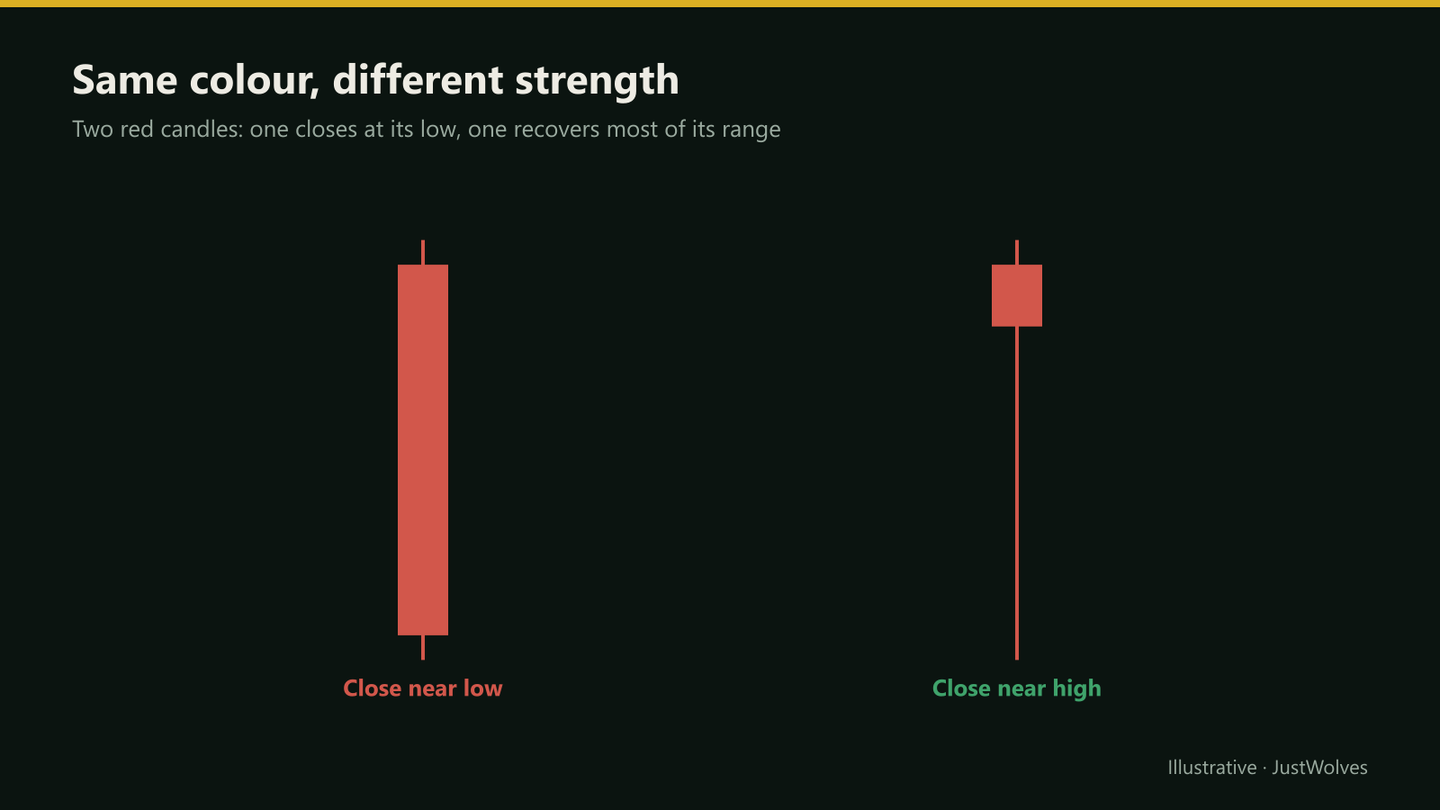
A green candle is not automatically bullish, and a red one isn't automatically bearish. A red candle that recovered most of a deep drop tells a very different story from one that closed at its low. This lesson shows how to judge a candle's strength from its body, wicks and close location, and how to read sequences of candles for momentum.
What You Will Learn
- Why colour alone is misleading
- How to judge strength from body, wicks and close location
- How candle sequences show momentum
- Why location matters
Before You Start
Read Candlestick Anatomy first.
Beyond Colour
Colour answers one question: did the period close above or below its open? It doesn't tell you how far price travelled, how much of that move was kept, or what happened in between. Three more features fill in the picture: body size, wick length and close location.
Three Measures of Strength
| Measure | How to read it | Strong bullish example |
|---|---|---|
| Body size | Body as a share of the full range; compare with recent candles | Body fills most of the range and is larger than recent bodies |
| Wicks | Long wicks show prices rejected in that direction | Little or no upper wick |
| Close location | Where the close sits between the low and high | Close in the top quarter of the range |
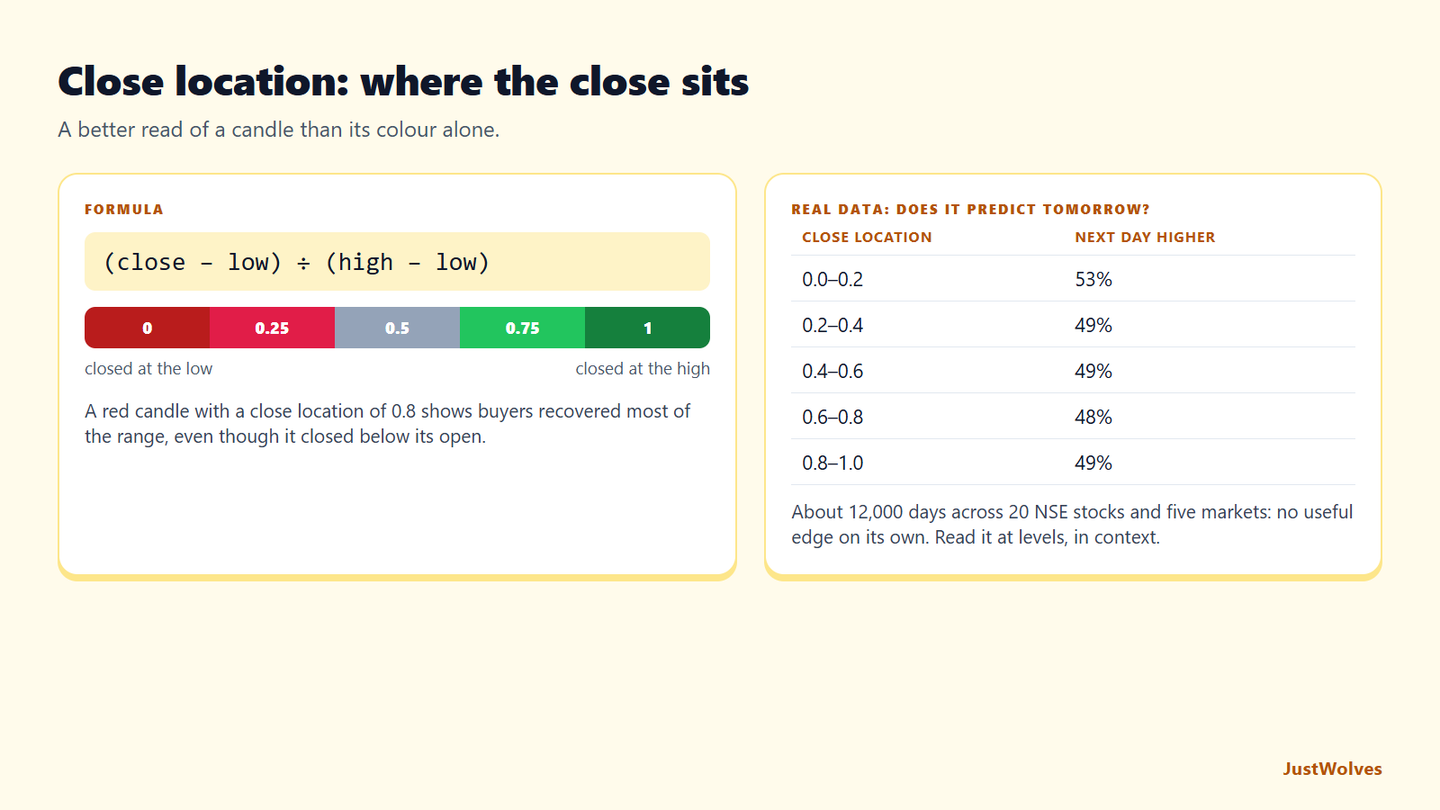
Close location is simple to calculate: (close − low) ÷ (high − low). A value near 1 means the close was near the high; near 0, near the low. A red candle with a close location of 0.8 shows buyers recovered most of the range, even though the candle closed below its open.
Common Candle Types by Strength
- Strong trend candle: large body, small wicks, close near the extreme. One side controlled the period.
- Indecision candle: small body, wicks on both sides. Neither side won.
- Rejection candle: long wick on one side, close near the opposite end. One side pushed and was driven back.
- Weak trend candle: body in the trend direction but a long wick against it. Progress was made but partly given back.
Reading Sequences
Single candles are noisy; sequences are more informative. In a rally, a run of growing green bodies with closes near the highs shows accelerating buying. If the bodies start shrinking and upper wicks lengthen, the rally is losing force, one of the exhaustion signs from Reversals, Momentum and Exhaustion.
Overlap matters too. When each candle opens and closes within the previous one's range, price is going nowhere. When candles open near the previous close and keep pushing, the move has momentum.
Real Case: Reading Beyond Colour
The chart below uses real daily candles for Titan from January and February 2026. Step through it to see a red candle that was really a sign of buying, and how the next candle confirmed it.
Real case: a red candle that was not bearish, Titan, January–February 2026
Step 1 of 4
A steady decline
Titan falls from 4,312 in early January to around 3,965 by 28 January. Most candles are red and close in the lower part of their range: sellers in control.
- What to observe
- Red candles with low close locations.
- Condition
- No reason to buy yet.
Candles and Timeframes
Strength is always relative to the timeframe you're reading. A daily candle with a close location of 0.9 summarises a whole session in which buyers held the high ground at the close. A 5-minute candle with the same shape summarises five minutes, and is much more easily reversed by the next few candles.
For that reason, many traders judge candle strength on the timeframe where they marked their levels, often the daily or 4-hour chart, and only use smaller timeframes to time the entry. A strong 5-minute candle against a weak daily picture usually deserves less weight than the other way round.
Does Close Location Predict the Next Day? Our Test
JustWolves measured close location on about 12,000 real trading days across 20 large NSE stocks, NIFTY 50, four major currency pairs and gold, and checked whether the next day closed higher.
| Close location | Days | Next day closed higher | Average next-day move |
|---|---|---|---|
| 0.0–0.2 (closed near the low) | 2,522 | 53% | +0.05 ATR |
| 0.2–0.4 | 2,528 | 49% | −0.02 ATR |
| 0.4–0.6 | 2,147 | 49% | 0.00 ATR |
| 0.6–0.8 | 2,363 | 48% | −0.03 ATR |
| 0.8–1.0 (closed near the high) | 2,463 | 49% | +0.02 ATR |
On its own, close location did not predict the next day. Candles that closed near their highs were followed by a higher close 49% of the time; candles that closed near their lows were, if anything, slightly more often followed by a bounce. That is not a flaw in the reading; it is what this lesson's warning box says. A candle describes what happened in one period. It becomes useful when it appears at a level, after a meaningful move, and is confirmed by what comes next, as in the Titan example above.
Practical Example
Hypothetically, Nifty has support near 23,900. On Monday, it opens at 24,040, trades as high as 24,060, drops to 23,880 and closes at 24,010: a red candle, but the close location is (24,010 − 23,880) ÷ (24,060 − 23,880) ≈ 0.72, with a long lower wick into support.
On Tuesday, it opens at 24,010 and closes at 24,150 near its high with a large body. Read together: Monday showed buyers defending support despite the red colour; Tuesday showed them taking control. Priya notes this as a possible long setup and moves on to check the trend and her risk.
A Simple Candle Scorecard
To make candle reading consistent, score each candle you care about on the same three measures. For example, for a bullish read:
| Measure | 0 points | 1 point | 2 points |
|---|---|---|---|
| Body as share of range | Under 30% | 30–60% | Over 60%, bullish |
| Close location | Under 0.4 | 0.4–0.7 | Over 0.7 |
| Location on the chart | Middle of a range | Near a minor level | At a marked support level |
A score of 5 or 6 describes a strong candle at a good place; 0 to 2 describes one you can ignore. The value is not in the number itself but in reading every candle the same way, so that your journal shows whether your high-scoring candles actually behaved differently from the rest.
Common Mistakes
- Judging by colour alone.
- Comparing body sizes across different instruments instead of against recent candles.
- Reading every candle, rather than those at meaningful levels.
- Ignoring the sequence around a candle.
- Expecting a strong candle to guarantee follow-through.
Professional Insight
Many professional traders say they don't memorise pattern names so much as read pressure: who pushed, how far, and who held the close. Named patterns are useful shorthand for situations that this kind of reading already describes.
Risk Considerations
- Strong candles can be fully reversed the next period.
- News-driven candles may not reflect sustained interest.
- Lower timeframes produce more misleading candles.
Important Terminology
| Term | Meaning |
|---|---|
| Close location | Where the close sits in the range, from 0 (low) to 1 (high). |
| Trend candle | A large-bodied candle closing near its extreme. |
| Indecision candle | A small body with wicks on both sides. |
| Rejection candle | A long wick on one side, close near the other. |
| Overlap | How much a candle's range covers the previous one. |
How do I read a candlestick?
Check the colour for direction, then the body size, wick lengths and where the close sits in the range to judge strength.
Is a red candle always bearish?
No. A red candle with a long lower wick and a close near its high shows buyers recovered most of the period's drop.
What is a strong bullish candle?
One with a large body relative to recent candles, little upper wick and a close near the high.
What does a small body with long wicks mean?
Indecision: price moved both ways and ended near where it started.
Do I need to memorise candlestick patterns?
Understanding body, wicks and close location explains most patterns. Pattern names are useful shorthand, covered later in this course.
Does a candle that closes near its high mean the price will rise tomorrow?
Not reliably. In our study of about 12,000 real trading days, candles closing in the top fifth of their range were followed by a higher close only 49% of the time. Close location describes a candle; location and confirmation decide whether it matters.
Practical Exercise
Score ten candles.
Your task
Step 1: Pick ten daily candles
At or near marked support and resistance levels.
Step 2: Calculate close location
For each one.
Step 3: Classify
Trend, indecision, rejection or weak trend.
Step 4: Check the next candle
Did it follow the strength you read?
Check Your Understanding
Colour tells you:
Related Lessons
Previous: Candlestick Anatomy. Next module: Doji Candlestick Patterns. See also Price Rejection.