Inverted Hammer and Shooting Star Candlestick Patterns
JustWolves is an educational platform and is not a SEBI-registered investment advisor. Trading financial instruments involves significant risk of loss and may not be suitable for all investors. Past performance is not indicative of future results. Read our full disclaimer →
What you'll learn
- Both have a small body near the bottom of the range and a long upper wick
- A shooting star forms after a rise and suggests buyers were rejected
- An inverted hammer forms after a decline; it shows an attempt to rally and needs stronger confirmation
- They are the upside-down versions of the hanging man and hammer
- Trade them at key levels, after confirmation, with the stop beyond the wick
In this article · 16 sections
Flip a hammer upside down and you get a candle with a small body at the bottom and a long upper wick. After a rally, it's called a shooting star and is widely read as a bearish warning. After a decline, it's an inverted hammer, an early and weaker hint that buyers are trying to push back. This lesson covers both and how to trade them in context.
What You Will Learn
- The shape rules for a shooting star and inverted hammer
- Why the same shape means different things
- How to confirm and trade each
- Where they commonly fail
Before You Start
Read Hammer and Hanging Man first.
The Shape
- Small body in the lower part of the range.
- Long upper wick, commonly at least about twice the body.
- Little or no lower wick.
- Colour is secondary; a red shooting star and a green inverted hammer are often treated as slightly stronger.
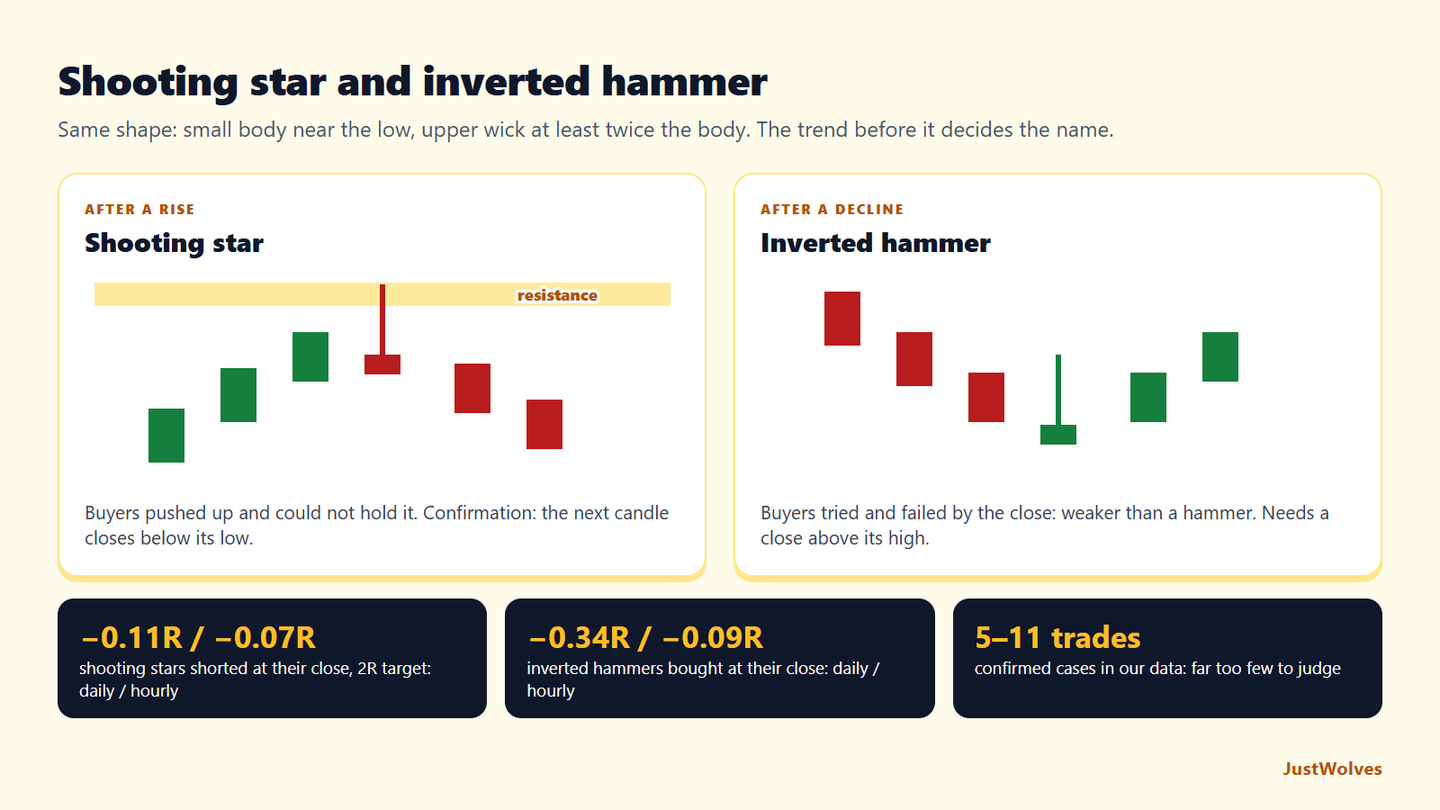
Shooting Star: After a Rise
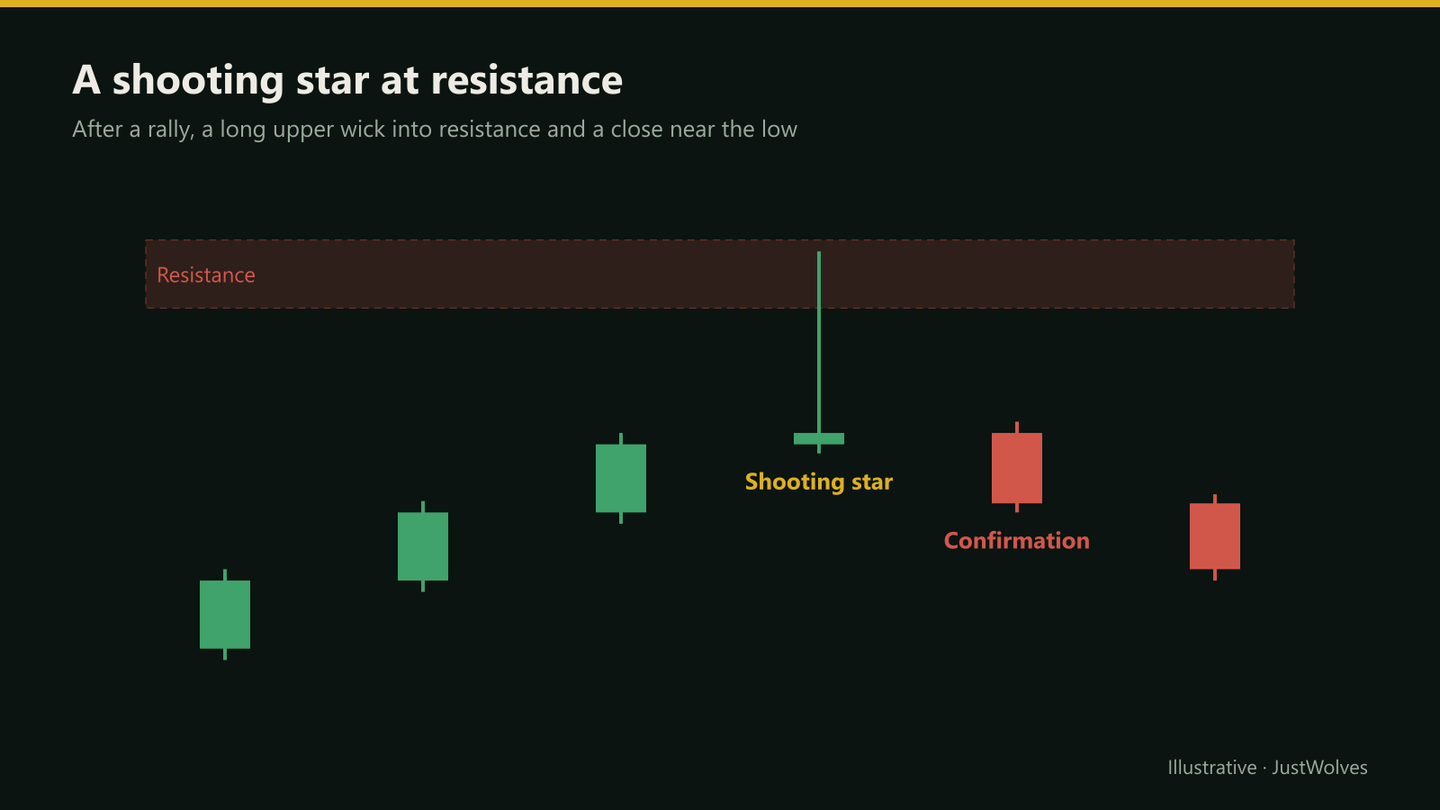
A shooting star forms after an advance. Buyers pushed price well above the open, then sellers drove it back down to close near the low. The long upper wick marks prices buyers couldn't hold.
At resistance, a shooting star suggests buying is meeting strong supply. It's the mirror image of the hammer.
Inverted Hammer: After a Decline
An inverted hammer is the same shape after a fall. Buyers tried to rally, but sellers pushed price back to near the open by the close. That makes it a weaker signal than the regular hammer, where buyers actually held the recovery.
Because of that, many traders only consider it with strong confirmation: the next candle opening higher and closing above the inverted hammer's high.
Trading the Shooting Star
Shooting star at resistance
Step 1: Context
A rally into a marked resistance level or supply zone.
Step 2: The candle
Upper wick into the level, close in the lower part of the range.
Step 3: Confirmation
The next candle closes below the shooting star's low.
Step 4: Entry and stop
Enter on the confirmation close; stop above the wick's high.
Step 5: Target
The next support level.
Real Case: A Shooting Star on Sun Pharma
The chart below uses real daily candles for Sun Pharma from March and April 2025. Step through it to see a textbook shooting star at a new high, its confirmation, and how close the trade came to both its stop and its target.
Real case: a confirmed shooting star, Sun Pharma, March–April 2025
Step 1 of 5
A strong rally
Sun Pharma rises from 1,553 on 5 March 2025 to 1,793 by 21 March, a new 20-day high.
- What to observe
- A rise of about 15% in two weeks.
- Condition
- An upper-wick candle here would be a shooting star.
Related Shapes
| Candle | Body | Usual context |
|---|---|---|
| Shooting star | Small, near the low | After a rise |
| Inverted hammer | Small, near the low | After a decline |
| Gravestone doji | Almost none, at the low | Either; strongest after a rise |
| Bearish pin bar | Small, near the low | General term regardless of trend |
These are variations of one idea: price pushed up and couldn't stay there. Two details can strengthen the reading. First, a shooting star that opens with a gap above the previous close and then fails shows buyers' enthusiasm evaporating within one session. Second, above-average volume on the candle suggests the rejection involved real participation rather than thin trading.
Neither detail is required, and neither guarantees anything. They simply add evidence when they're present. The same applies in reverse to the inverted hammer: a gap down that recovers part of the way, on heavier volume, at a well-marked support level, is a more interesting inverted hammer than one that forms quietly in the middle of a decline. Even then, wait for the next candle to show that buyers can actually hold higher prices.
How Did These Patterns Perform? Our Test
JustWolves tested both patterns on about two years of real daily candles for 20 large NSE stocks, NIFTY 50, four currency pairs and gold, and six months of hourly candles for the five markets. Shape: upper wick at least twice the body, little lower wick, close in the lower part of the range. Shooting star: after a rise of at least 1.5 average ranges over five candles; inverted hammer: after a fall of the same size. Trades: 2R targets with the stop beyond the wick, entered at the pattern's close or after confirmation. As a control, the same trade was taken on ordinary candles.
| Setup | Daily | Hourly |
|---|---|---|
| Shooting star, short at its close | 37 trades, 30% wins, −0.11R | 45 trades, 31% wins, −0.07R |
| Shooting star at a 20-candle high | 22 trades, 36% wins, +0.09R | 29 trades, 31% wins, −0.07R |
| Shooting star, after confirmation | 11 trades, 45% wins, +0.36R | 9 trades, 22% wins, −0.33R |
| Inverted hammer, long at its close | 32 trades, 22% wins, −0.34R | 46 trades, 30% wins, −0.09R |
| Inverted hammer, after confirmation | 11 trades, 45% wins, +0.36R | 5 trades, 20% wins, −0.40R |
| Control: any candle, same trade | about 2,200 trades, 32–33% wins, −0.02 to −0.03R | about 2,500 trades, 30–31% wins, −0.07 to −0.10R |
Entered at their close, both patterns did no better than the control, and the inverted hammer did clearly worse on daily charts. That matches this lesson's warning that the inverted hammer is the weaker of the two: buyers' push failed by the close.
Confirmed patterns looked good on daily charts and bad on hourly charts, but each figure rests on 5 to 11 trades, which is far too few to mean anything. The honest summary is that the shape alone is not an edge; location at a real level, confirmation and a reward of at least 2R are what turn it into a structured trade, and only your own log can show whether that structure works in your market.
Practical Example
Hypothetically, Bank Nifty rallies from 51,200 to 52,350 in four sessions into resistance at 52,450–52,550. The fifth session opens at 52,360, rallies to 52,560 and closes at 52,330: a shooting star with a 200-point upper wick.
The next day closes at 52,180, below the shooting star's low of 52,300. Imran shorts Bank Nifty futures at 52,180 with a stop at 52,600, above the wick, targeting support at 51,500: 420 points of risk for 680 points of reward.
Measuring a Shooting Star
| Measure | Calculation | Result |
|---|---|---|
| Range | 1,820.0 − 1,777.6 | 42.4 |
| Body | 1,794.5 − 1,784.8 (bearish) | 9.7 (23% of range) |
| Upper wick | 1,820.0 − 1,794.5 | 25.5 (2.6 × body) |
| Lower wick | 1,784.8 − 1,777.6 | 7.2 |
| Close location | (1,784.8 − 1,777.6) ÷ 42.4 | 0.17 |
Measure every candidate the same way. A candle whose upper wick is only slightly longer than its body, or which closes in the middle of its range, is a weak example even if it looks similar at a glance. Writing the numbers down for each trade also makes your journal far more useful when you review which shapes actually worked for you.
Common Mistakes
- Calling a shooting star mid-trend with no level.
- Treating the inverted hammer as strongly bullish on its own.
- Entering before confirmation.
- Stops inside the wick.
- Fighting a strong uptrend on one candle.
Professional Insight
Experienced traders often look for the shooting star's upper wick to poke above an obvious level, such as a prior high, then close back below. That combination of a failed break and a rejection candle is more convincing than the shape alone.
Risk Considerations
- Long wicks mean wide stops; size the position down.
- Strong trends often absorb single rejection candles.
- Gaps can open beyond the wick.
Important Terminology
| Term | Meaning |
|---|---|
| Shooting star | Small body low, long upper wick, after a rise. |
| Inverted hammer | The same shape after a decline. |
| Upper wick | From the top of the body to the high. |
| Supply | Selling interest at a price area. |
| Confirmation | The next candle closing in the expected direction. |
What is a shooting star candlestick?
A candle with a small body near its low and a long upper wick, appearing after a rise, which suggests buyers were rejected.
What is an inverted hammer?
The same shape after a decline, showing an attempt to rally that wasn't held by the close.
Is a shooting star bearish?
It's a bearish warning at resistance after a rise, but it needs confirmation and fails often in strong uptrends.
What is the difference between a shooting star and a gravestone doji?
A gravestone doji has almost no body; a shooting star has a small but visible body.
Where does the stop go on a shooting star trade?
Above the high of the upper wick, with a small buffer.
Is the shooting star a reliable reversal pattern?
Not on its own in our data. Shooting stars shorted at their close averaged −0.11R on daily charts and −0.07R on hourly charts with a 2R target, about the same as the same trade on any candle. Confirmation looked helpful but rested on too few trades to rely on.
Why is the inverted hammer weaker than the hammer?
Because buyers' push failed by the close. In our daily data, inverted hammers bought at their close averaged −0.34R, clearly worse than hammers, which supports waiting for a close above the inverted hammer's high.
Practical Exercise
Compare the two.
Your task
Step 1: Find five shooting stars
At resistance after rallies.
Step 2: Find five inverted hammers
At support after declines.
Step 3: Track the next three candles
Did price follow the expected direction?
Step 4: Compare
Which needed confirmation more often in your sample?
Check Your Understanding
A shooting star has:
Related Lessons
Previous: Hammer and Hanging Man. Next: Marubozu Candles. See also Doji Candlestick Patterns.