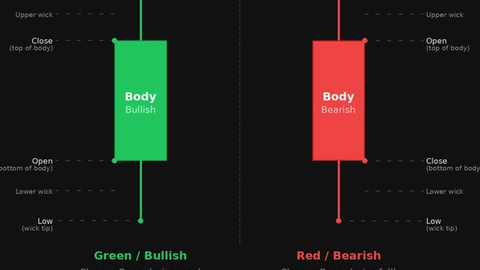
Marubozu Candles: Full-Body Momentum Candles
JustWolves is an educational platform and is not a SEBI-registered investment advisor. Trading financial instruments involves significant risk of loss and may not be suitable for all investors. Past performance is not indicative of future results. Read our full disclaimer →
What you'll learn
- A marubozu has a full body with no or very small wicks
- Bullish: opens at the low and closes at the high; bearish: the reverse
- It shows one side controlled the whole period
- Most useful as confirmation of a breakout or of trend strength
- A very large marubozu after a long run can also mark a climax; context decides
In this article · 16 sections
Most candles show some back-and-forth: a wick where one side pushed and was pushed back. A marubozu has almost none. It opens at one extreme and closes at the other, which shows one side controlled the entire period. This lesson explains how to read marubozu candles, where they're useful, and when a huge full-body candle is more of a warning than a signal.
What You Will Learn
- What a marubozu is
- Bullish and bearish marubozu
- How to use them for breakouts and trend strength
- When a marubozu warns of exhaustion
Before You Start
Read Inverted Hammer and Shooting Star first.
What a Marubozu Is
Marubozu is a Japanese term often translated as 'close-cropped' or 'bald', referring to the missing wicks. The candle's body fills the whole (or almost the whole) range.
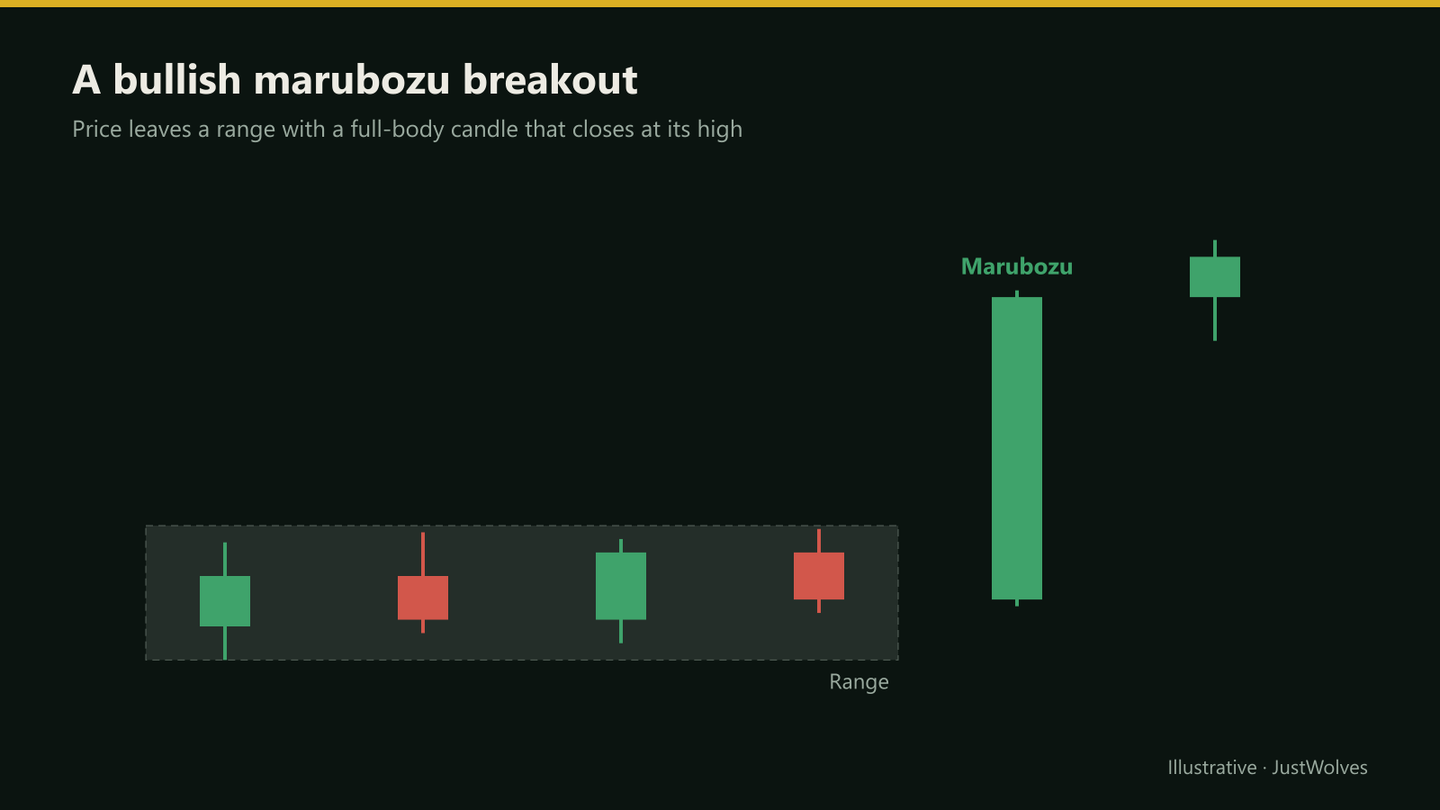
A bullish marubozu opens at or near the low and closes at or near the high. A bearish marubozu opens at or near the high and closes at or near the low. In practice, small wicks are common, and many traders still treat a candle as a marubozu when the body is the vast majority of the range.
What It Tells You
- Control: one side dominated the entire period with little pushback.
- Momentum: large marubozu candles often appear at the start of strong moves.
- Commitment: a close at the extreme means participants were still willing to transact there at the end of the period.
Where Marubozu Candles Help
| Situation | How traders read it |
|---|---|
| Breakout from a range or level | Strong evidence the breakout has participation |
| Early in a trend | Confirms momentum in the trend's direction |
| Opposite a pattern you're trading | A bearish marubozu against your long is a strong warning |
| After a long, extended run | May be a climax; watch for exhaustion |
Trading a Marubozu Breakout
Bullish example
Step 1: Level
A range high or resistance tested at least twice.
Step 2: Breakout
A bullish marubozu closes well above the level.
Step 3: Entry
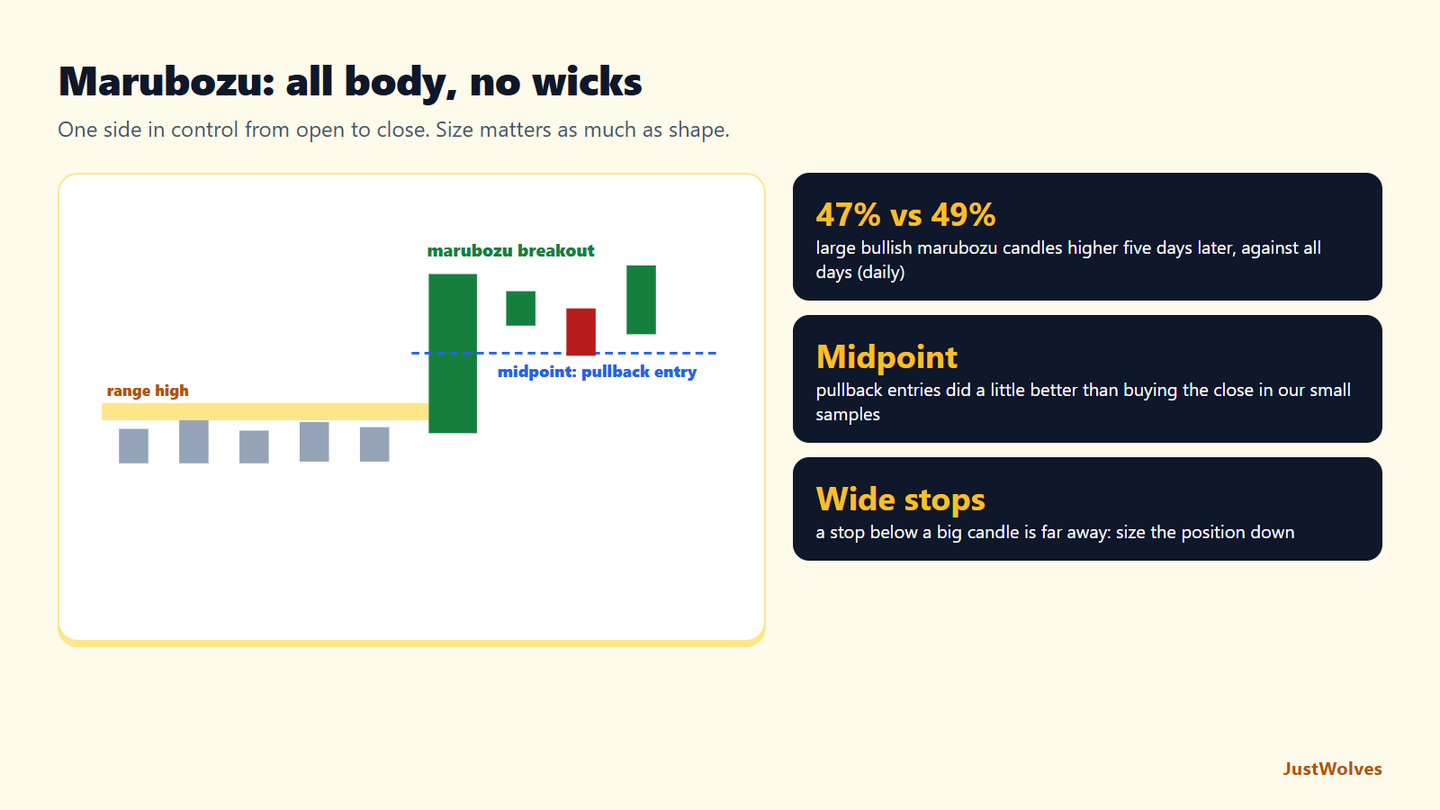
On a pullback toward the candle's midpoint or the broken level.
Step 4: Stop
Below the broken level or the candle's midpoint, depending on structure.
Step 5: Target
A measured move or the next resistance.
Real Case: A TCS Marubozu Breakout
The chart below uses real daily candles for TCS from October and November 2025. Step through it to see a marubozu break out of a three-week range, the pullback to its midpoint, and a trade that came within 5 points of its target.
Real case: a marubozu breakout and a midpoint entry, TCS, November 2025
Step 1 of 5
A three-week range
From late October to 11 November 2025, TCS trades between about 2,960 and 3,098 without making progress.
- What to observe
- A range with a clear high at 3,098.
- Condition
- Wait for a decisive close beyond it.
Variations and Relative Size
Some traders distinguish an opening marubozu, with no wick at the open end but a small wick at the close end, from a closing marubozu, with no wick at the close end. A closing marubozu is often considered stronger, because price finished the period at its extreme with no pullback at all.
Size matters as much as shape. A candle with no wicks but a body smaller than the recent average isn't showing much control; it's just a quiet period that happened to close at its extreme. A useful rule of thumb is to compare the body with the average range of the last ten to twenty candles. Bodies well above that average, closing at the extreme, are the ones worth noting.
On intraday charts of stocks, the first candle of the session often looks like a marubozu because of overnight news. Many traders give these opening candles less weight until the market settles.
Do Marubozu Candles Lead to Follow-Through? Our Test
JustWolves tested marubozu candles on about two years of real daily candles for 20 large NSE stocks, NIFTY 50, four currency pairs and gold, and six months of hourly candles for the five markets. Marubozu: a body at least 90% of the range and at least 1.5 times the average candle range.
| Timeframe | Cases | Higher 5 candles later | All candles: higher 5 candles later |
|---|---|---|---|
| Daily | 36 | 47% | 49% |
| Hourly | 100 | 45% | 49% |
Large marubozu candles were not followed by higher prices more often than ordinary candles. On daily charts the average move afterwards was positive (+0.38 of an average range, against −0.03 for all candles), but that comes from a small sample of 36 and a few large moves.
We also tested breakouts: marubozu candles that closed above the previous 20-candle high, traded with a 2R target and a stop below the candle's low.
| Entry | Daily (bullish) | Hourly (bullish) | Hourly (bearish, short) |
|---|---|---|---|
| At the close | 14 trades, 36% wins, +0.07R | 28 trades, 32% wins, −0.04R | 52 trades, 25% wins, −0.25R |
| Limit at the candle's midpoint | 7 trades, 43% wins, +0.29R | 17 trades, 35% wins, +0.06R | 41 trades, 29% wins, −0.12R |
In every group, waiting for a pullback to the midpoint did better than buying the close. The samples are small, so treat this as supporting this lesson's warning box rather than as proof: the midpoint entry halves the stop distance, so the same move is worth twice as much in R.
Practical Example
Hypothetically, an auto stock trades between ₹780 and ₹805 for three weeks. One session opens at ₹801 and closes at ₹838, its high, with a low of ₹800: a bullish marubozu breakout.
The candle's midpoint is about ₹819. Two days later, price pulls back to ₹818. Tanvi buys at ₹820 with a stop at ₹798, below the old range high, targeting ₹860, the next resistance level: ₹22 of risk for ₹40 of reward.
Measuring the TCS Marubozu
| Measure | Calculation | Result |
|---|---|---|
| Range | 3,136.4 − 3,057.1 | 79.3 |
| Body | 3,131.8 − 3,060.0 | 71.8 (90.5% of range) |
| Lower wick | 3,060.0 − 3,057.1 | 2.9 |
| Upper wick | 3,136.4 − 3,131.8 | 4.6 |
| Midpoint of body | (3,060.0 + 3,131.8) ÷ 2 | 3,095.9 |
Compare the body with recent candles, as this lesson suggests: the 14 candles before it averaged a range of roughly 42 points, so this body was about 1.7 times a normal day's full range. That relative size, together with the close above the range, is what made it worth noting, not the missing wicks alone.
Common Mistakes
- Chasing the close of a huge candle.
- Ignoring location: a marubozu after a long run may be a climax.
- Treating small-bodied candles with tiny wicks as marubozu; size relative to recent candles matters.
- Ignoring news: result-day candles can reverse quickly.
- No plan for the wide stop.
Professional Insight
Experienced traders often treat a marubozu as confirmation rather than a setup. It answers the question 'is anyone behind this move?' with a clear yes, and then they look for a lower-risk place to join.
Risk Considerations
- Wide ranges inflate position risk.
- Climactic candles can mark the end of a move, not the start.
- Gaps after a marubozu are common in stocks.
Important Terminology
| Term | Meaning |
|---|---|
| Marubozu | A candle with a full body and no or tiny wicks. |
| Bullish marubozu | Opens at the low, closes at the high. |
| Bearish marubozu | Opens at the high, closes at the low. |
| Climax | An unusually large candle at the end of an extended move. |
| Midpoint | Halfway between the candle's open and close. |
What is a marubozu candle?
A candle whose body covers all or almost all of its range, with no or very small wicks.
Is a bullish marubozu a buy signal?
It shows strong buying in that period. Many traders use it as confirmation and wait for a pullback rather than buying the close.
What does a bearish marubozu mean?
Sellers controlled the whole period, opening at the high and closing at the low.
Can a marubozu signal a reversal?
A very large one after an extended move can be a climax, which sometimes precedes a reversal.
What does marubozu mean?
It's a Japanese term often translated as 'close-cropped' or 'bald', referring to the missing wicks.
Does a marubozu candle predict the next move?
Not reliably in our data. Large bullish marubozu candles were higher five candles later 47% of the time on daily charts and 45% on hourly charts, slightly below the 49% for all candles.
Should I buy a marubozu breakout at the close or on a pullback?
In our tests, a limit order at the candle's midpoint did better than buying the close in every group, because the stop is about half as wide. Some pullbacks never come, so you will miss some trades.
Practical Exercise
Study ten marubozu candles.
Your task
Step 1: Find ten
Five at breakouts, five after long runs.
Step 2: Check the next five candles
Continuation or reversal?
Step 3: Test the midpoint
Did price pull back to the candle's midpoint, and did it hold?
Check Your Understanding
A bullish marubozu:
Related Lessons
Previous: Inverted Hammer and Shooting Star. Next: Pin Bars. See also Consolidation and Trading Ranges.