
Candlestick Anatomy: Open, High, Low, Close, Body and Wicks
JustWolves is an educational platform and is not a SEBI-registered investment advisor. Trading financial instruments involves significant risk of loss and may not be suitable for all investors. Past performance is not indicative of future results. Read our full disclaimer →
What you'll learn
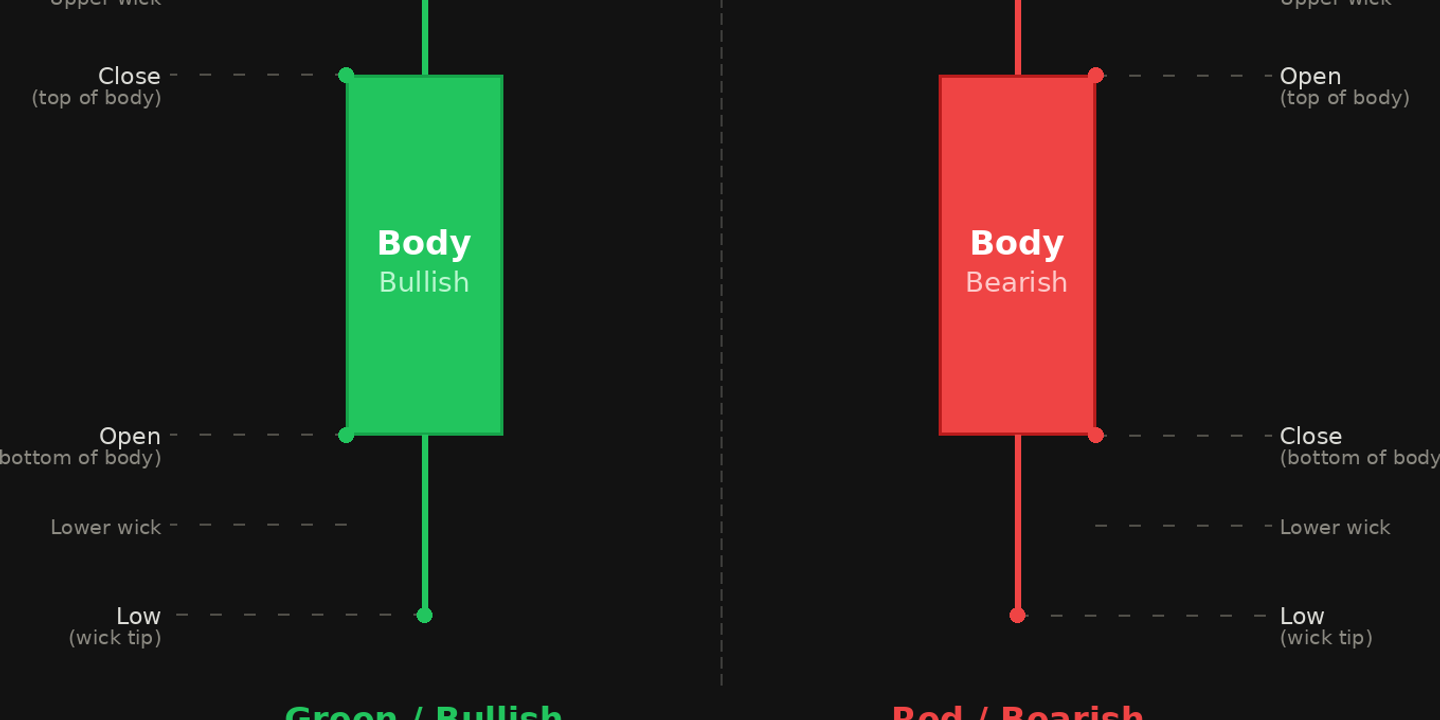
- Every candle has four prices: open, high, low and close
- The body spans the open and close; its colour shows whether the close was higher or lower
- The upper wick runs from the top of the body to the high; the lower wick from the bottom of the body to the low
- A wick shows prices that traded but weren't held by the close
- The same market produces different candles on different timeframes
In this article · 16 sections
Before you can read candlestick patterns, you need to read single candles fluently. Each candle packs four prices into one shape, and every part of that shape means something specific. This lesson takes a candle apart: the open, high, low and close, the body, and the upper and lower wicks, and shows what each part tells you about the period it represents.
What You Will Learn
- The four prices in every candle
- How the body and wicks are drawn
- What each part tells you
- How timeframe changes a candle
Before You Start
Read Candlestick Charts vs Line and Bar Charts first.
The Four Prices
| Price | Meaning |
|---|---|
| Open | The first traded price of the period |
| High | The highest traded price of the period |
| Low | The lowest traded price of the period |
| Close | The last traded price of the period |
On Indian exchanges, a stock's official daily closing price is calculated from trades in the last part of the session rather than the single final trade, so your platform's daily close may differ slightly from the last tick you saw.
The Body
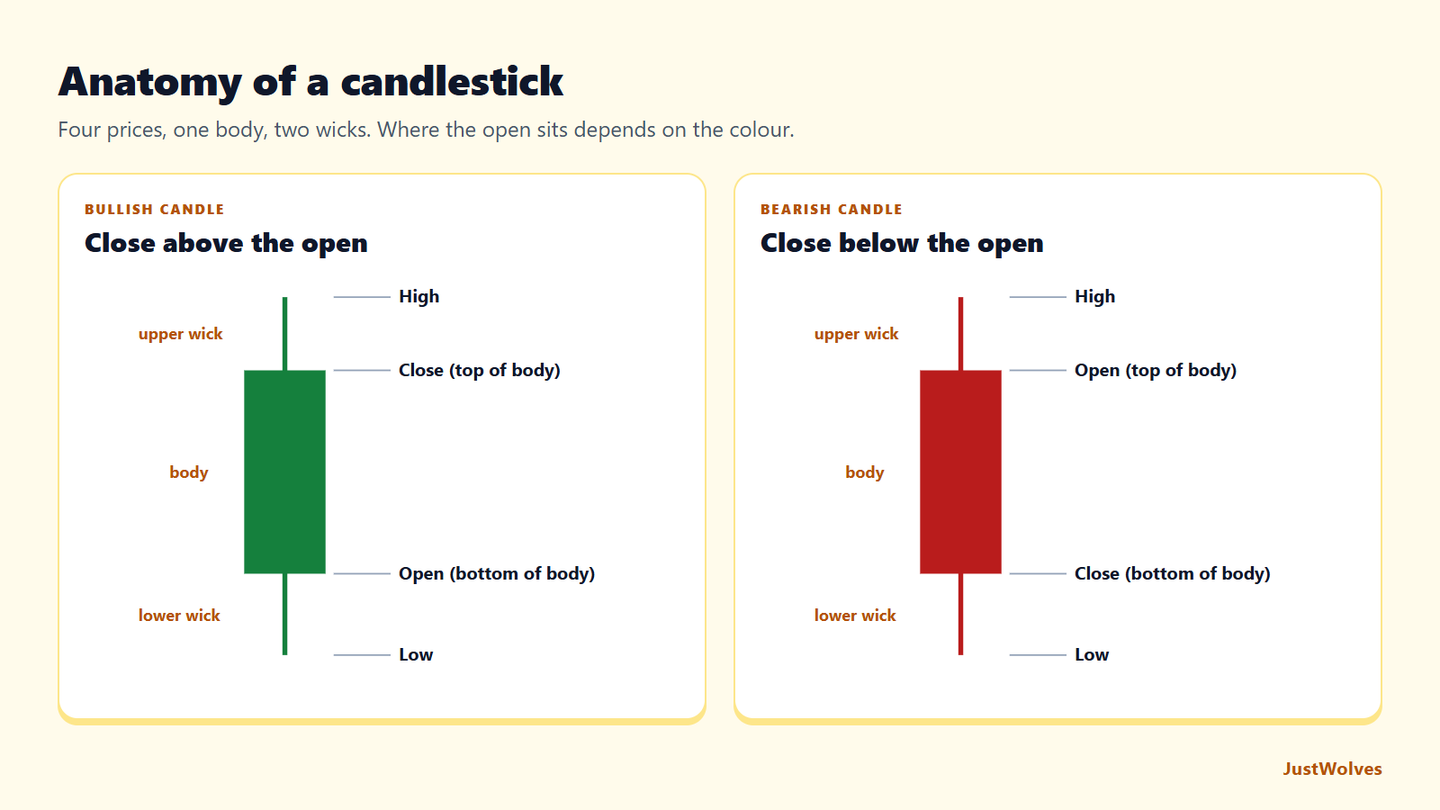
The body is the filled rectangle between the open and the close.
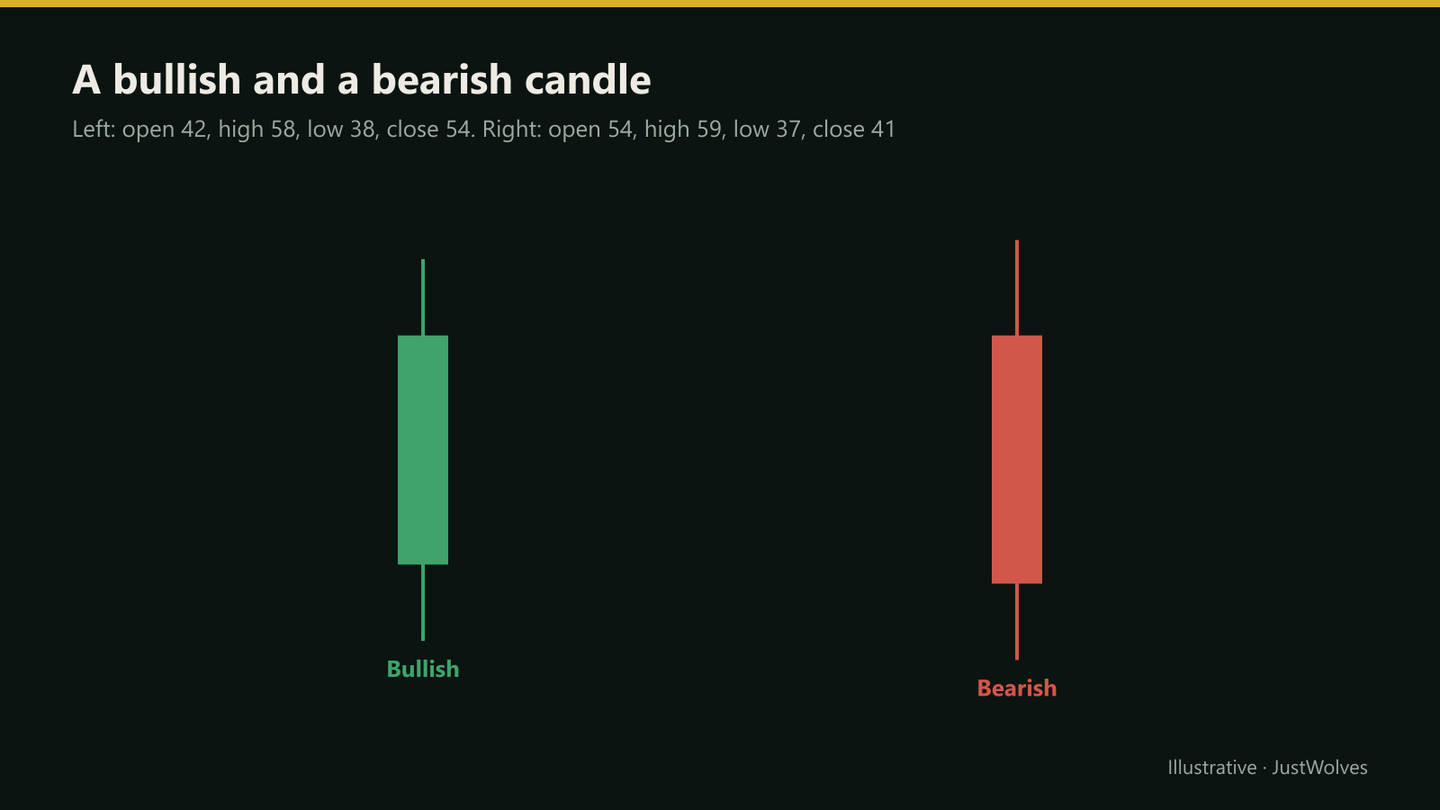
If the close is above the open, the candle is bullish: usually drawn green or hollow, with the open at the bottom of the body and the close at the top. If the close is below the open, the candle is bearish: usually red or filled, with the open at the top and the close at the bottom.
The body's size shows how far price travelled from open to close. A tall body means one side moved price a long way; a tiny body means the period ended close to where it started.
The Wicks
The upper wick (or upper shadow) runs from the top of the body to the high. The lower wick runs from the bottom of the body to the low.
A wick marks prices that traded during the period but didn't hold by the close. A long upper wick means price went much higher during the period and then fell back; a long lower wick means price dropped and then recovered.
Reading the Parts Together
- Long body, short wicks: one side controlled most of the period.
- Small body, long wicks on both sides: price moved a lot in both directions and ended near where it started, which is indecision.
- Long lower wick, close near the high: sellers pushed price down, buyers took it back.
- Long upper wick, close near the low: buyers pushed price up, sellers took it back.
Timeframe Changes the Candle
A daily candle summarises every trade of the day. Split the same day into 1-hour candles and you'll see how it unfolded: perhaps a sharp drop in the morning and a steady recovery in the afternoon. On the daily chart, that same day appears as a single candle with a long lower wick.
This is why patterns are always tied to a timeframe. A hammer on the daily chart may be a sequence of ordinary-looking candles on the 15-minute chart, and vice versa.
Real Case: How One Daily Candle Forms
The chart below shows real NIFTY 50 hourly candles for 21 October 2026, with the day's open, high, low and close marked. Step through it to watch a single daily candle being built hour by hour, including the lower wick that formed in the last two hours.
Real case: one daily candle built from seven hourly candles, NIFTY 50, 21 October 2026
Step 1 of 5
The open and the high
NIFTY 50 opens the session at 23,016 and, in the first hour, trades up to 23,121. That turns out to be the high of the whole day.
- What to observe
- The daily open is the first hourly candle's open.
- Condition
- Watch how the rest of the day unfolds.
Practical Example
Hypothetically, a stock opens at ₹410, falls to ₹396 by midday, rallies to ₹418 in the afternoon and closes at ₹415. The daily candle is bullish: the body runs from ₹410 to ₹415, the lower wick from ₹410 down to ₹396, and the upper wick from ₹415 to ₹418.
Reading it: sellers had control early (the ₹14 lower wick), buyers took over and closed the day above the open, and a little selling near the high left a short upper wick.
Measuring a Candle: A Worked Example
Using the real NIFTY 50 candle for 21 October 2026 (open 23,016, high 23,121, low 22,650, close 22,811):
| Part | Calculation | Result |
|---|---|---|
| Range | High − low = 23,121 − 22,650 | 471 points |
| Body | Open − close = 23,016 − 22,811 (bearish) | 205 points (44% of range) |
| Upper wick | High − top of body = 23,121 − 23,016 | 105 points |
| Lower wick | Bottom of body − low = 22,811 − 22,650 | 161 points |
| Close location | (Close − low) ÷ range = 161 ÷ 471 | 0.34 |
Read together: sellers controlled most of the session (a red body almost half the range), but buyers recovered 161 points from the low before the close. The close location of 0.34 sits in the lower half of the range, so sellers still held the advantage at the end of the day, though not decisively. The next lesson builds on exactly this kind of reading.
Gaps Between Candles
A candle only describes its own period. If a stock closes at ₹500 and opens the next day at ₹512, the ₹12 gap appears between the two candles, not inside either of them. Gaps are common in Indian stocks and indices because of overnight news and the pre-open session, and much less common in forex, which trades almost around the clock. When you read a sequence of candles, look at the gaps as well as the candles: a gap that is quickly filled tells a different story from one that holds.
Common Mistakes
- Mixing up open and close on bearish candles.
- Reading colour without range, ignoring where the close sits.
- Forgetting the timeframe a candle belongs to.
- Trusting single-tick wicks in illiquid stocks.
- Assuming platforms use the same colours.
Professional Insight
Experienced traders tend to read candles as summaries of a struggle: where did the period start, how far did each side push, and who held the ground at the close? Pattern names come later; that basic reading is what makes them meaningful.
Risk Considerations
- A single candle is a small sample of market behaviour.
- Gaps between candles aren't shown inside either candle.
- Data differences between brokers can change candle shapes, especially in forex.
Important Terminology
| Term | Meaning |
|---|---|
| Body | The area between the open and close. |
| Upper wick | From the top of the body to the high. |
| Lower wick | From the bottom of the body to the low. |
| Range | The distance from low to high. |
| Bullish candle | A candle that closes above its open. |
What are the parts of a candlestick?
The body, between the open and close, and the upper and lower wicks, which reach to the high and low.
What does a long wick mean?
Price traded far in that direction during the period but was pushed back before the close.
What is the difference between a wick and a shadow?
Nothing; they're two names for the same part of the candle.
What does a green candle mean?
On most platforms, the close was above the open. Colours can be changed in your chart settings.
Why do candles look different on different timeframes?
Each candle summarises a different period, so a single daily candle contains many intraday candles.
How is a daily candle formed?
From every trade in the session: the first traded price is the open, the highest and lowest prices form the high and low, and the last price (or the official closing price) is the close. A real NIFTY day on 21 October 2026, made of seven hourly candles, became one red daily candle with a 205-point body and a 161-point lower wick.
Practical Exercise
Read five candles.
Your task
Step 1: Pick five daily candles
From a stock or index you follow.
Step 2: Write OHLC
For each one, from your platform's data window.
Step 3: Describe each
Body size, wick lengths and where the close sits in the range.
Step 4: Check intraday
Open the 1-hour chart for one of them and compare.
Check Your Understanding
On a bearish candle, the open is at:
Related Lessons
Previous: Candlestick Charts vs Line and Bar Charts. Next: Bullish vs Bearish Candles and Candle Strength. See also Wick Theory.