Candlestick Charts vs Line and Bar Charts
JustWolves is an educational platform and is not a SEBI-registered investment advisor. Trading financial instruments involves significant risk of loss and may not be suitable for all investors. Past performance is not indicative of future results. Read our full disclaimer →
What you'll learn
- Line, bar and candlestick charts can all be drawn from the same price data
- A line chart usually joins closing prices only, so it hides each period's range
- Bar (OHLC) and candlestick charts both show open, high, low and close
- Candlesticks make the open–close relationship easy to see through a coloured body
- Chart type changes what you see, not what the market did
In this article · 18 sections
Open any trading platform and you'll find several ways to draw the same price history. Line charts, bar charts and candlestick charts all start from the same numbers, but each shows a different amount of detail. This first lesson of the Candlestick course explains what each chart type shows, what it hides, and why candlesticks became the default for most traders.
What You Will Learn
- How line, bar and candlestick charts are built
- What information each chart type shows and hides
- When a line chart is still useful
- Why most traders use candlesticks
Before You Start
No prior knowledge is needed. If you're new to charts, What Is Price Action Trading? gives useful background.
The Data Behind Every Chart
For each period, whether one minute, one day or one week, an exchange or broker records four prices: the open (first traded price), the high, the low, and the close (last traded price). Together they're called OHLC data.
Every chart type in this lesson is drawn from OHLC data. The difference is how much of it each one displays.
Line Charts
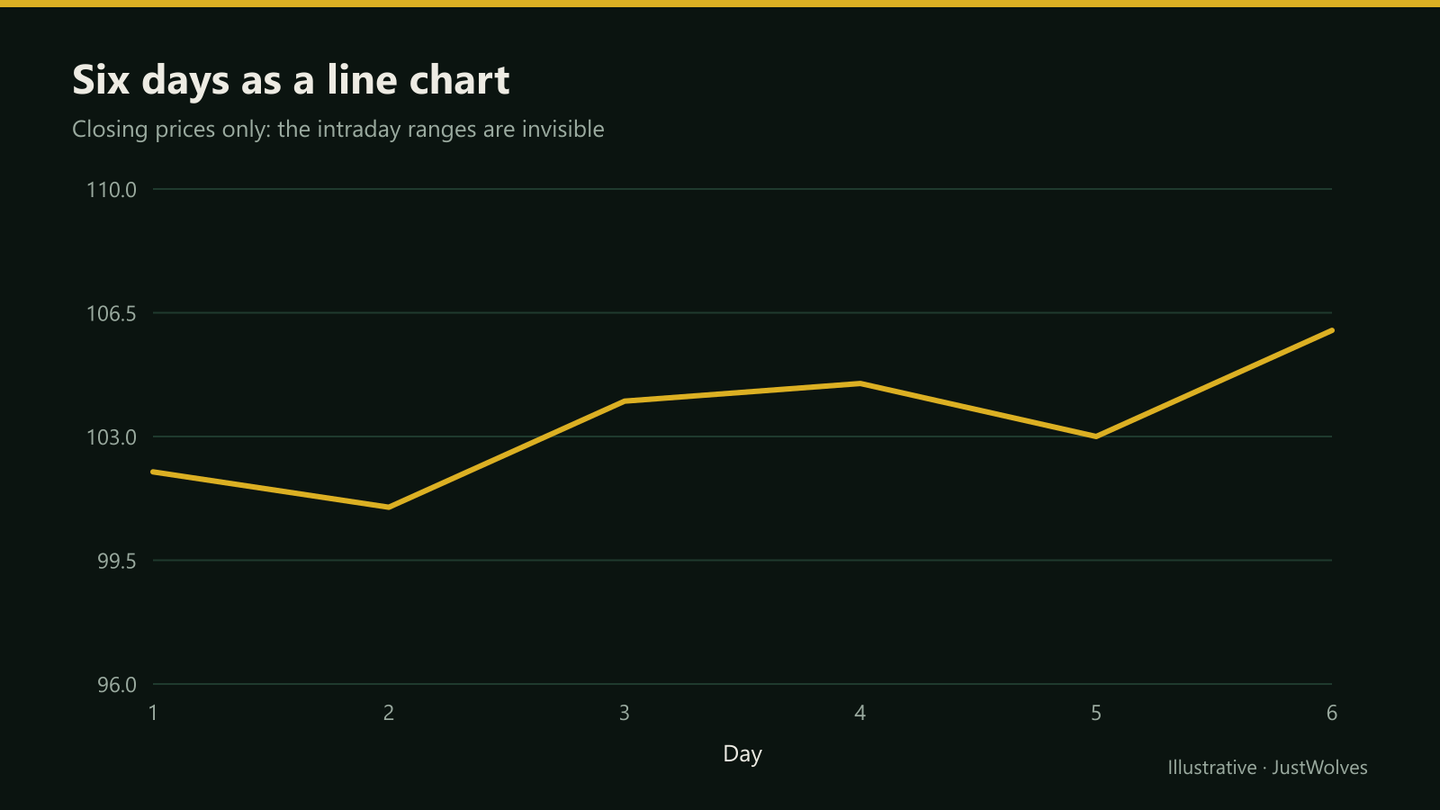
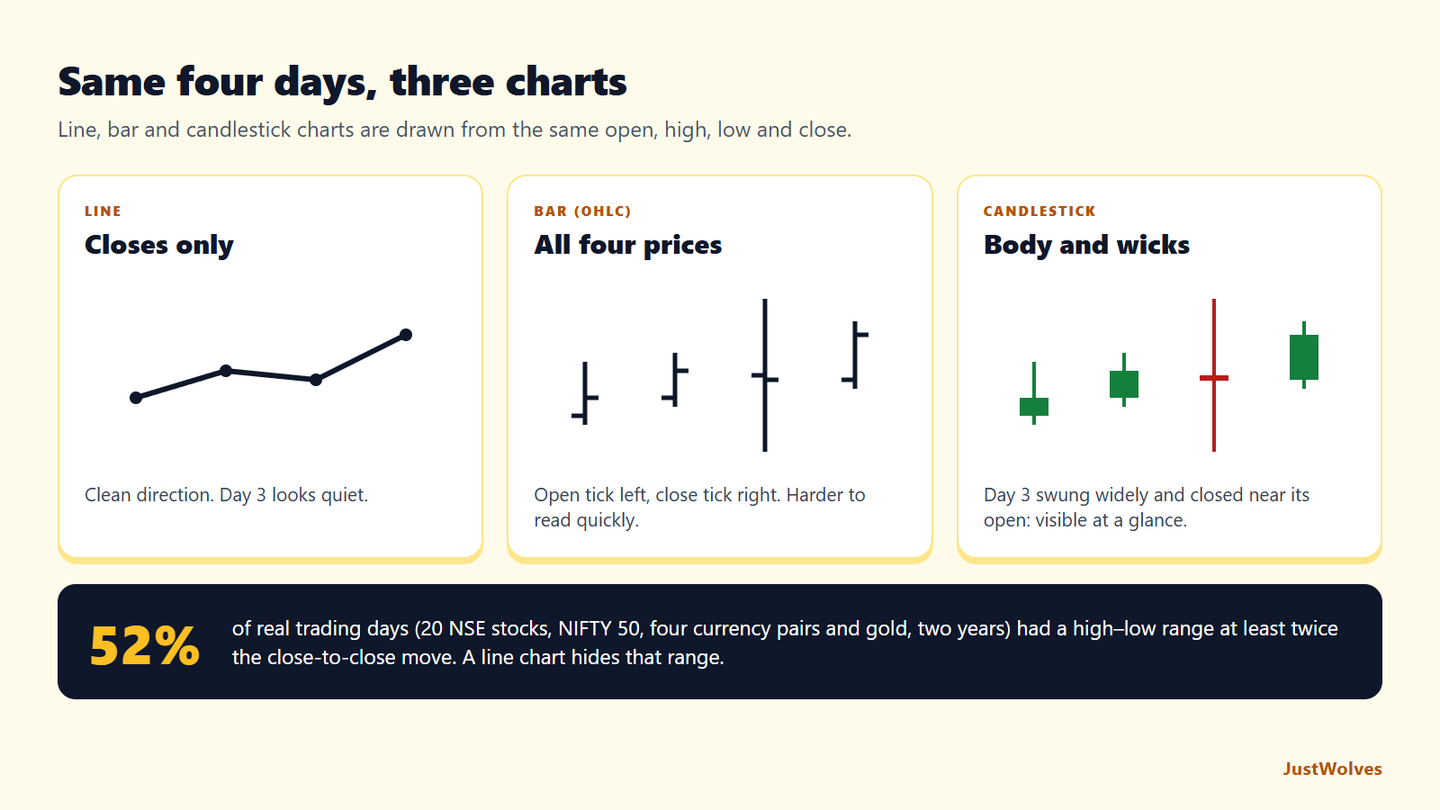
A line chart usually plots only the closing price of each period and joins the dots. It's the simplest view: clean, uncluttered and good for seeing the overall direction at a glance.
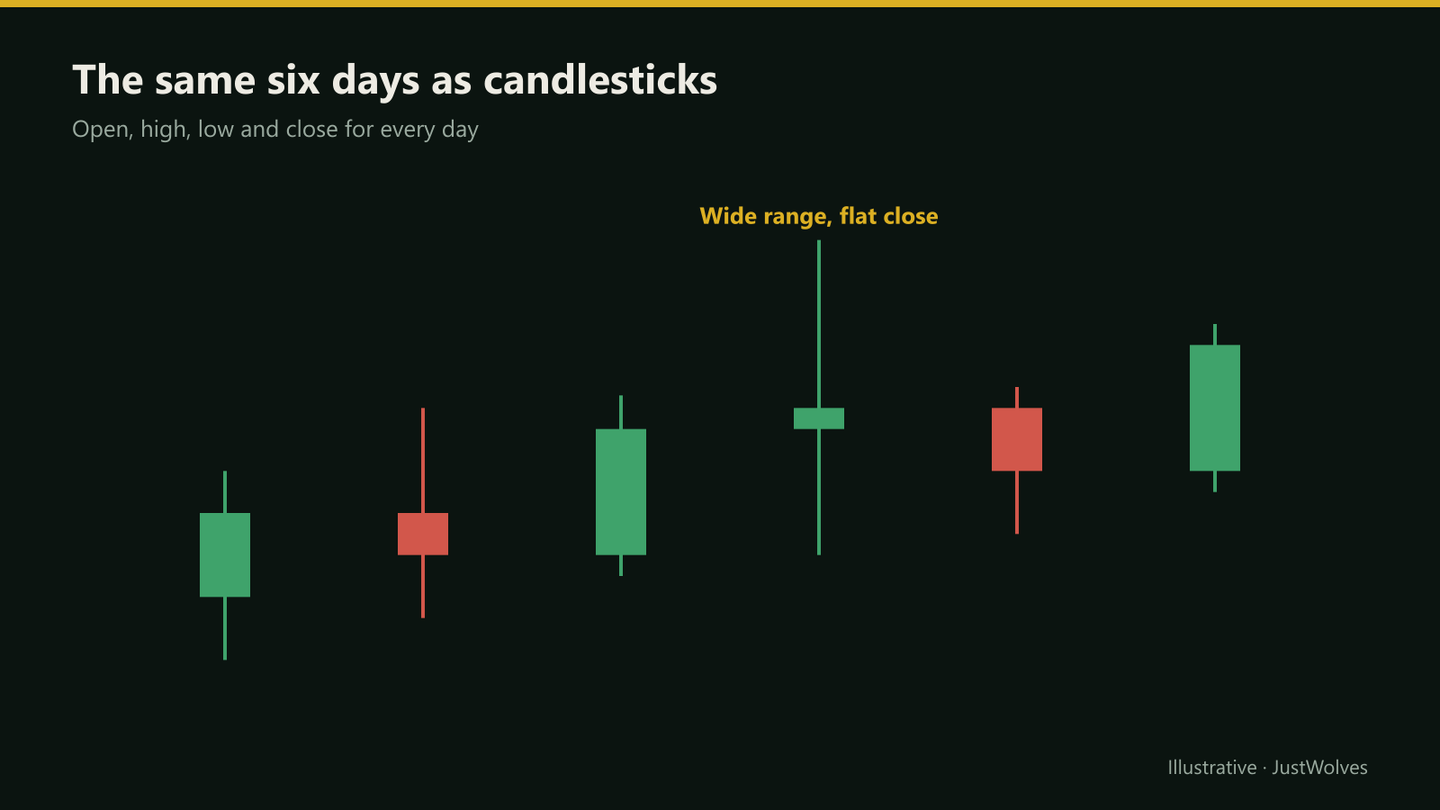
What it hides is everything that happened inside each period. A day that swung 4% before closing flat looks identical to a quiet day with the same close.
Bar Charts (OHLC Bars)
A bar chart draws each period as a vertical line from the low to the high, with a small tick on the left for the open and a tick on the right for the close. It shows all four prices. Many traders find it harder to read quickly, because the open and close are small marks rather than a filled shape.
Candlestick Charts
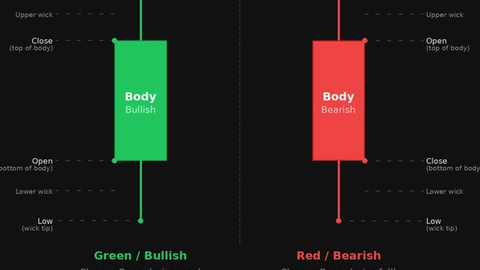
A candlestick shows the same four prices as a bar, but fills the space between the open and close to form a body. The thin lines above and below the body, called wicks or shadows, reach to the high and low.
The body is coloured to show direction: on most platforms, green (or hollow) when the close is above the open, and red (or filled) when it's below. That makes it easy to see at a glance who controlled each period and how much of the range was kept by the close.
Real Case: What the Line Chart Hid
The chart below uses real NIFTY 50 daily candles from October 2026, with a line joining the same closes drawn on top. Step through it to see two days that look like small dips on the line but swung more than 400 points within the session.
Real case: what a line chart hid, NIFTY 50, October 2026
Step 1 of 4
The line and the candles together
The teal line joins NIFTY 50's daily closes, exactly what a line chart shows. The candles behind it show each day's full open, high, low and close.
- What to observe
- Same data, two views.
- Condition
- Compare what each shows.
Side by Side
| Line | Bar (OHLC) | Candlestick | |
|---|---|---|---|
| Prices shown | Usually close only | Open, high, low, close | Open, high, low, close |
| Range visible | No | Yes | Yes |
| Open vs close at a glance | No | With effort | Yes, via body colour |
| Best for | Long-term direction, clean overviews | Traders who prefer a minimal look | Most price action and pattern reading |
When a Line Chart Still Helps
Because it filters out the intraday noise, a line chart of closes is useful for seeing long-term trends, comparing two instruments, and spotting major support and resistance on weekly or monthly charts. Some traders draw their key levels on a line chart first, then switch to candles for entries.
How Much Does a Line Chart Hide? Our Test
JustWolves measured this on about two years of real daily candles for 20 large NSE stocks, NIFTY 50, EUR/USD, GBP/USD, USD/JPY and gold: about 12,400 trading days. For each day we compared the high–low range with the close-to-close change that a line chart would show.
| Range compared with the close-to-close move | Share of days |
|---|---|
| At least twice as large | 52% |
| At least three times as large | 35% |
On about half of all days, a line chart understated the day's actual movement by a factor of two or more, and on a third by three or more. That hidden range is where stops get hit, where wicks show rejection, and where the levels in the rest of this course come from. A line chart is still the clearest way to see the overall direction, as this lesson says; it simply cannot answer questions about what happened inside each period.
Practical Example
Hypothetically, Ravi looks at a daily line chart of a bank stock and sees a steady rise from ₹600 to ₹640 over two weeks. It looks calm.
Switching to candles, he notices that on three of those days, the stock traded above ₹650 intraday but closed back near ₹640, leaving long upper wicks. The line chart showed a smooth rise; the candles show sellers repeatedly pushing price back from ₹650. That's information he'll learn to read in the rest of this course.
Other Chart Types You Will See
| Type | How it is built | Watch out for |
|---|---|---|
| Hollow candles | Fill shows close vs open; colour shows close vs the previous close | Two colour rules at once can confuse beginners |
| Heikin Ashi | Averaged candles that smooth the trend | Open and close are not real traded prices |
| Renko | Fixed-size bricks that ignore time | Gaps and timing are hidden |
| Area chart | A line chart with the space below filled in | Same limits as a line chart |
Practise on a Real Chart
Open the real chart below and look for days where the candle's range is much wider than the change from the previous close. Those are the days a line chart would have made look quiet. Then note whether each one left a long wick near a level you would have marked.
Practice chart: NIFTY 50 daily
Loading historical candles…
Common Mistakes
- Using line charts for entries and stops, where wicks matter.
- Reading Heikin Ashi candles as real prices.
- Assuming the colour scheme is universal; check your platform's settings.
- Comparing charts with different timezones or session settings, which changes daily candles.
Professional Insight
Many experienced traders use more than one view: a line or weekly chart for the big picture, and candlesticks on their trading timeframe. The chart type is a lens; choosing the right one for each question is part of the skill.
Risk Considerations
- A chart type doesn't predict anything; it only displays past prices.
- Data differs between brokers, especially in forex, so candles may not match exactly.
- Low-liquidity instruments can have misleading wicks from single trades.
Important Terminology
| Term | Meaning |
|---|---|
| OHLC | Open, high, low and close for a period. |
| Line chart | A chart joining closing prices. |
| Bar chart | Vertical bars with ticks for open and close. |
| Candlestick | A body between open and close, with wicks to the high and low. |
| Heikin Ashi | Averaged candles that smooth trends; not real traded prices. |
What is a candlestick chart?
A chart that shows each period's open, high, low and close, with a coloured body between the open and close and wicks to the high and low.
Which is better, a line chart or a candlestick chart?
Neither is better for everything. Line charts give a clean overview; candlesticks show the detail needed for entries, stops and pattern reading.
What is the difference between bar and candlestick charts?
Both show OHLC data. Bars mark the open and close with small ticks; candles fill a coloured body between them, which is easier to read.
Where did candlestick charts come from?
They're widely attributed to Japanese rice traders centuries ago, and became popular with traders worldwide from the early 1990s.
Are Heikin Ashi candles the same as normal candles?
No. They're calculated from averages, so their open and close are not actual traded prices.
How much information does a line chart leave out?
Often a lot. In our study of about 12,400 real trading days, the day's high–low range was at least twice the close-to-close change on 52% of days, and at least three times on 35%. A line chart shows only the close-to-close change.
Why do most traders use candlestick charts?
Because they show all four prices in a shape that is quick to read: the coloured body shows the open-to-close move and the wicks show how far price travelled and was pushed back.
Practical Exercise
Compare chart types.
Your task
Step 1: Open one chart
A daily chart of Nifty or a stock you follow.
Step 2: Switch views
Look at the last month as a line, bars and candles.
Step 3: Find a hidden day
One where the line looks quiet but the candle shows a wide range.
Step 4: Note it
Record what the wicks show that the line didn't.
Check Your Understanding
OHLC stands for:
Related Lessons
Next: Candlestick Anatomy. See also What Is Price Action Trading?.