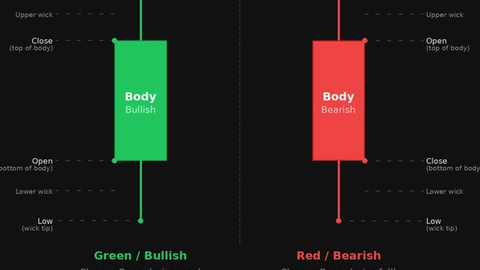
Doji Candlestick Patterns: Types and How to Trade Them
JustWolves is an educational platform and is not a SEBI-registered investment advisor. Trading financial instruments involves significant risk of loss and may not be suitable for all investors. Past performance is not indicative of future results. Read our full disclaimer →
What you'll learn
- A doji opens and closes at or very near the same price, leaving almost no body
- It shows indecision: neither buyers nor sellers held control by the close
- Main types: standard, long-legged, dragonfly and gravestone
- A doji after a strong move at a key level can warn of a pause or reversal; mid-range it means little
- Wait for the next candle to confirm direction before acting
In this article · 16 sections
The doji is one of the most recognisable candles on any chart: a cross or plus sign with almost no body. It records a period where price moved around but closed almost exactly where it opened. This lesson covers the main types of doji, what they suggest, and why a doji is a reason to pay attention rather than a reason to trade on its own.
What You Will Learn
- What makes a candle a doji
- The four main doji types
- When a doji matters and when it doesn't
- How to trade a doji with confirmation
Before You Start
Read Bullish vs Bearish Candles and Candle Strength first.
What a Doji Is
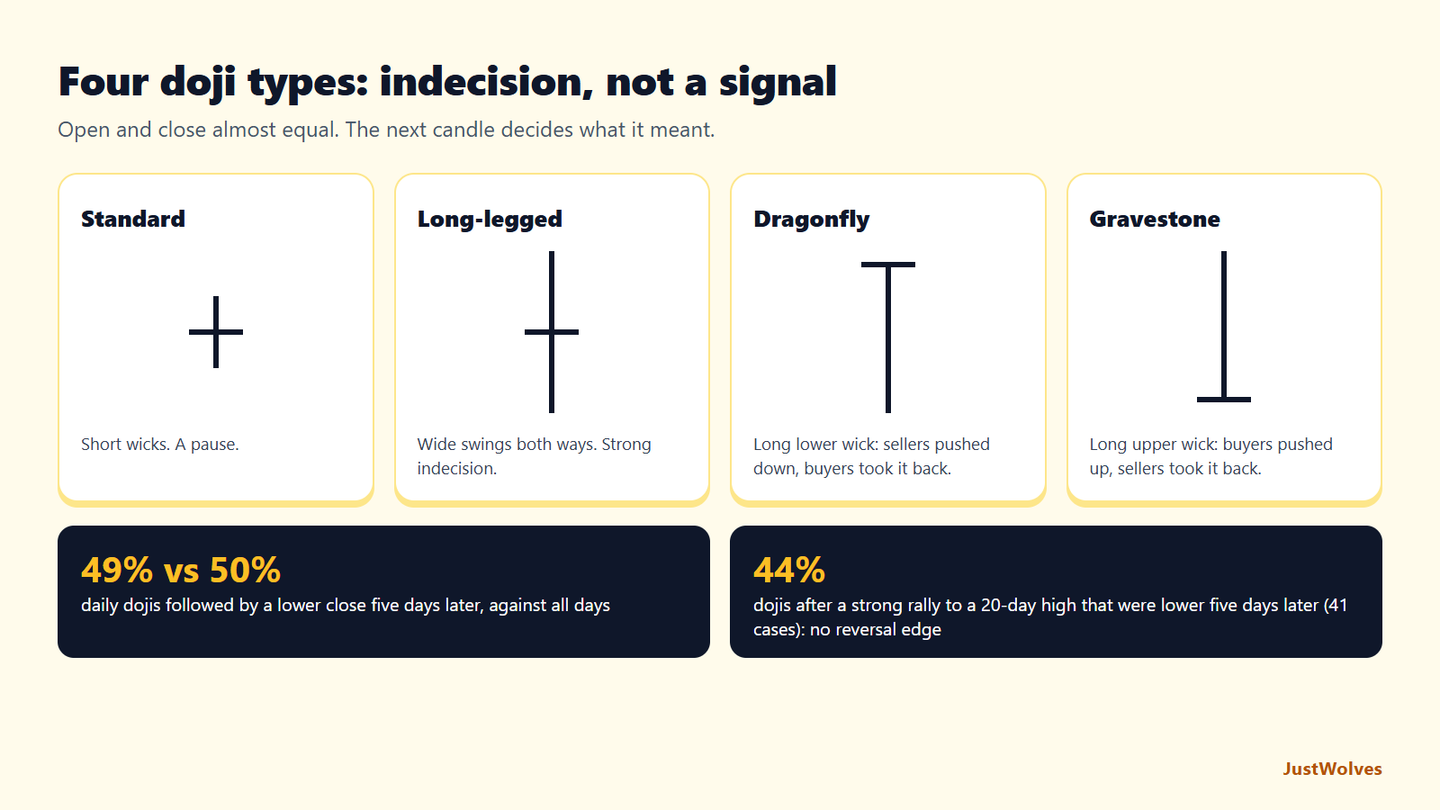
A doji is a candle whose open and close are equal or very nearly equal, so the body is a thin line. Exact equality is rare, so traders usually treat a candle as a doji when the body is a very small share of the full range, often under about 5–10%.
The message is indecision: during the period, price moved up and down, but by the close neither side had made progress.
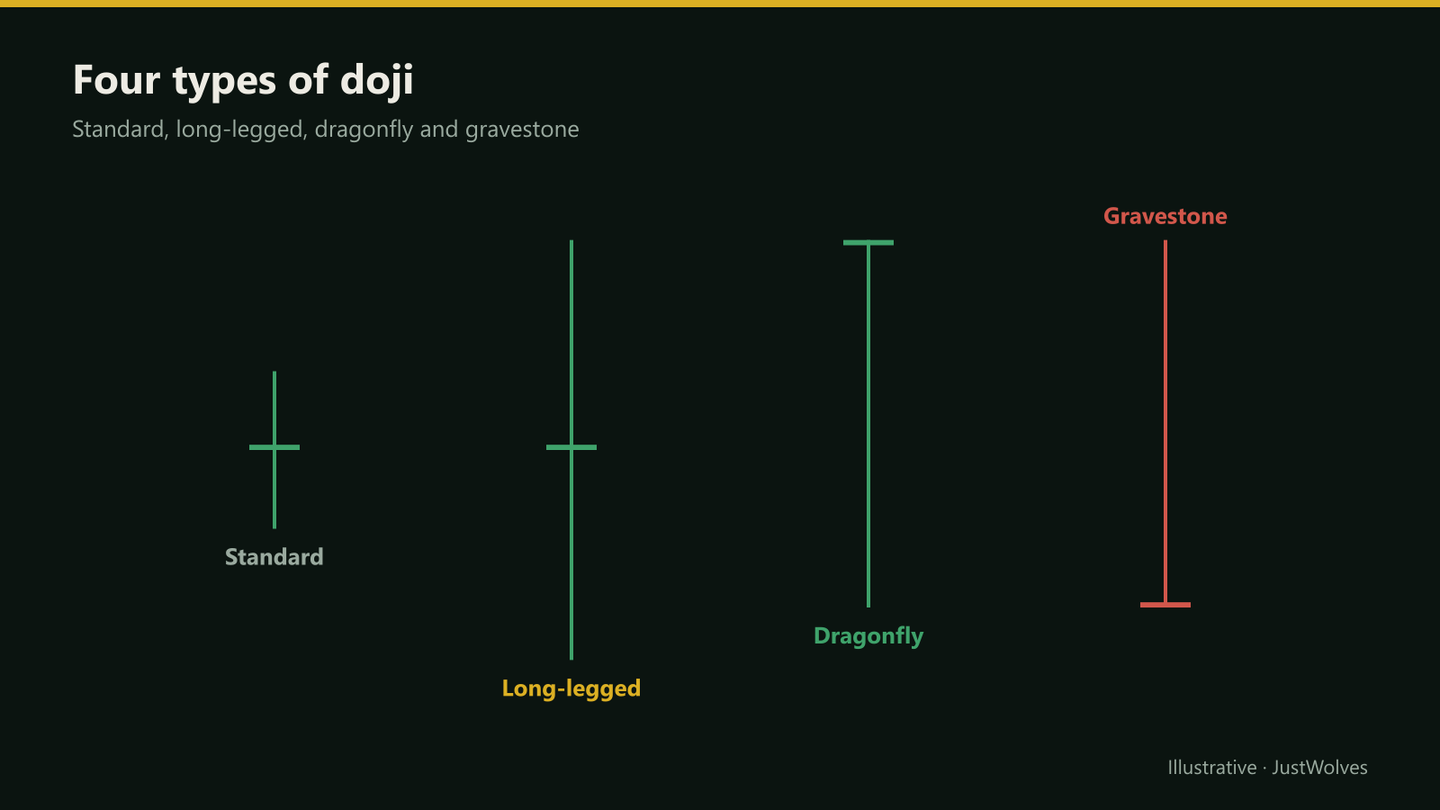
Four Types of Doji
| Type | Shape | Common reading |
|---|---|---|
| Standard doji | Tiny body, short wicks | A pause; little information on its own |
| Long-legged doji | Tiny body, long wicks both sides | Strong indecision after a wide two-way fight |
| Dragonfly doji | Body at the top, long lower wick | Sellers pushed down, buyers recovered fully; leans bullish at support |
| Gravestone doji | Body at the bottom, long upper wick | Buyers pushed up, sellers took it all back; leans bearish at resistance |
When a Doji Matters
A doji in the middle of a sideways range is common and usually meaningless: indecision is already the market's state. A doji gets attention when it interrupts something, such as a strong trend or a fast move into a key level.
After several large green candles into resistance, a doji shows that the buying pressure didn't carry through that period. That's a warning to protect profits or watch for a reversal, not a confirmed turn.
Trading a Doji
Doji at resistance (bearish idea)
Step 1: Context
A rally into a marked resistance level or supply zone.
Step 2: The doji
Forms at the level, ideally a gravestone or long-legged doji.
Step 3: Confirmation
The next candle closes below the doji's low.
Step 4: Entry and stop
Enter on that close; stop above the doji's high.
Step 5: Target
The next support level; check the reward is worth the risk.
Real Case: A Gravestone Doji at a High
The chart below uses real daily candles for Hindustan Unilever from October 2025. Step through it to see a textbook gravestone doji at a 20-day high, its confirmation, and why the confirmed signal still failed this course's reward-to-risk test.
Real case: a gravestone doji at a 20-day high, Hindustan Unilever, October 2025
Step 1 of 5
A rally to a 20-day high
Hindustan Unilever rallies from 2,482 on 14 October 2025 to 2,625 by 20 October, a 20-day high.
- What to observe
- A strong move into new highs.
- Condition
- A doji here would be worth noticing.
What Comes After a Doji
A doji is often one part of a larger pattern. After a strong decline, a large red candle, a doji and then a large green candle form a morning star, covered in the three-candle module. The doji is the moment of balance between the two moves.
In practice, the candle after the doji carries most of the information. A close beyond the doji's high or low shows which side resolved the indecision. A second doji, or a small candle inside the doji's range, means the balance continues, and many traders simply wait.
Timeframe also matters. Daily dojis on liquid stocks and indices summarise a full session of two-way trading. On a 1-minute chart, dojis appear constantly in quiet periods and carry very little meaning.
What Do Dojis Predict? Our Test
JustWolves tested dojis on about two years of real daily candles for 20 large NSE stocks, NIFTY 50, four currency pairs and gold, and on six months of hourly candles for the five markets. A doji had a body no larger than 10% of its range, with a range of at least 0.7 of the average candle.
| Case | Daily: cases | Daily: lower 5 candles later | Hourly: cases | Hourly: lower 5 candles later |
|---|---|---|---|---|
| Any doji | 729 | 49% | 713 | 47% |
| All candles (baseline) | about 12,000 | 50% | about 15,000 | 50% |
| Doji after a 2-ATR rally to a 20-candle high | 41 | 44% | 29 | 52% |
| Same, confirmed by a close below the doji low | 11 | 55% | 5 | 80% |
Dojis on their own told us nothing about direction: they were followed by lower prices about as often as any other candle. Even dojis after strong rallies to new highs, the classic reversal warning, were not followed by lower prices more often than chance in the daily data.
The confirmed cases look better, but there were only 11 daily and 5 hourly examples, far too few to draw conclusions. That supports this lesson's core message: a doji is a question, not an answer. Treat it as a reason to tighten stops or pay attention, and require the next candle to confirm before acting.
Practical Example
Hypothetically, a metals stock rallies from ₹560 to ₹618 in five sessions into resistance at ₹615–₹622. The sixth session opens at ₹617, trades up to ₹626 and down to ₹610, and closes at ₹617.50: a long-legged doji at resistance.
The next day closes at ₹606, below the doji's low of ₹610. Farhan shorts stock futures at ₹606 with a stop at ₹628, above the doji's high, targeting support at ₹570: ₹22 of risk for ₹36 of reward.
Measuring a Doji Precisely
Exact equality of open and close is rare, so define a doji by proportion. Using the Hindustan Unilever candle above (open 2,601.0, high 2,667.2, low 2,596.1, close 2,601.6):
| Measure | Calculation | Result |
|---|---|---|
| Range | 2,667.2 − 2,596.1 | 71.1 |
| Body | 2,601.6 − 2,601.0 | 0.6 (under 1% of range) |
| Upper wick | 2,667.2 − 2,601.6 | 65.6 (92% of range) |
| Lower wick | 2,601.0 − 2,596.1 | 4.9 |
Write your own threshold down, such as "body no more than 10% of the range", and apply it the same way every time. Without a definition, almost any small candle can be called a doji after the fact.
Common Mistakes
- Trading every doji, including those mid-range.
- Acting before confirmation.
- Assuming a doji means reversal; it means indecision.
- Stops inside the doji's range.
- Ignoring the trend: a doji in a strong trend often leads to continuation.
Professional Insight
Many experienced traders use a doji mainly as a management signal: tighten a stop, take partial profit, or wait before adding. They tend to reserve new counter-trend trades for dojis that form at strong levels and are confirmed by the next candle.
Risk Considerations
- Dojis are common; most lead nowhere in particular.
- Long-legged dojis produce wide stops.
- Gaps can open beyond the doji's range.
Important Terminology
| Term | Meaning |
|---|---|
| Doji | A candle with open and close nearly equal. |
| Long-legged doji | A doji with long wicks on both sides. |
| Dragonfly doji | A doji with a long lower wick and no upper wick. |
| Gravestone doji | A doji with a long upper wick and no lower wick. |
| Confirmation | A following candle that closes in the expected direction. |
What does a doji candle mean?
Indecision: price moved during the period but closed almost where it opened.
Is a doji bullish or bearish?
Neither on its own. Its meaning depends on where it forms and what the next candle does.
What is a dragonfly doji?
A doji with a long lower wick and its open and close at the high, showing sellers' push was fully reversed.
What is a gravestone doji?
A doji with a long upper wick and its open and close at the low, showing buyers' push was fully reversed.
How do I trade a doji?
Only at key levels after a strong move, and only after the next candle confirms direction, with a stop beyond the doji.
Is a doji a reversal signal?
Not on its own. In our study of real daily data, dojis were followed by lower prices five days later 49% of the time, the same as any candle, and dojis after strong rallies to new highs only 44% of the time. A doji shows indecision; the next candle decides what it meant.
Practical Exercise
Find ten dojis.
Your task
Step 1: Find ten dojis
Five at marked levels after strong moves, five in the middle of ranges.
Step 2: Classify
Standard, long-legged, dragonfly or gravestone.
Step 3: Check confirmation
What did the next candle do?
Step 4: Compare groups
Which group led to clearer moves in your sample?
Check Your Understanding
A doji has:
Related Lessons
Previous module: Bullish vs Bearish Candles and Candle Strength. Next: Hammer and Hanging Man. See also Price Rejection.