Candlestick Patterns at Support and Resistance
JustWolves is an educational platform and is not a SEBI-registered investment advisor. Trading financial instruments involves significant risk of loss and may not be suitable for all investors. Past performance is not indicative of future results. Read our full disclaimer →
What you'll learn
- Mark levels first; only then look for patterns at them
- At a level, a pattern shows how the market is reacting right now
- Bullish patterns at support and bearish patterns at resistance are the core combinations
- Patterns that break through a level, rather than reject it, are evidence of a breakout
- The level and the pattern together define entry, stop and target
In this article · 17 sections
The single most useful filter for candlestick patterns is location. A hammer in the middle of a range is noise; a hammer at a well-tested support level is the market showing you, in real time, that buyers are defending that price. This lesson shows how to combine levels and patterns into one process, and how to read patterns that break a level instead of rejecting it.
What You Will Learn
- Why location matters more than pattern shape
- How to mark levels before patterns form
- The core level-and-pattern combinations
- How to read patterns that break levels
Before You Start
Read Candlestick Patterns: Complete Guide and Cheat Sheet and, from the Price Action course, What Is Support and Resistance?.
Why Location Matters
A support level is a price where buying has stopped declines before. When price returns, the question is whether buyers will defend it again. A candlestick pattern forming there answers that question for the current period: a hammer or bullish engulfing candle shows buyers stepping in; a large bearish candle closing through the level shows they didn't.
Away from levels, the same patterns have no particular question to answer, which is why they're far less useful.
Levels First, Patterns Second
Daily routine
Step 1: Mark levels
Support, resistance and supply and demand zones on the daily and weekly charts.
Step 2: Set alerts
At each level, so you don't need to watch constantly.
Step 3: When price arrives
Watch the candles forming at the level, on the timeframe you trade.
Step 4: Read the reaction
Rejection pattern, breakout candle, or neither.
Step 5: Plan or wait
Plan a trade only if the pattern and level agree.
Core Combinations
| Level | Supporting patterns | What they show |
|---|---|---|
| Support | Hammer, bullish pin bar, bullish engulfing, morning star, tweezer bottom | Buyers defending the level |
| Resistance | Shooting star, bearish pin bar, bearish engulfing, evening star, tweezer top | Sellers defending the level |
| Either | Doji, harami, inside bar | Pause at the level; wait for the next candle |
Real Case: A Pin Bar at a Tested Support Zone
The chart below uses real daily candles for Sun Pharmaceutical from October and November 2026. It follows this lesson's process in order: a level marked from repeated tests, a pattern forming at the level, and a trade built from both.
Real case: a pin bar at a tested support zone, Sun Pharma, October–November 2026
Step 1 of 5
A decline to a low
Sun Pharma falls from 1,804 on 6 October 2026 to 1,725.5 on 14 October, then bounces to 1,778 the next day.
- What to observe
- A first low at about 1,725.
- Condition
- Mark it.
When Patterns Break the Level
Not every candle at a level is a rejection. A bullish marubozu closing well above resistance, or three white soldiers driving through it, shows the level giving way. That's evidence for a breakout, and the old resistance may become support on a retest.
Similarly, a hammer whose low is later broken, or an engulfing pattern that's immediately reversed, tells you the defence failed. Many traders treat a failed rejection pattern at a level as a signal in the opposite direction.
Building the Trade
- Entry: on the pattern's close, or on a break of its high (for longs) or low (for shorts).
- Stop: beyond both the pattern's extreme and the level, so a normal retest doesn't stop you out.
- Target: the next opposing level. If it's less than about twice your risk away, many traders skip the trade.
Choosing the Pattern Timeframe
Match the pattern's timeframe to the level's. A level drawn on the daily chart is best tested with daily or 4-hour candles; a 5-minute hammer at a weekly level is a very small event relative to the level's importance. Some traders mark the level on the daily chart, then watch the 1-hour chart as price arrives, entering on an hourly pattern but keeping the stop beyond the daily level.
Do Levels Make Patterns Better? Our Test
This lesson argues that location is the most useful filter for candlestick patterns. JustWolves tested that claim on about two years of real daily candles for 20 large NSE stocks, NIFTY 50, four currency pairs and gold, and six months of hourly candles for the five markets.
Patterns: bullish pin bars, bullish engulfing patterns, tweezer bottoms and morning stars, defined as in their own lessons, with the bearish versions tested on mirrored prices. Level: a prior swing low (a low with three higher lows on each side) formed 5 to 60 candles earlier, within half an average candle range of the pattern's low; for bearish patterns, a prior swing high. Trade: at the pattern's close, stop beyond the pattern, 2R target.
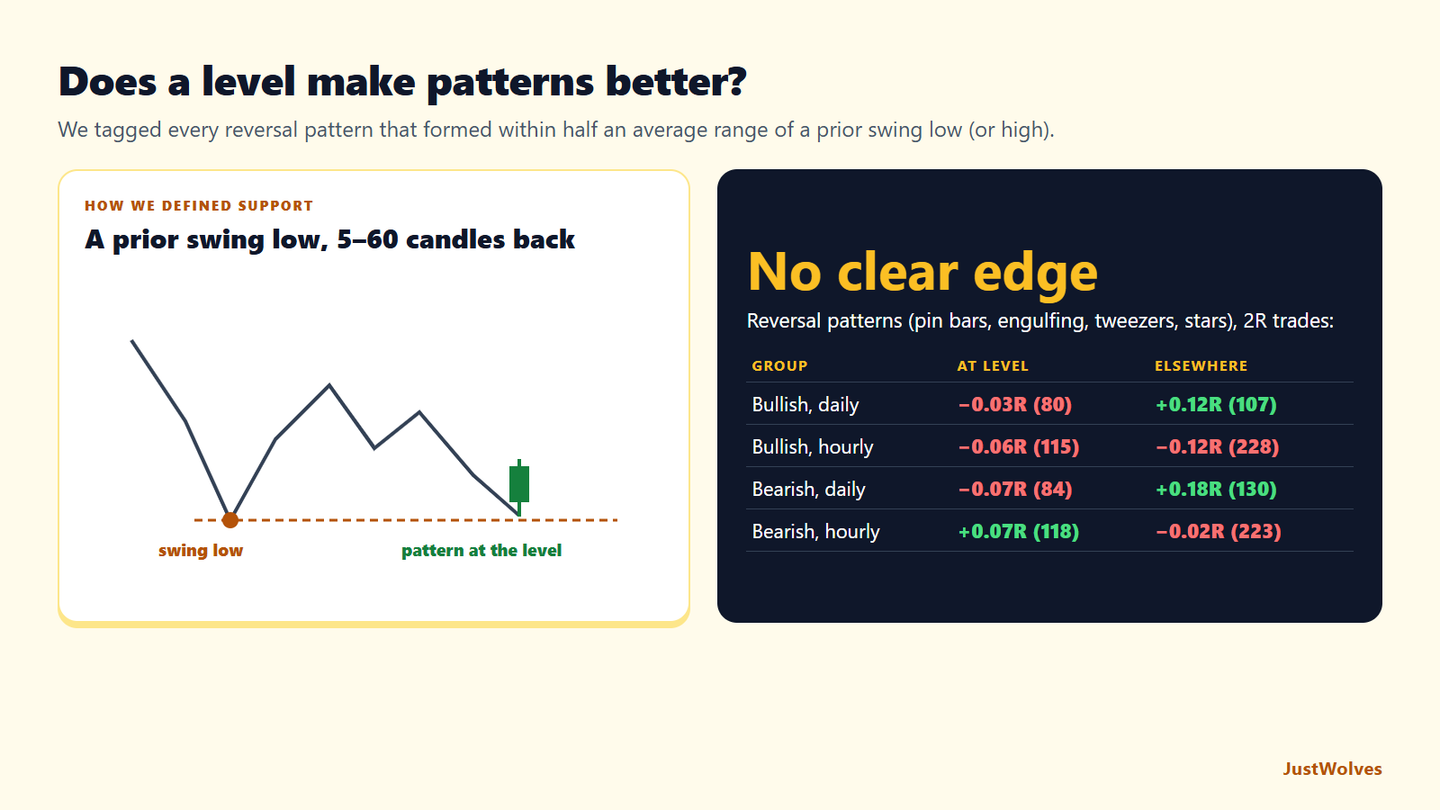
| Group | At a prior swing level | Elsewhere | Any candle at a swing level (control) |
|---|---|---|---|
| Bullish, daily | 80 trades, 33% wins, −0.03R | 107 trades, 37% wins, +0.12R | −0.03R |
| Bullish, hourly | 115 trades, 31% wins, −0.06R | 228 trades, 29% wins, −0.12R | −0.10R |
| Bearish, daily | 84 trades, 31% wins, −0.07R | 130 trades, 39% wins, +0.18R | −0.11R |
| Bearish, hourly | 118 trades, 36% wins, +0.07R | 223 trades, 33% wins, −0.02R | −0.03R |
The result surprised us. On hourly charts, patterns at prior swing levels did slightly better than patterns elsewhere (by about 0.06 to 0.09R). On daily charts, they did worse. Taken together, our mechanical definition of a level did not reliably improve candlestick patterns.
That does not prove this lesson's advice wrong, and it is worth being precise about why. Our "level" is a simple rule a computer can apply: one prior swing point, within half an average range. A trader marking levels by hand looks for more than that: zones tested several times, like the Sun Pharma zone above, round numbers, levels visible on the weekly chart, and levels that previously switched from resistance to support. Those richer levels may behave differently, and they are exactly what this lesson's exercise asks you to test.
What the data does show is that "at a level" is not a magic word. A pattern touching any old swing low is not automatically a better trade. If location is your main filter, define it precisely, write it down, and check it against patterns elsewhere in your own records, as the exercise below suggests. And keep the parts of this lesson that do not depend on prediction: stops beyond both the pattern and the level, and a minimum distance to the next level, both of which control risk whether or not the level holds.
Practical Example
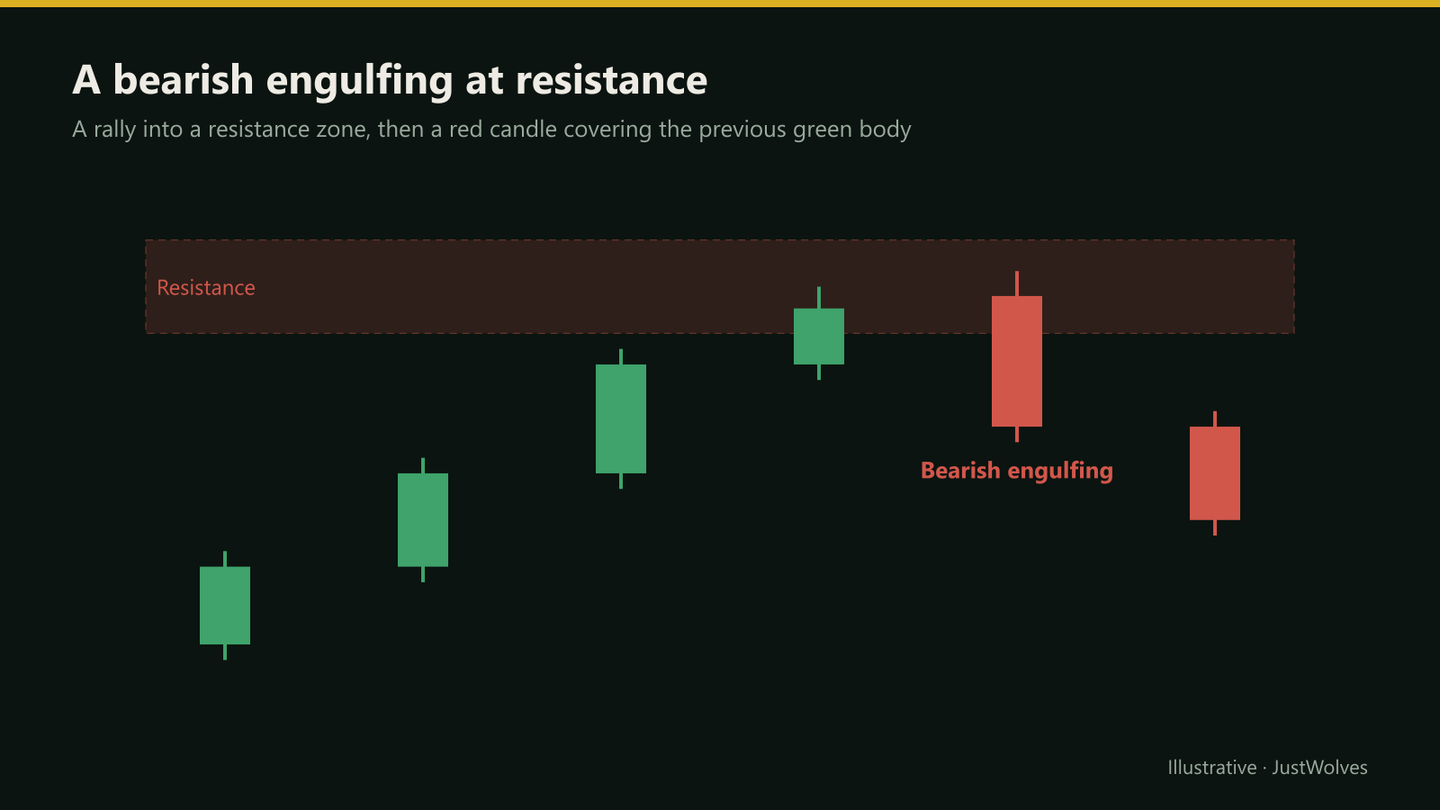
Hypothetically, an auto stock has resistance at ₹1,850–₹1,865 from two earlier highs. It rallies to ₹1,862 and forms a bearish engulfing candle closing at ₹1,828, with a pattern high of ₹1,866. The next support is ₹1,760.
Arjun shorts stock futures at ₹1,826 with a stop at ₹1,876, above both the pattern and the zone, targeting ₹1,765: ₹50 of risk for ₹61 of reward. That's only about 1.2R. Under his rule of at least 2R, he skips the trade and notes it in his journal.
Measuring the Sun Pharma Setup
| Measure | Values | Result |
|---|---|---|
| Tests of the zone before the pattern | 14, 21, 22, 26 Oct | Lows 1,725.5, 1,721.1, 1,719.1, 1,729.4 |
| Pin bar range and tail | 1,764.0 − 1,726.2; tail 1,754.9 − 1,726.2 | 37.8 range, 28.7 tail (76%) |
| Stop beyond pattern and zone | Below 1,719.1 | 1,716, risk 41.5 points |
| Room to the nearest swing highs | 1,778 and 1,804 | 0.5R and 1.1R |
| Fixed 2R target | 1,757.5 + 2 × 41.5 | 1,840.5, reached 30 October |
This example shows the tension between two rules in this lesson. The location was excellent: a zone tested four times, with the pin bar's tail probing into it. But the room to the next level was poor: the nearest swing high was only half the risk away. A trader following the "skip if the next level is under 2R" rule would have passed, and would have watched the stock run to 1,855 two days later. That is not a reason to drop the rule. Over many trades, a reward filter is meant to remove setups with little room, and some of those will still work. The point is to choose your rule in advance, apply it every time, and judge it on dozens of trades, not on the one you remember.
Common Mistakes
- Looking for patterns first and levels second.
- Accepting patterns near, not at, the level.
- Stops inside the level's zone.
- Ignoring breakout candles that contradict the expected rejection.
- Taking trades with too little room to the next level.
Professional Insight
Many experienced traders describe their charts as a short list of levels and a lot of waiting. The candlestick pattern is the final piece, the moment the market shows its hand at a price they had already decided was important.
Risk Considerations
- Levels fail; the stop exists for that.
- Sweeps often push briefly through levels before reversing.
- Gaps can open beyond both the level and the stop.
Important Terminology
| Term | Meaning |
|---|---|
| Support | A price area where buying has stopped declines. |
| Resistance | A price area where selling has stopped advances. |
| Rejection pattern | A pattern showing a level being defended. |
| Breakout candle | A strong candle closing through a level. |
| Retest | A return to a broken level from the other side. |
Why do traders look for candlestick patterns at support and resistance?
Because the level gives the pattern a question to answer: whether buyers or sellers are defending that price right now.
What is the best candlestick pattern at support?
Common choices are hammers and bullish pin bars, bullish engulfing patterns and morning stars. None is best in every case.
Where should the stop go?
Below both the pattern's low and the support zone, so a normal retest of the level does not stop you out. In a real Sun Pharma example from November 2026, price retested the zone after the pattern and held just above a stop placed this way.
What if a bearish pattern forms at support?
A strong bearish candle closing through support is evidence of a breakdown rather than a bounce.
Do I need to watch charts all day?
No. Mark levels in advance and set price alerts.
Do candlestick patterns work better at support and resistance?
Not consistently in our test. Reversal patterns within half an average range of a prior swing point did worse than patterns elsewhere on daily charts and slightly better on hourly charts. Hand-marked levels tested several times may behave differently, so test your own definition.
Practical Exercise
Compare at-level and mid-range patterns.
Your task
Step 1: Mark levels
On three daily charts, before looking at recent candles.
Step 2: Find patterns
Ten at your levels and ten elsewhere.
Step 3: Track outcomes
Did price move at least 2R in the pattern's direction?
Step 4: Compare
Which group did better in your sample?
Check Your Understanding
In this process, what comes first?
Related Lessons
Previous: Candlestick Patterns: Complete Guide and Cheat Sheet. Next: Candlestick Patterns and Market Structure. See also How to Draw Support and Resistance.