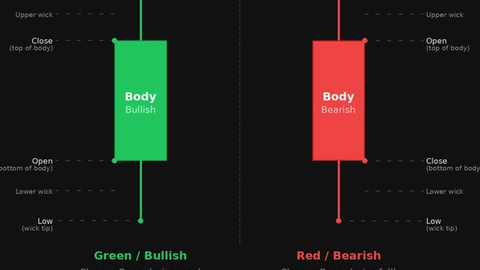
Hammer and Hanging Man Candlestick Patterns
JustWolves is an educational platform and is not a SEBI-registered investment advisor. Trading financial instruments involves significant risk of loss and may not be suitable for all investors. Past performance is not indicative of future results. Read our full disclaimer →
What you'll learn
- Both have a small body near the top of the range and a lower wick at least about twice the body
- A hammer appears after a decline and suggests buyers are absorbing the selling
- A hanging man is the same shape after a rise, and warns that selling appeared during the period
- The body colour matters less than the shape and location
- Confirmation comes from the next candle; the stop usually goes beyond the wick
In this article · 16 sections
The hammer and the hanging man look identical: a small body at the top of the range and a long lower wick. What separates them is where they appear. After a fall, the shape suggests buyers stepped in; after a rise, it suggests sellers briefly took control. This lesson covers how to identify both, what they suggest, and how to trade them with confirmation.
What You Will Learn
- The shape rules for a hammer and hanging man
- Why context changes the meaning
- How to confirm and trade each
- Where they fail
Before You Start
Read Doji Candlestick Patterns first.
The Shape
- Small body in the upper part of the range.
- Long lower wick, commonly at least about twice the length of the body.
- Little or no upper wick.
- The body can be green or red; many traders treat a green hammer and a red hanging man as slightly stronger versions.
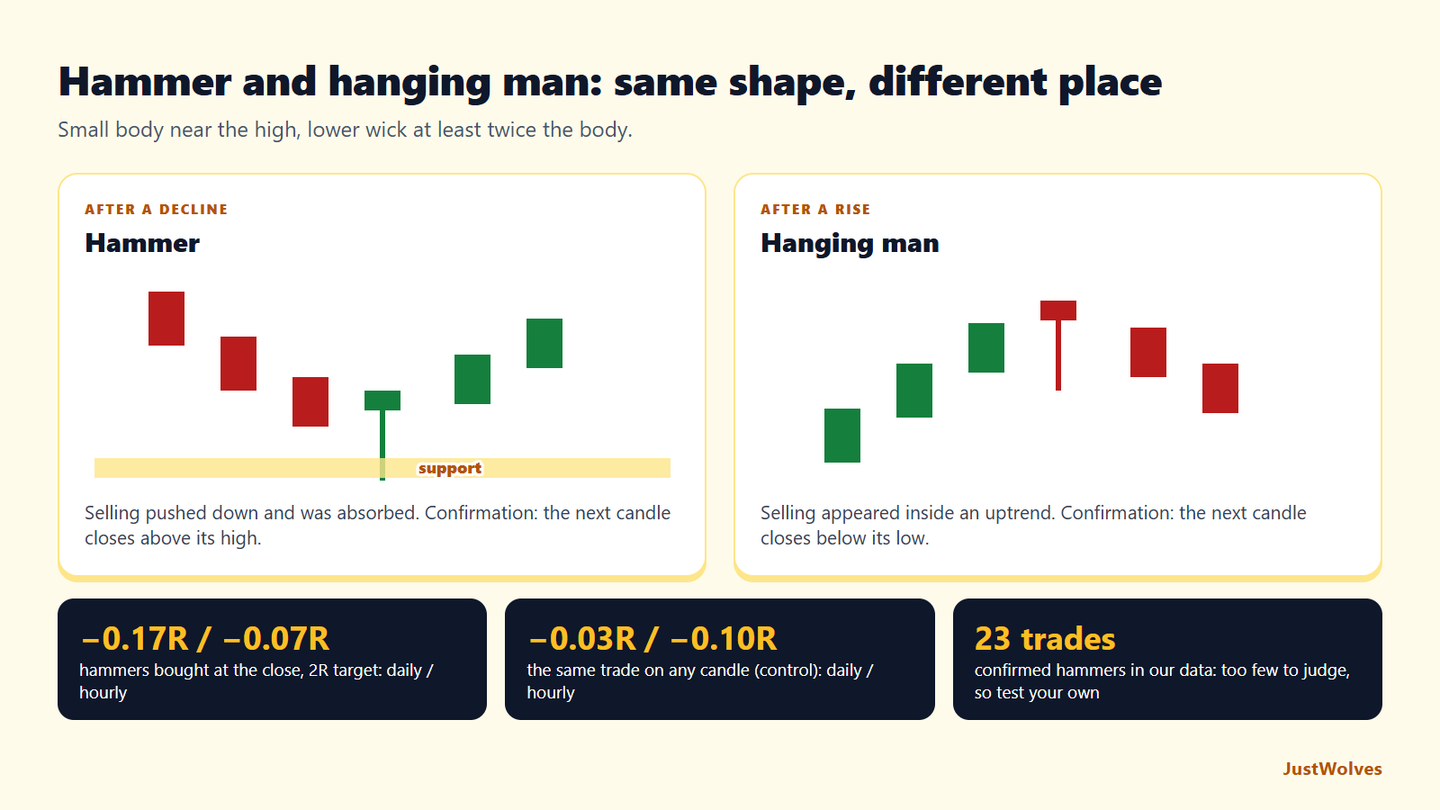
Hammer: After a Decline
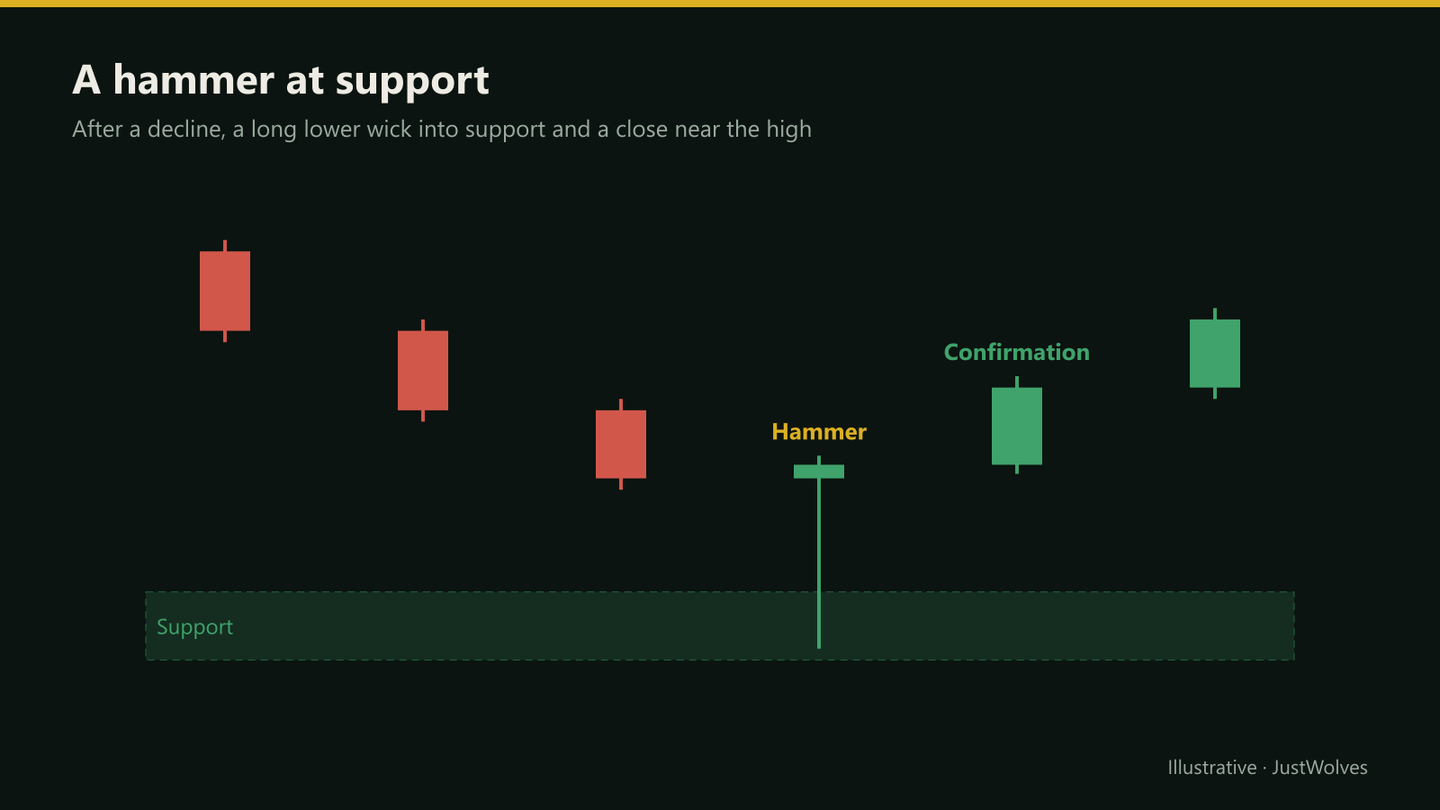
A hammer forms after a fall. During the period, sellers pushed price well below the open, then buyers drove it back up to close near the high. The long lower wick records a decline that wasn't held.
At support, a hammer suggests the selling may be running out of force. It's one of the most widely watched bullish candles.
Hanging Man: After a Rise
A hanging man is the same shape after an advance. Price closed near the high, so it can look harmless, but during the period sellers pushed price well down. That shows selling interest appeared inside an uptrend.
On its own, a hanging man is generally considered a weaker signal than a hammer, because price did recover by the close. It needs bearish confirmation: the next candle closing below the hanging man's body or low.
Trading the Hammer
Hammer at support
Step 1: Context
A decline into a marked support level or demand zone.
Step 2: The hammer
Long lower wick into the level, close in the upper part of the range.
Step 3: Confirmation
The next candle closes above the hammer's high.
Step 4: Entry and stop
Enter on the confirmation close; stop below the hammer's low.
Step 5: Target
The next resistance; skip if it's too close to justify the risk.
Real Case: Two Hammers, One Trade
The chart below uses real daily candles for Asian Paints from October and November 2026. It shows a hammer-like candle that the confirmation rule correctly skipped, and a true hammer at a new low that confirmed and reached its target.
Real case: one hammer that failed, one that worked, Asian Paints, October–November 2026
Step 1 of 5
A decline
Asian Paints falls from 2,424 in early October 2026 to about 2,260 by 23 October.
- What to observe
- Lower highs and lower lows.
- Condition
- Hammers are worth watching only after a decline like this.
Measuring the Shape
Measuring removes guesswork. Take a candle with an open of ₹200, a high of ₹202, a low of ₹188 and a close of ₹201. The body is ₹1 (₹200 to ₹201), the lower wick is ₹12 (₹200 down to ₹188) and the upper wick is ₹1. The lower wick is twelve times the body and the close sits in the top tenth of the range: a clear hammer shape.
Compare a candle with an open of ₹200, a high of ₹204, a low of ₹196 and a close of ₹202. The lower wick is ₹4 and the body ₹2, but the upper wick is also ₹2 and the close is only three-quarters of the way up the range. It's a reasonable bullish candle, but not a hammer.
A hammer is closely related to the dragonfly doji (no body at all) and to the bullish pin bar, which is the general price action name for the same rejection shape.
How Do Hammers and Hanging Men Perform? Our Test
JustWolves tested both patterns on about two years of real daily candles for 20 large NSE stocks, NIFTY 50, four currency pairs and gold, and six months of hourly candles for the five markets.
Shape: lower wick at least twice the body, small upper wick, close in the top 40% of the range, range at least 0.8 of the average candle. Hammer: after a fall of at least 1.5 average ranges over five candles. Hanging man: the same shape after a rise of the same size. Trades: a 2R target with the stop beyond the wick, entered either at the pattern's close or after confirmation. As a control, the same trade was taken at the close of ordinary candles.
| Setup | Daily | Hourly |
|---|---|---|
| Hammer, enter at its close | 47 trades, 28% wins, −0.17R | 55 trades, 31% wins, −0.07R |
| Hammer at a 20-candle low, enter at its close | 31 trades, 32% wins, −0.03R | 37 trades, 32% wins, −0.03R |
| Hammer, enter after a close above its high | 14 trades, 36% wins, +0.07R | 9 trades, 67% wins, +1.00R |
| Hanging man (short), enter at its close | 34 trades, 32% wins, −0.03R | 38 trades, 32% wins, −0.05R |
| Control: any candle, same trade | 2,227 trades, 32% wins, −0.03R | 2,551 trades, 30% wins, −0.10R |
Taken at their close, hammers and hanging men performed about the same as the control trade, close to break-even or slightly negative. Hammers at a 20-candle low were a little better than hammers in general, consistent with this lesson's emphasis on location, but not better than the control.
Confirmed hammers looked promising, especially on hourly charts, but with 14 and 9 trades the samples are far too small to trust: a few lucky trades produce numbers like these. The honest conclusion is the one this lesson already gives: the hammer's main strength is a clear invalidation point, the low of the wick. Whether the pattern adds an edge in your market is something to test on your own log of trades.
Practical Example
Hypothetically, an FMCG stock falls from ₹1,080 to ₹1,010 over a week into support at ₹995–₹1,005. The next session opens at ₹1,008, drops to ₹992 and closes at ₹1,012: a hammer with a ₹16 lower wick and a ₹4 body.
The following day closes at ₹1,024, above the hammer's high of ₹1,014. Lakshmi buys at ₹1,024 with a stop at ₹988, below the hammer's low, targeting ₹1,078 near the prior high: ₹36 of risk for ₹54 of reward.
Sizing a Hammer Trade
Because the stop goes below the wick, hammer trades often need wide stops, which means smaller positions. In the Asian Paints example, risk was 108 rupees per share (2,320 − 2,212). With ₹2,00,000 of capital and 1% risk (₹2,000), the position is 2,000 ÷ 108 ≈ 18 shares, worth about ₹42,000. If the hammer's wick had been half as long, the position could have been twice as large for the same rupee risk.
This is why a very long-wicked hammer is not automatically a better trade: the longer the wick, the smaller the position and the further the target has to be to reach 2R.
| Risk per share | Shares | Position value at ₹2,320 |
|---|---|---|
| ₹54 | 37 | about ₹86,000 |
| ₹108 | 18 | about ₹42,000 |
| ₹216 | 9 | about ₹21,000 |
Common Mistakes
- Calling any long-wicked candle a hammer, without a prior decline.
- Ignoring location: hammers mid-range carry little weight.
- Shorting every hanging man in a strong uptrend.
- Skipping confirmation.
- Stops inside the wick.
Professional Insight
The hammer is popular because it gives a natural stop: the low of the wick. If price trades back below that low, the buying that created the wick has failed. Experienced traders like setups where the invalidation is this clear.
Risk Considerations
- Long wicks mean wide stops; reduce position size.
- Hammers in strong downtrends often fail.
- Confirmation entries come at a worse price.
Important Terminology
| Term | Meaning |
|---|---|
| Hammer | Small body at the top, long lower wick, after a decline. |
| Hanging man | The same shape after a rise. |
| Lower wick | From the bottom of the body to the low. |
| Confirmation candle | The next candle closing in the expected direction. |
| Invalidation | The price at which the setup's idea is wrong. |
What is a hammer candlestick?
A candle with a small body near the top of its range and a long lower wick, appearing after a decline.
What is the difference between a hammer and a hanging man?
The shape is the same. A hammer follows a decline; a hanging man follows a rise.
Does a hammer's colour matter?
Less than its shape and location. Some traders treat a green hammer as slightly stronger.
Where do I put the stop on a hammer trade?
Usually below the hammer's low, with a small buffer.
Is a hanging man always bearish?
No. It's a warning that needs confirmation from the next candle, and it often fails in strong uptrends.
Is the hammer a reliable bullish pattern?
Not on its own in our data. Across two years of daily data for 25 markets, hammers bought at their close performed about the same as the same trade on any candle. Confirmed hammers looked better, but on too few trades to rely on.
Should I wait for confirmation after a hammer?
It is a sensible rule. In a real Asian Paints example from October 2026, waiting for a close above the hammer's high skipped one hammer-like candle that failed and accepted a second that reached its target.
Practical Exercise
Collect hammers.
Your task
Step 1: Find ten hammers
After declines, on daily charts.
Step 2: Check location
Were they at a marked support level?
Step 3: Track confirmation
Did the next candle close above the hammer's high?
Step 4: Record outcome
From the confirmation close, did price reach 2R before the stop?
Check Your Understanding
A hammer's lower wick is commonly at least:
Related Lessons
Previous: Doji Candlestick Patterns. Next: Inverted Hammer and Shooting Star. See also Price Rejection.