What Is Liquidity in Trading? Buy-Side and Sell-Side Liquidity on Real Charts
JustWolves is an educational platform and is not a SEBI-registered investment advisor. Trading financial instruments involves significant risk of loss and may not be suitable for all investors. Past performance is not indicative of future results. Read our full disclaimer →
What you'll learn
- Liquidity means orders waiting to be filled: stop losses, breakout entries and pending orders.
- Buy-side liquidity sits above highs; sell-side liquidity sits below lows. The names describe the waiting orders, not your trade.
- Liquidity is not volume: volume is what already traded, liquidity is what is still waiting.
- It collects at obvious places: swing highs and lows, old highs and lows, and especially equal highs and equal lows.
- Price is often drawn to these levels, but reaching them is not a signal on its own.
- Watch the close: back inside (18 August, 13 July) versus beyond and away (22 July).
In this article · 12 sections
What is liquidity in trading? It is the orders waiting to be filled, and on every chart they collect in two pools: buy-side liquidity above highs and sell-side liquidity below lows. If you know where they sit, you can see why price so often runs to an obvious level, and why that move does not always continue. This lesson builds the idea from zero, gives you three simple rules to mark liquidity yourself, and walks through three real gold (XAUUSD) charts from MetaTrader 5 (MT5), including one where a liquidity grab did not lead to a reversal.
What you will learn
- What liquidity in trading actually means
- Buy-side and sell-side liquidity, side by side
- Liquidity vs volume: a common mix-up
- Where liquidity collects: the liquidity map (8 levels)
- How to find liquidity on a chart: our three rules
- Real chart: buy-side liquidity, 18 August 2026
- Real chart: sell-side liquidity, 13 July 2026
- When it fails: 22 July 2026
- Common mistakes, key takeaways, FAQ and a quiz
1. What is liquidity in trading?
Every trade needs two sides. If you click buy, someone somewhere has to sell to you at that price. For a small retail order that's never a problem, because there are always enough sellers to fill a few lots. The picture changes when the order is large. A fund that wants to buy a big position in gold cannot simply press a button: at any single price there may not be enough sellers, and buying through several prices pushes the market against them as they fill.
So large orders need liquidity: lots of opposite orders resting at roughly the same price. In everyday trading language, liquidity means orders waiting to be filled. Three kinds of orders make up most of it:
- Stop losses. A stop on a short (sell) trade is a buy order waiting above price. A stop on a long (buy) trade is a sell order waiting below price.
- Breakout entries. Traders who plan to buy if price breaks above a level, or sell if it breaks below one, often use stop orders to enter. Those are resting orders too.
- Pending limit orders. Traders who want to buy or sell at a specific price they have chosen in advance.
When price reaches a level where many of these orders sit, they fill in a burst. For a few minutes there is plenty to trade against. So price often travels to an obvious high or low, touches it, and only then decides where to go next.
2. Buy-side and sell-side liquidity explained
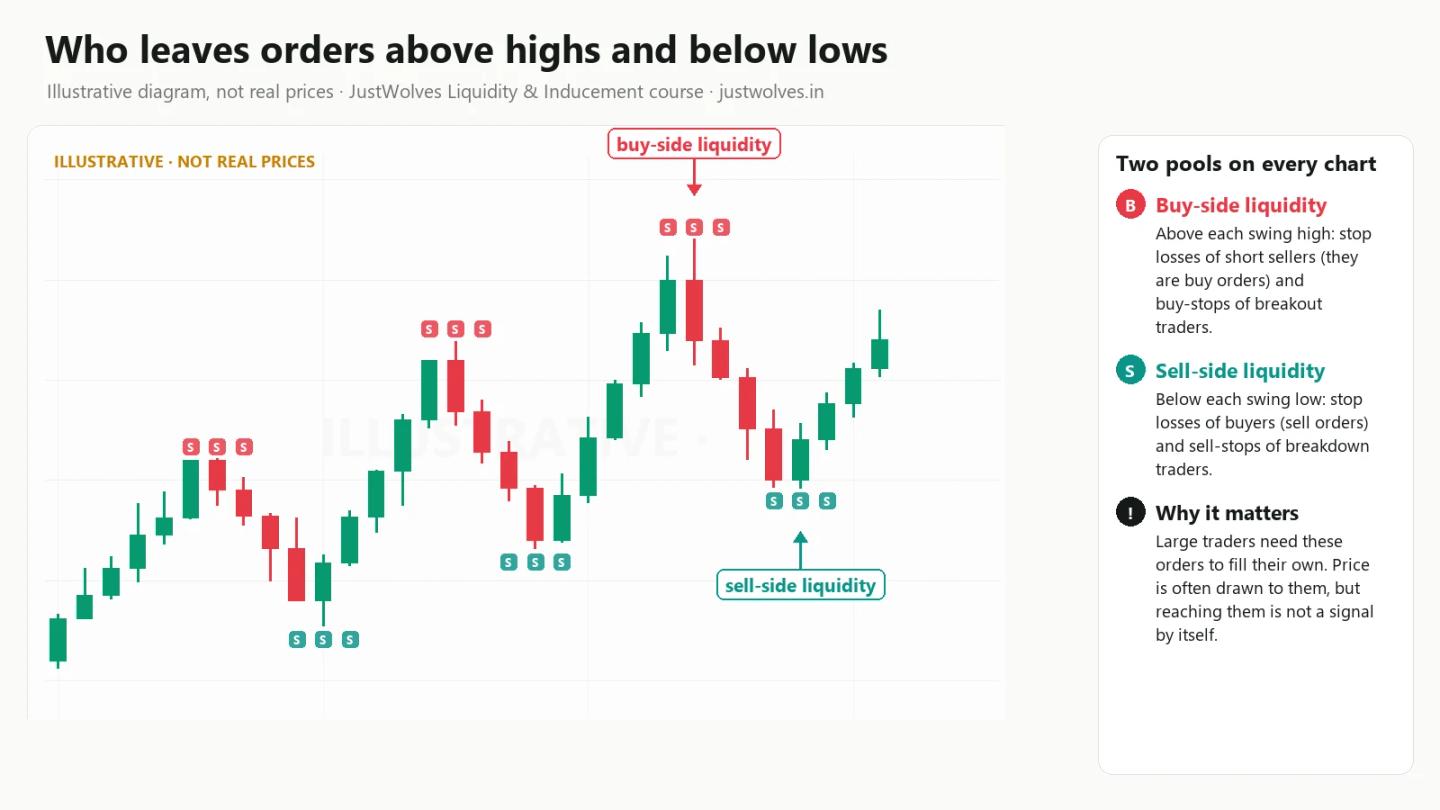
There are two kinds of liquidity, and their names describe the orders that are waiting, not the direction you should trade. Get this part right and the rest of the course is much easier.
Buy-side liquidity sits above price, above highs. Who has orders there?
- Traders who sold near the high and placed their stop loss just above it. Each of those stops is a buy order.
- Breakout traders who want to buy if price breaks above the high. Their entries are buy orders too.
Sell-side liquidity sits below price, below lows. Who has orders there?
- Traders who bought near the low and placed their stop loss just below it. Each stop is a sell order.
- Breakout traders who want to sell if price breaks below the low.
| Buy-side liquidity (BSL) | Sell-side liquidity (SSL) | |
|---|---|---|
| Where it sits | Above highs | Below lows |
| Whose orders | Sellers' stop losses and breakout buyers | Buyers' stop losses and breakout sellers |
| Order type waiting | Buy orders | Sell orders |
| What it is not | A reason to buy | A reason to sell |
The same idea on a real chart:
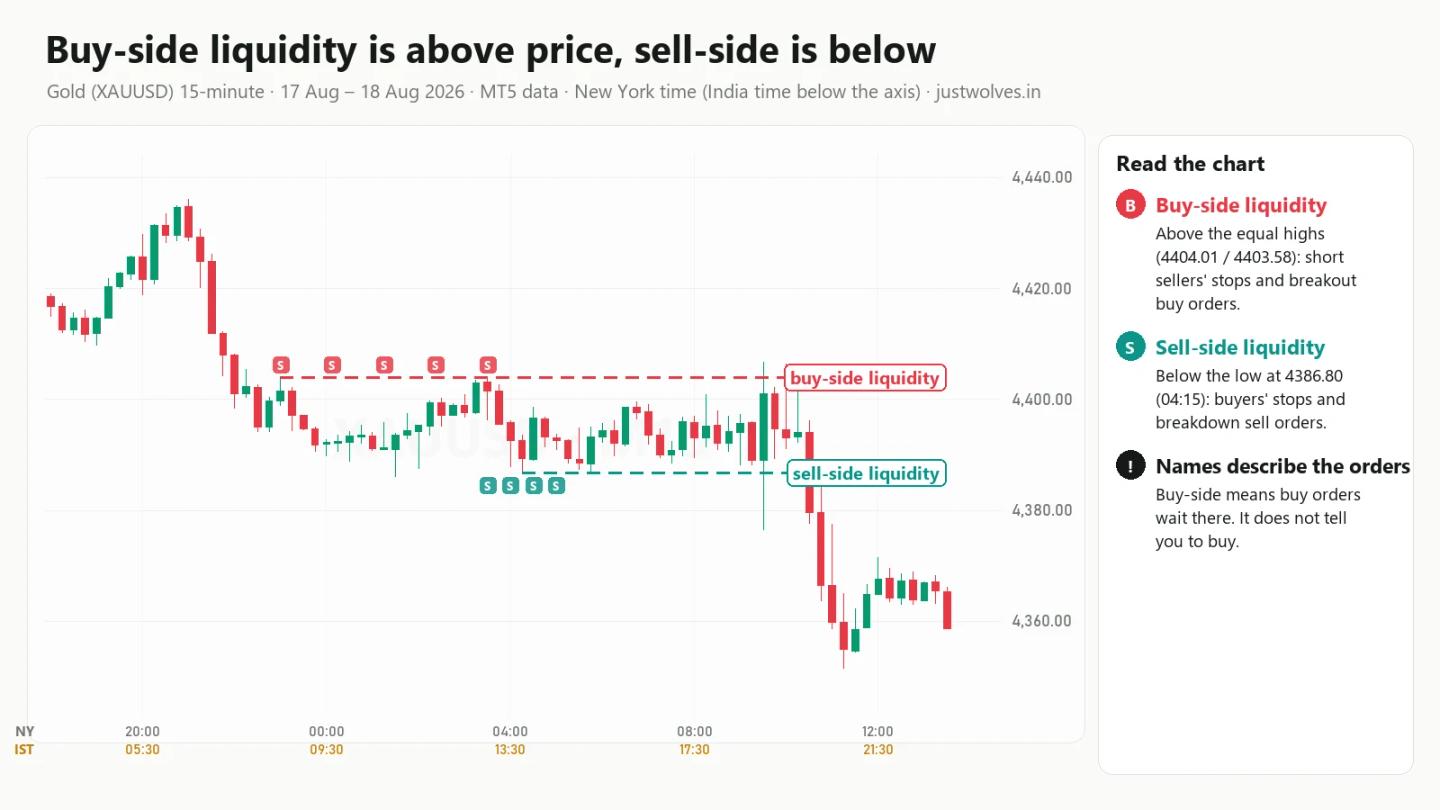
A quick way to remember it: buy-side is above, sell-side is below. When you read "price took buy-side liquidity", it simply means price traded up through a high and filled the buy orders waiting there.
3. Liquidity vs volume: a common mix-up
New traders often treat liquidity and volume as the same thing. They are related, but they are not the same.
- Volume measures what has already traded during a candle. It looks backwards.
- Liquidity, in the way this course uses the word, means orders that are still waiting at a price. It is about what could fill next.
A quiet market can have a lot of liquidity resting above an obvious high while very little volume trades. Then, when price reaches that high, the waiting orders fill and volume jumps. In other words, liquidity is the stored fuel and the volume spike is the fuel burning. You can see it on a real chart: on 18 August 2026, the 15-minute candle that ran into the equal highs at the New York open had the highest tick volume of all 79 candles on the chart, 7,318 ticks against a median of 2,839.
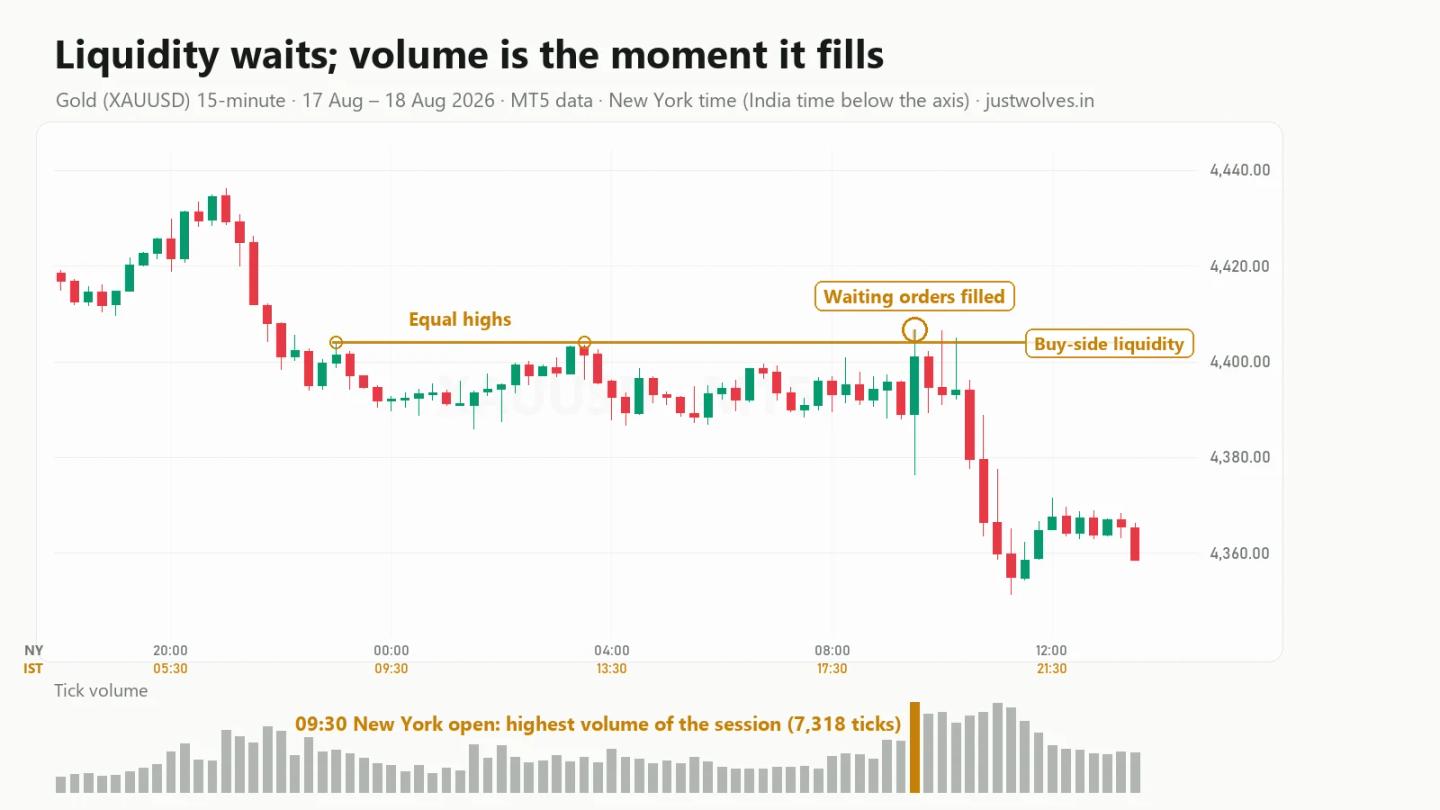
Keeping the two apart will make every later lesson easier.
4. Where liquidity pools collect: the liquidity map
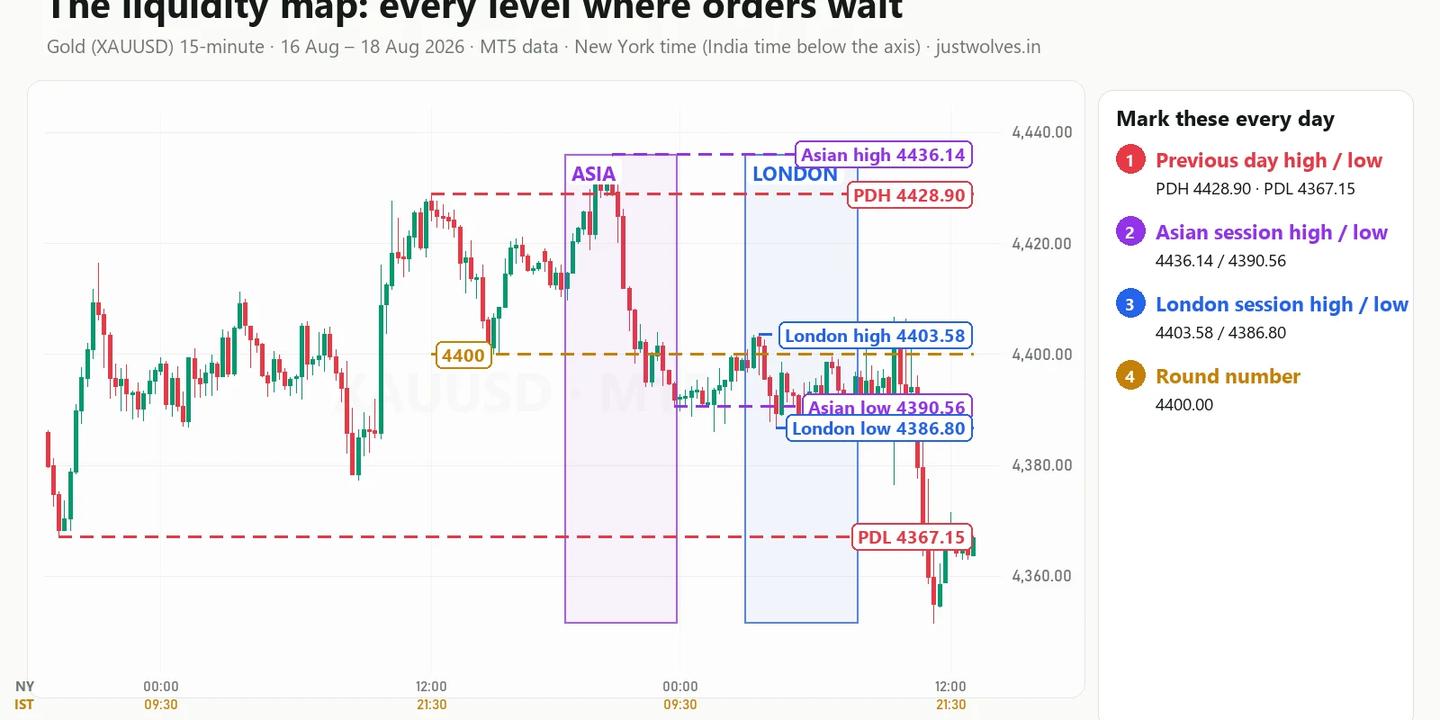
Liquidity is not spread evenly across a chart. It collects wherever many traders make the same decision at the same price, and that happens at levels that look obvious. Before looking at each one, here is a single real trading day with all of them marked, so you can see how many places orders can wait at once.
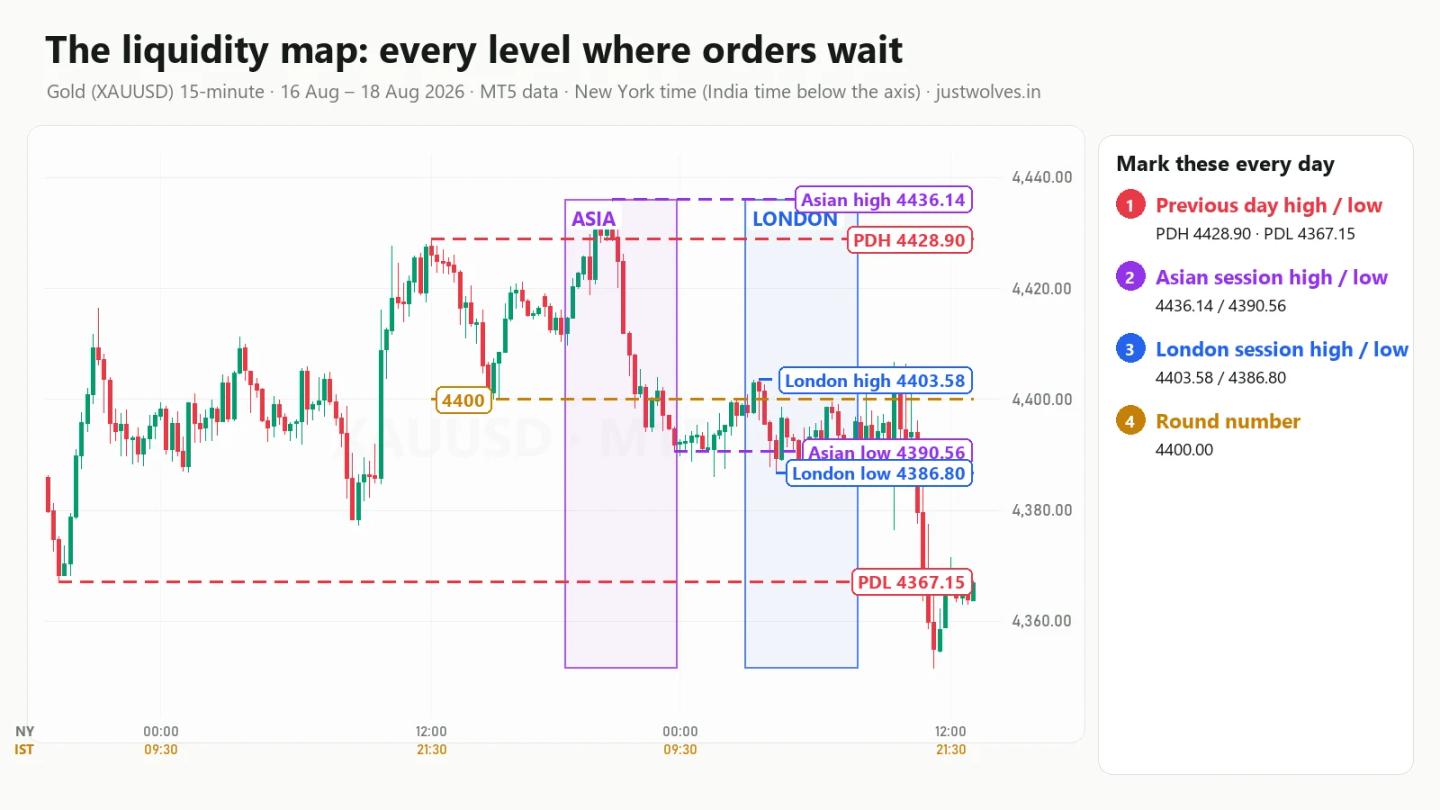
Think of these levels as a map of where stop losses and breakout orders are likely to be waiting. Price does not have to visit every one, but on most days it travels from one pool to the next. Here are the eight levels you will use throughout this course, each with a real example.
4.1 Swing highs and swing lows
The clear turning points on a chart. Anyone who looks at the chart can see them, so stops naturally cluster just beyond them: above a swing high (buy-side) and below a swing low (sell-side). In section 5 you will see the exact rule we use to mark them.
4.2 Equal highs and equal lows
When price stops twice at the same price, many traders read it as "strong resistance" or "strong support". They sell just under equal highs with stops just above, or buy just above equal lows with stops just below. That stacks a lot of orders in one tight band, which is why the main examples in sections 6 to 8 use equal highs and lows.
4.3 Previous day high and low (PDH and PDL)
Yesterday's high and low are the most watched reference points on any intraday chart. In this course a trading day runs from 17:00 to 17:00 New York time, the standard forex and gold day.
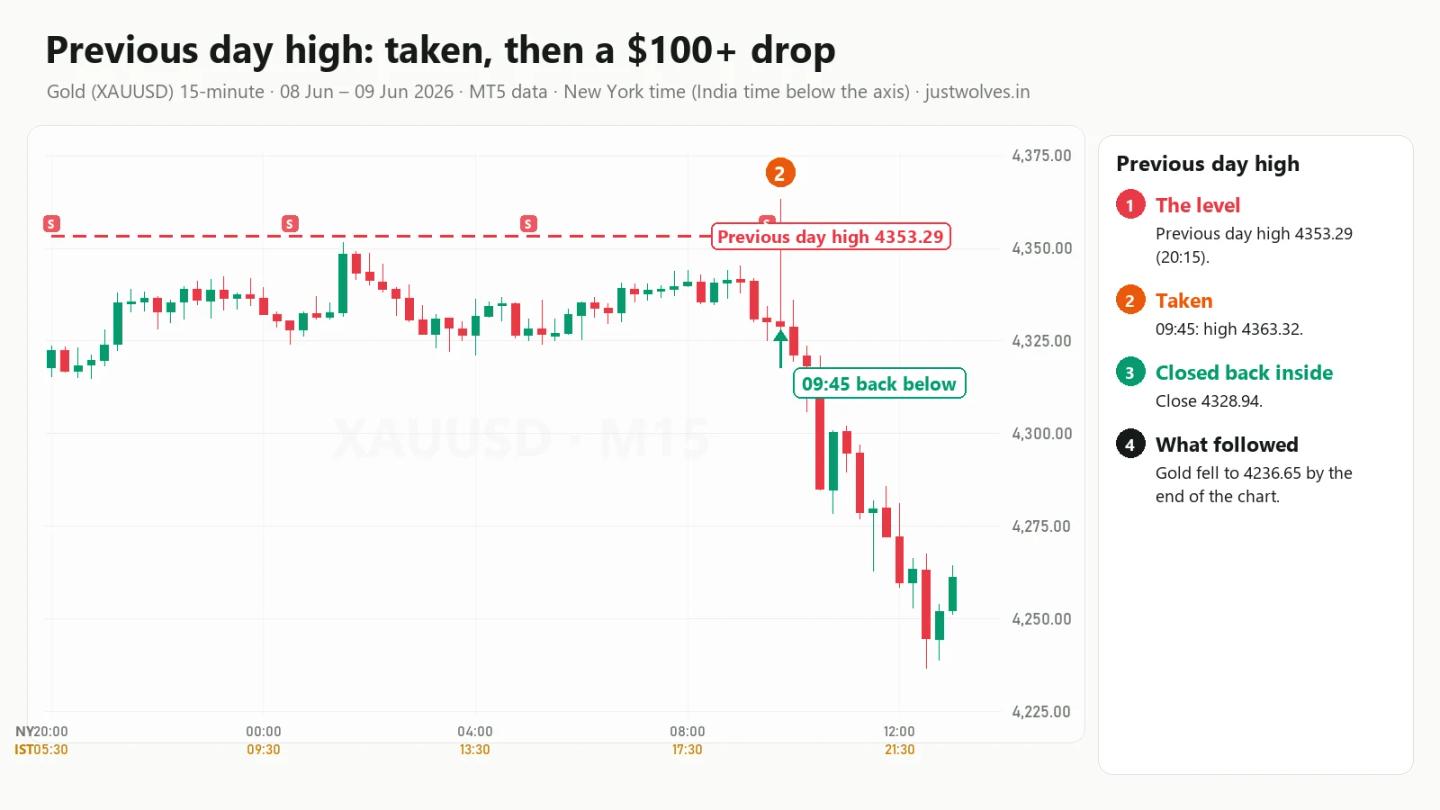
On Tuesday 9 June 2026, the previous day high was 4353.29, set at 20:15 New York time on the Sunday evening that opened Monday's trading day. At 09:45 on Tuesday, a candle traded up to 4363.32, the first trade above that level, and closed back below at 4328.94. By 12:30 gold had fallen to 4236.65, more than $116 below the previous day high.
On the liquidity map above, both levels were taken in one trading day: gold traded above the previous day high at 20:00 New York time on 17 August, and below the previous day low at 10:45 on 18 August.
4.4 Previous week high and low (PWH and PWL)
The same idea on a bigger scale. Swing and position traders place stops beyond last week's high and low, so these levels often hold a large pool of orders. In this course a trading week runs from Sunday 17:00 to Friday 17:00 New York time.
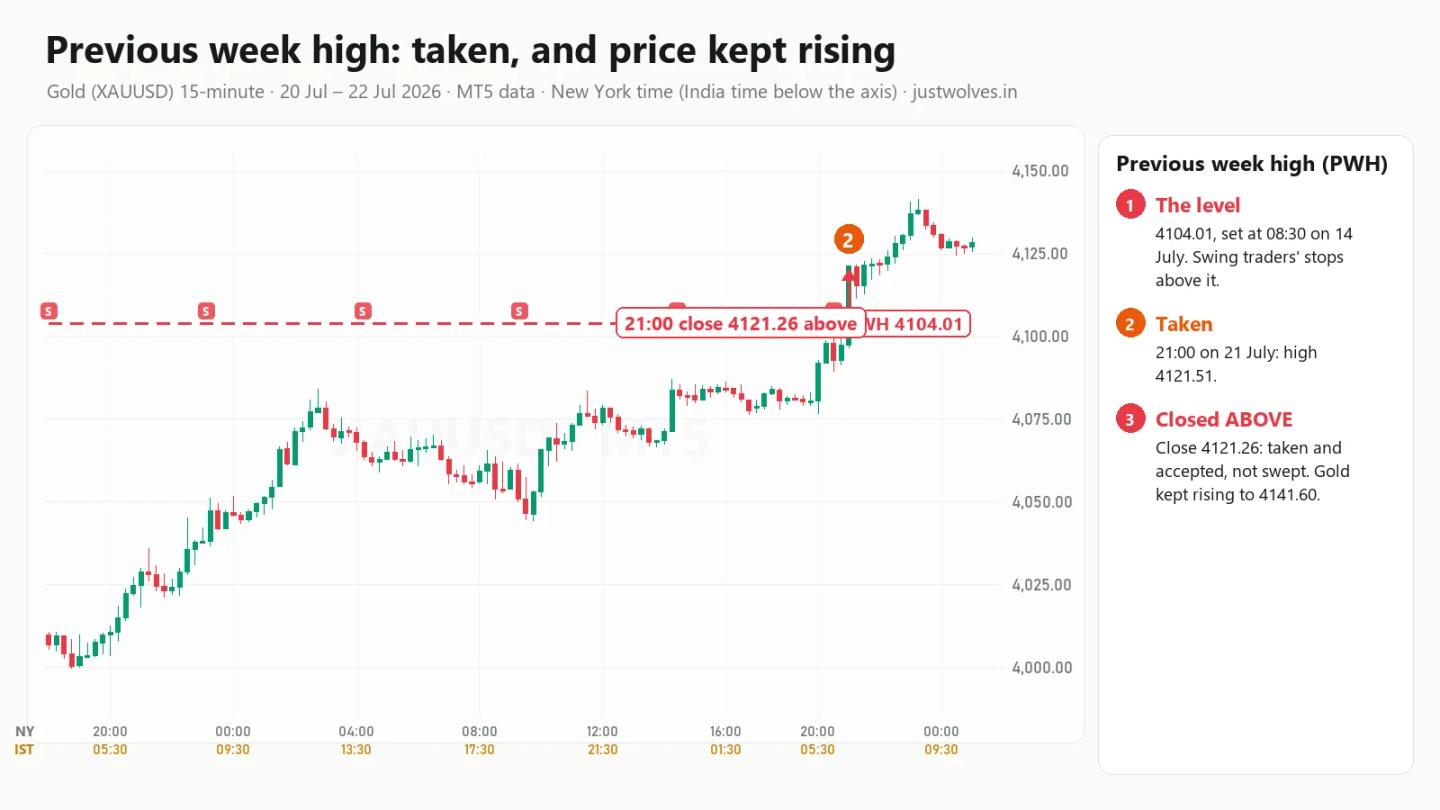
The previous week high on gold was 4104.01, set at 08:30 New York time on 14 July. At 21:00 on Tuesday 21 July, a candle traded through it and closed above at 4121.26. In the next four hours not one candle closed back below the level, and gold reached 4141.60 by 23:15. This is a level being taken and accepted, not swept, and it happened the evening before the failed example you will see in section 8.
4.5 Asian session high and low
The Asian session is usually the quietest part of the gold day, so it often builds a small range. In this course we use 19:00 to 00:00 New York time (04:30 to 09:30 in India during US summer time). The high and low of that range attract stops and breakout orders that London and New York traders often run into.
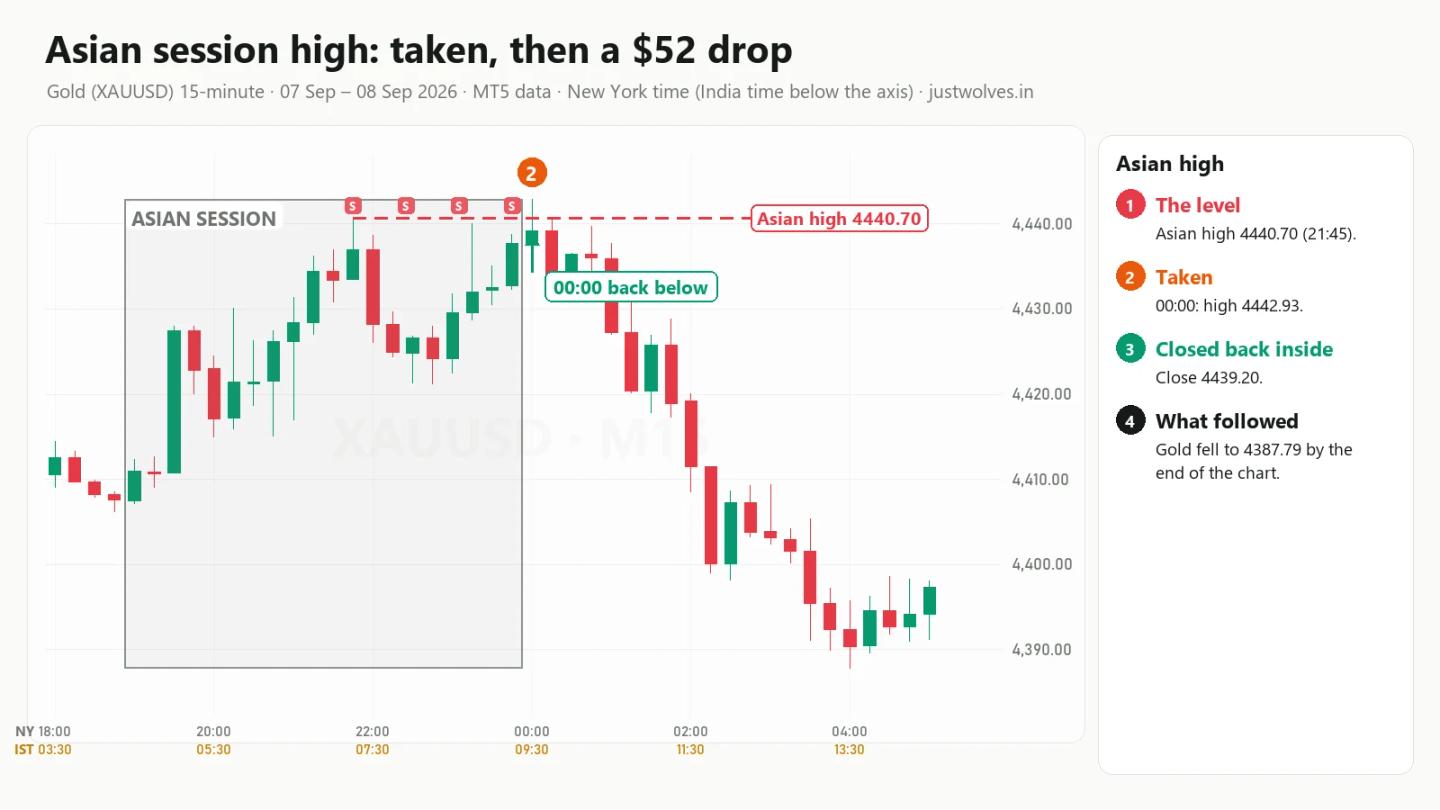
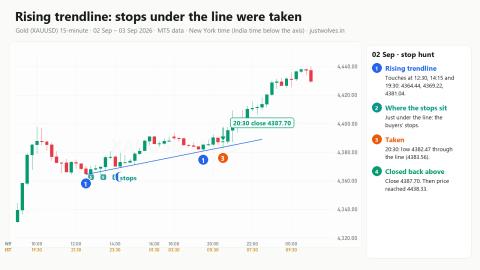
On 7–8 September 2026 the Asian high was 4440.70, set at 21:45 New York time. At 00:00 a candle traded up to 4442.93 and closed back below at 4439.20. No candle closed above the level for the next four hours, and by 04:00 gold had fallen to 4387.79, almost $53 lower.
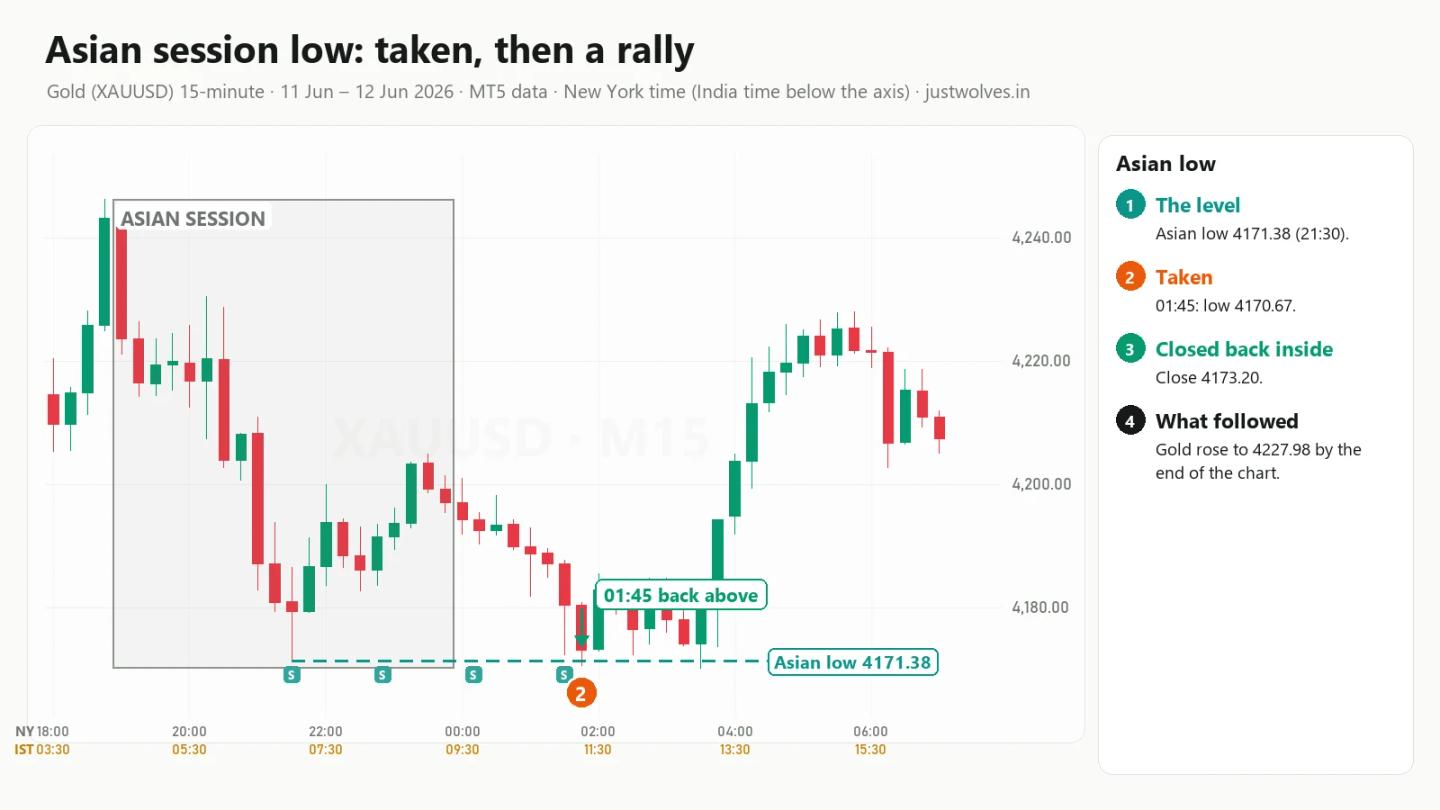
The mirror image on 11–12 June: the Asian low was 4171.38, set at 21:30. At 01:45 a candle dipped to 4170.67, closed back above at 4173.20, and by 05:45 gold had climbed to 4227.98, more than $56 higher.
4.6 London session high and low
London is where the day's volume usually arrives. In this course the London session is 03:00 to 08:00 New York time (12:30 to 17:30 in India during US summer time). When New York opens, traders often reach for the London high or low first.
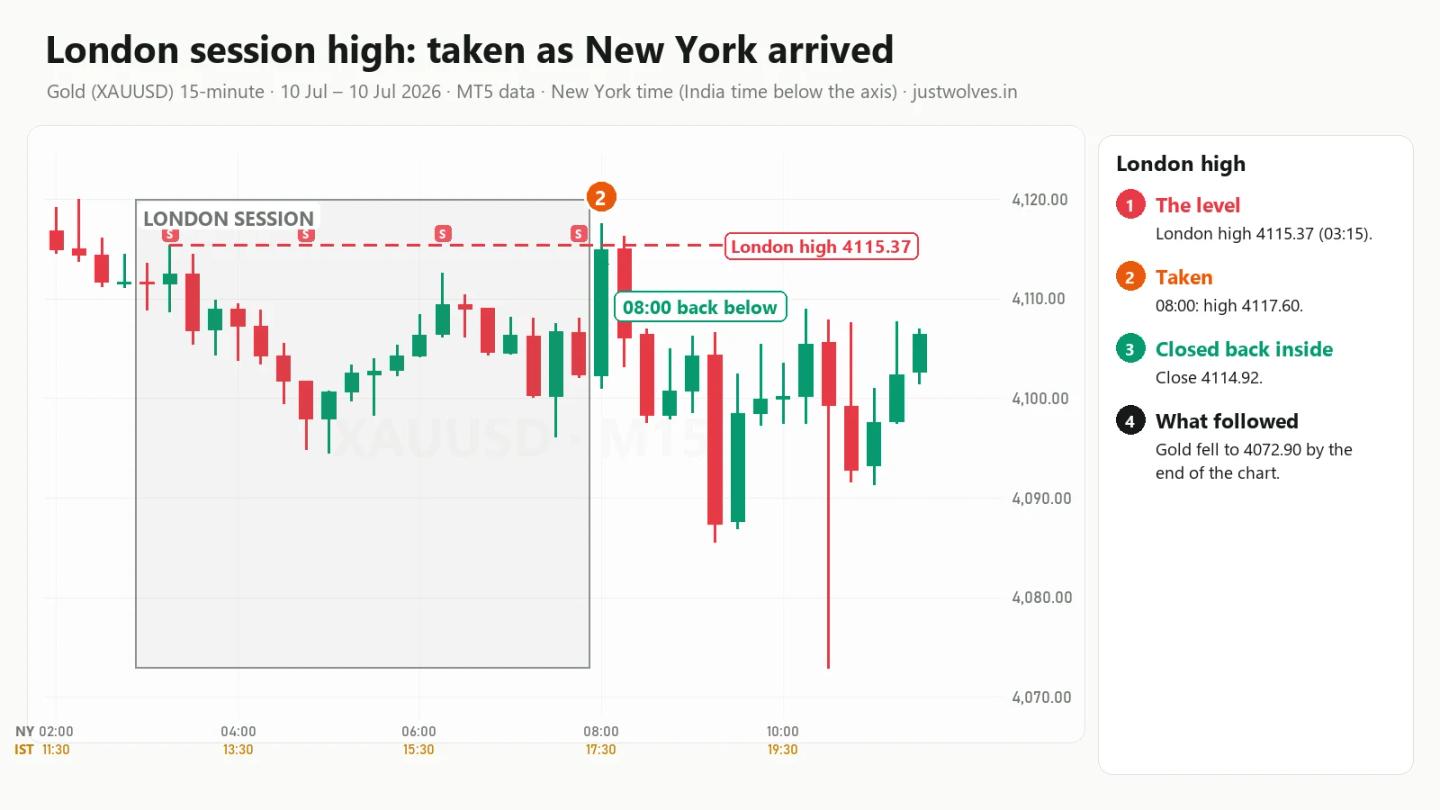
On Friday 10 July 2026 the London high was 4115.37, set at 03:15. At 08:00, as New York traders arrived, a candle traded up to 4117.60 and closed back below at 4114.92. By 10:30 gold had fallen to 4072.90, more than $42 below the London high.
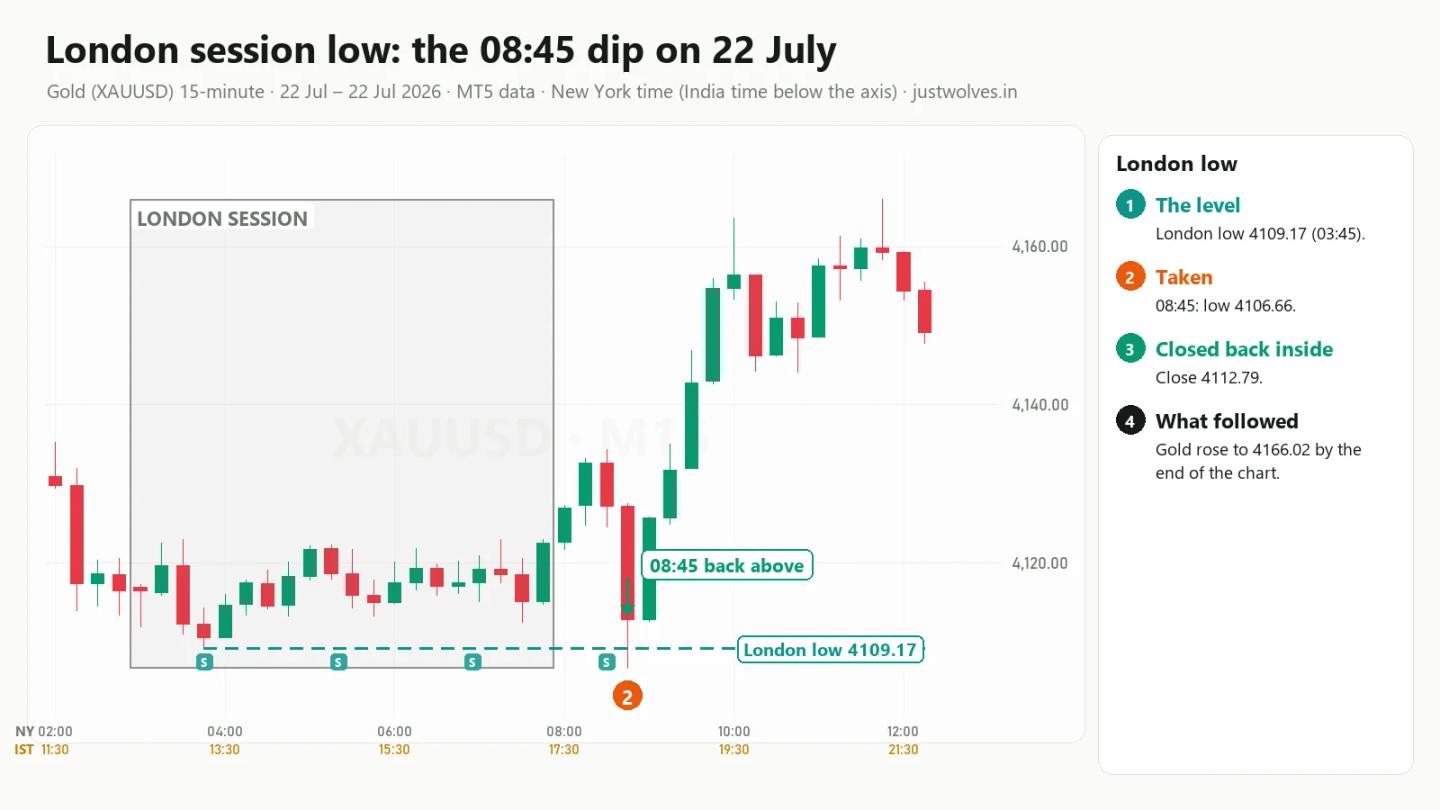
And the London low on Wednesday 22 July: 4109.17, set at 03:45. At 08:45 a sharp candle dipped to 4106.66, filled the sell-side liquidity below it, and closed back above at 4112.79. By 11:45 gold was at 4166.02. Keep this day in mind: in section 8 it is the failed example, and this dip is part of the reason.
4.7 Round numbers
Traders love round numbers. On gold, every $50 and $100 level (such as 4,400 or 4,450) attracts limit orders, stops and take-profit orders, simply because people choose round prices when they place orders.
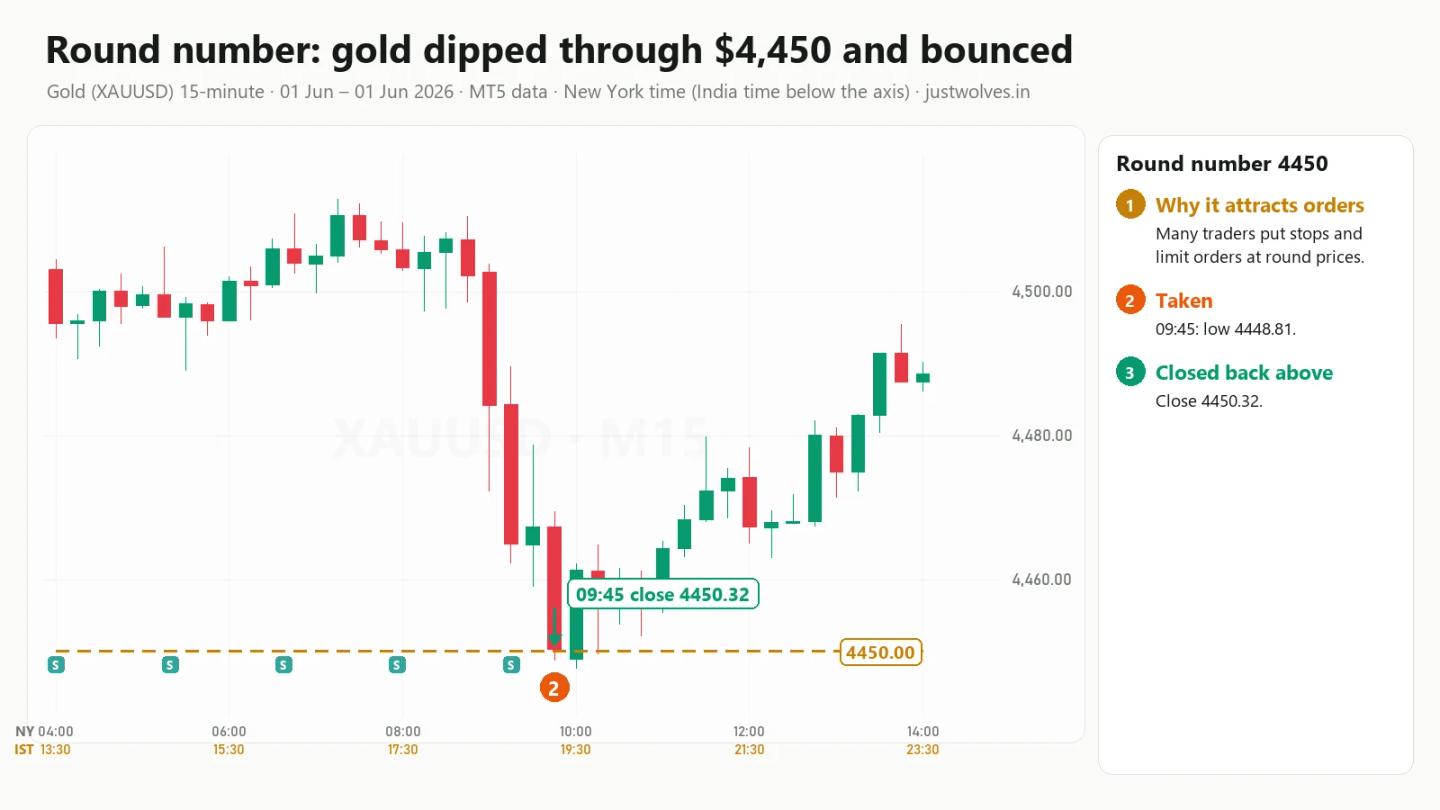
On Monday 1 June 2026, gold had stayed above 4,450 since Friday's close. At 09:45 New York time it dipped to 4448.81, the first trade below the round number, closed back above at 4450.32, and by 13:45 it had risen to 4495.47, about $45 higher. A round number is not magic; it simply concentrates orders, the same as any other obvious level.
4.8 Trendlines and textbook patterns
Trendlines, double tops and double bottoms, and "support" and "resistance" from trading books are all places where many traders put stops in the same spot. They are so important that Lesson 2 of this course, retail liquidity, is dedicated to them.
The liquidity map: cheat sheet
| Level | Where the liquidity sits | Whose orders | How we mark it |
|---|---|---|---|
| Swing high / low | Above the high / below the low | Stops of traders against the move, breakout entries | Two lower highs (or higher lows) on each side |
| Equal highs / lows | Just beyond the pair | Stops of traders who sold the highs / bought the lows | Two swings within $0.50, no close beyond in between |
| Previous day high / low (PDH / PDL) | Beyond yesterday's extremes | Intraday traders' stops and breakouts | High and low of the 17:00–17:00 New York day |
| Previous week high / low (PWH / PWL) | Beyond last week's extremes | Swing traders' stops | High and low of Sunday 17:00 to Friday 17:00 |
| Asian session high / low | Beyond the Asian range | Range traders' stops, London breakouts | 19:00–00:00 New York |
| London session high / low | Beyond the London range | London traders' stops, New York breakouts | 03:00–08:00 New York |
| Round numbers | Around every $50 / $100 on gold | Limit, stop and take-profit orders | Price levels ending in 00 or 50 |
| Trendlines and patterns | Just beyond the line or pattern | Textbook stops (Lesson 2) | Drawn by eye, so treat them as approximate |
This is also where the idea of stop hunting comes from. When price runs just beyond an obvious level, fills the stops and then reverses, traders say their stop was "hunted". Nobody outside the big firms can prove intent, and this course does not claim it. What we can measure is where orders are likely to sit and how price behaved when it got there.
5. How to find liquidity on a chart: our three rules
"Obvious" is a vague word, so this course replaces it with three rules you can apply on any chart. They are the exact rules our chart engine uses to draw every label you will see in this course, which means nothing here is drawn by eye.
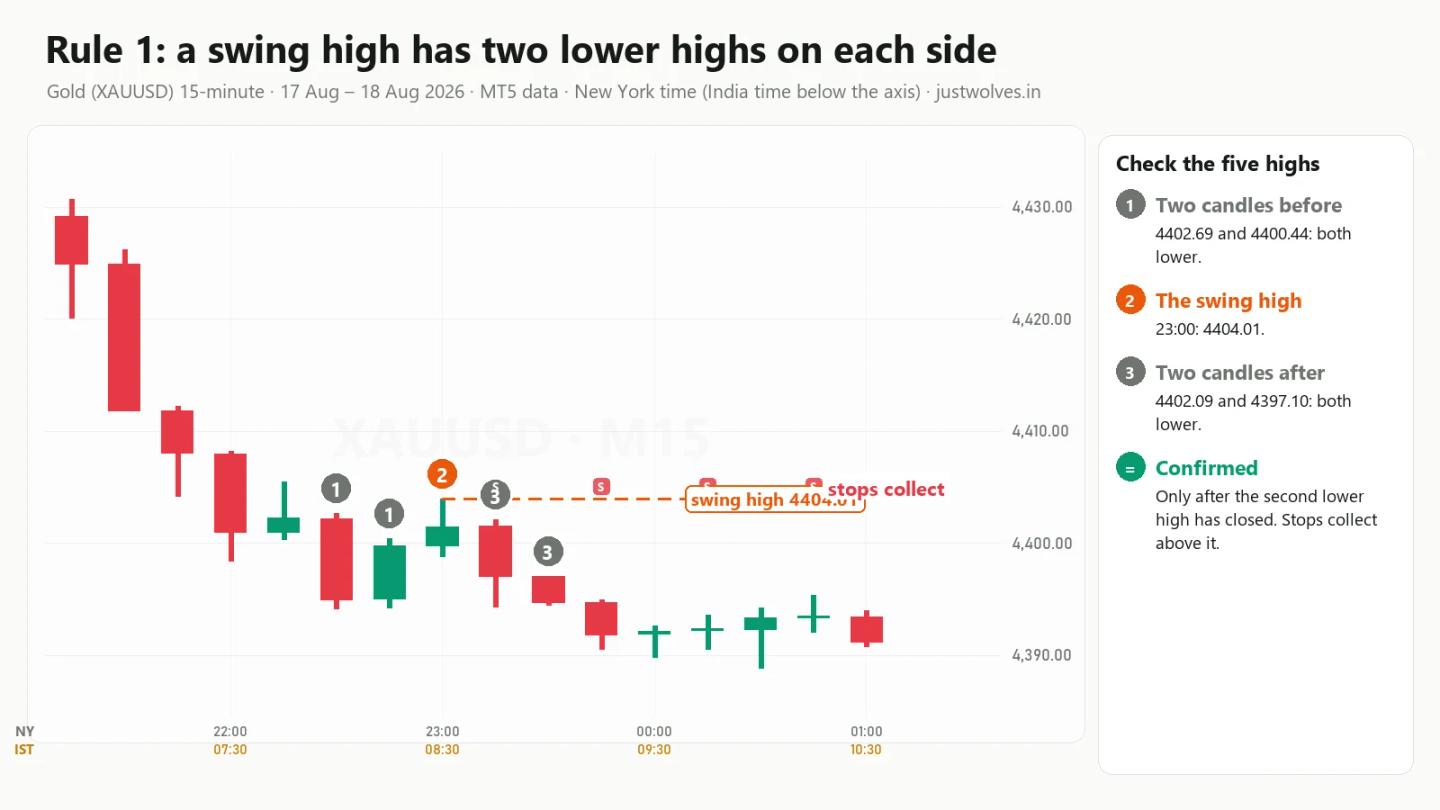
- Mark swing points. Call a candle a swing high when its high beats the highs of the two candles on each side of it. A swing low is the mirror image: a low below the two candles on each side.
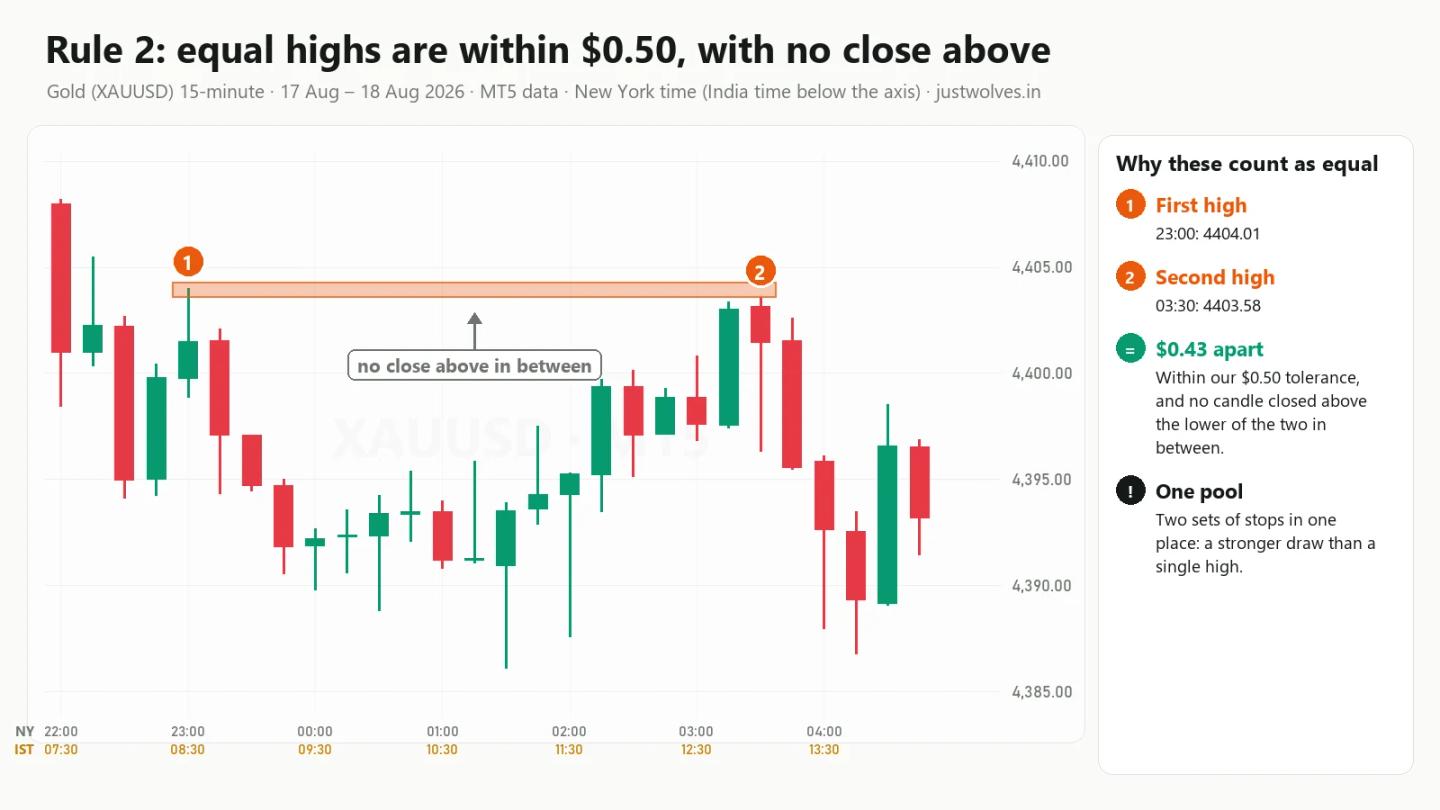
- Mark equal highs and equal lows. Two swing highs count as equal if they are within $0.50 of each other on gold and no candle between them closed above them. Equal lows work the same way below price. (On EUR/USD our charts use 2 pips.)
- Mark old highs and lows. Add the previous day's high and low, because many traders place orders there. Section 4.3 shows real examples. Then add the Asian and London session highs and lows, last week's high and low and nearby round numbers, and your chart becomes a full liquidity map.
Then draw each level to the right of the chart and label it: buy-side above price, sell-side below price. After a week of doing this you will start to see the same picture on almost every chart: price moving from one pool of liquidity to the next.
6. Real chart: buy-side liquidity on gold, Tuesday 18 August 2026
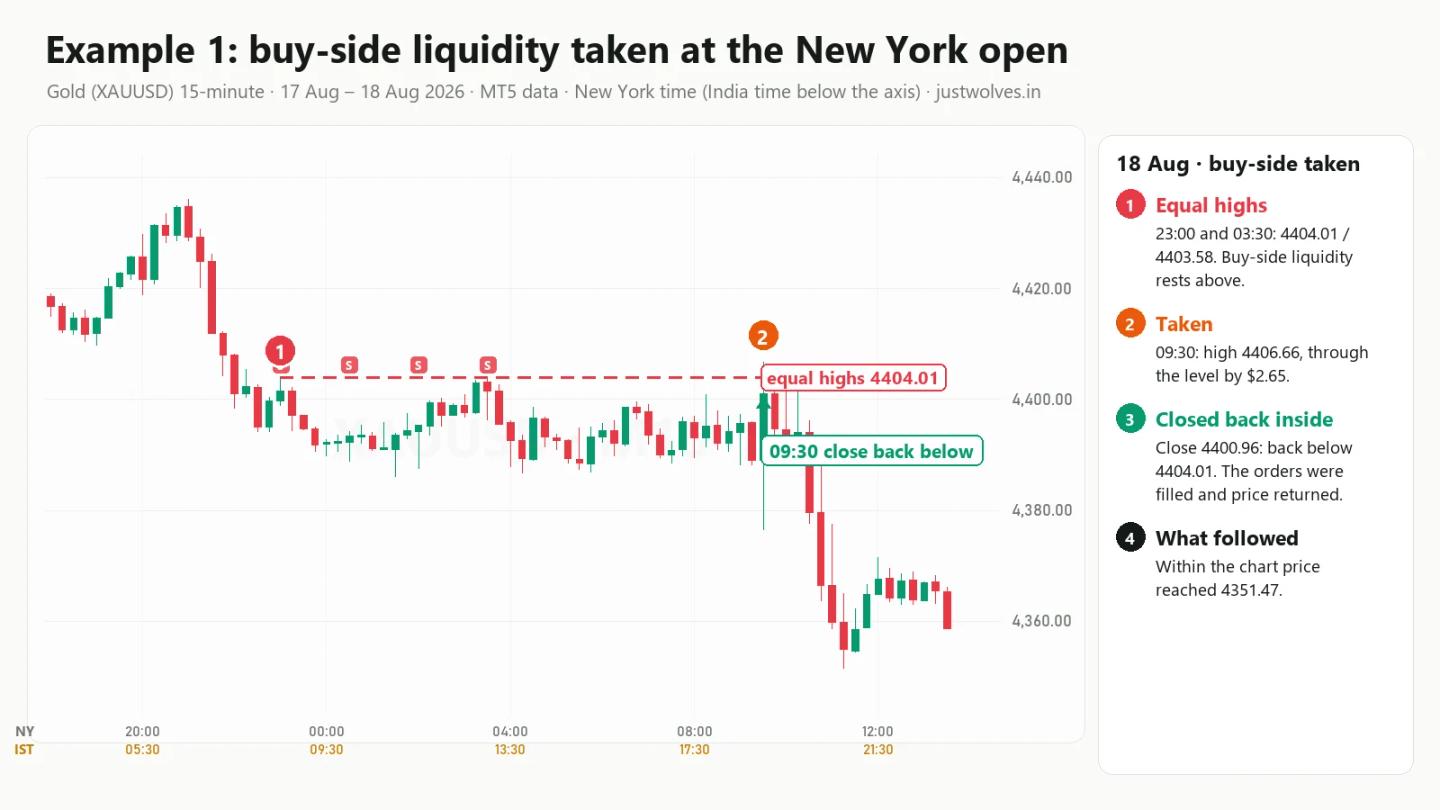
Here is how the idea looks on a real gold chart.
- The equal highs. At 23:00 New York time on 17 August, gold made a swing high at 4404.01. At 03:30 on 18 August it stopped again at 4403.58, less than half a dollar away. Under our rules, that is a pair of equal highs.
- The buy-side liquidity. Think about who has orders above 4404. Traders who sold near those highs have their stops just above. Breakout traders have buy orders just above. That is buy-side liquidity, sitting in one narrow band.
- The waiting. For the next six hours gold moved sideways below the level, through the London morning, in a range of about $16. Not one candle closed above 4404.01.
- The grab. At 09:30, the New York open (19:00 in India), a fast candle traded up to 4406.66, about $2.65 above the equal highs. The waiting buy orders were filled.
- The close. The same candle closed back below the level, at 4400.96. In the next four hours, not a single 15-minute candle closed above 4404.01.
- The move. By 11:15 gold had fallen to 4351.47, more than $52 below the equal highs, in under two hours.
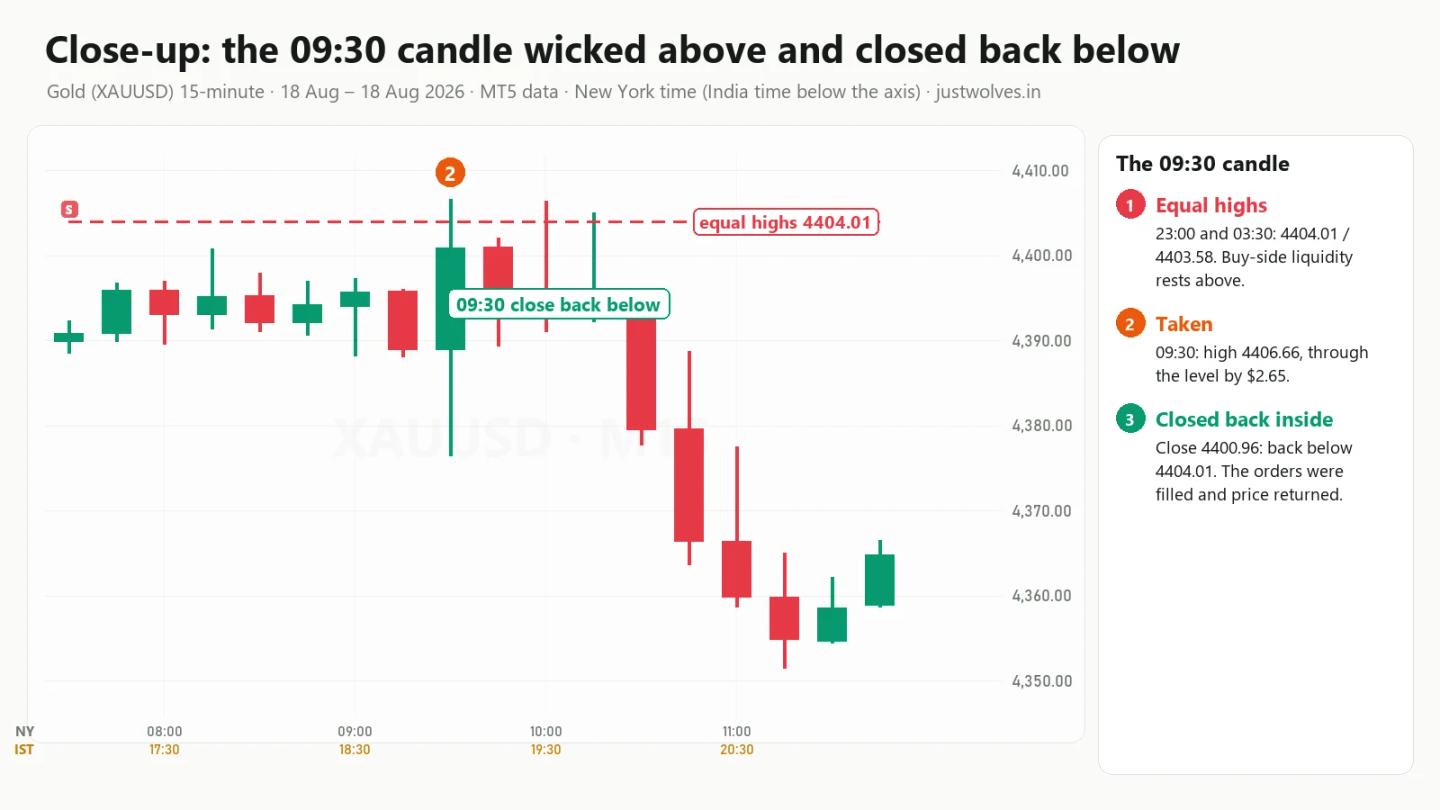
The buy-side liquidity was taken, and price turned down. Notice the order of events: the level formed, orders built up beyond it, price ran into them, then closed back inside. That close is the clue we will keep coming back to.
Interactive chart: gold 15-minute, 17–18 August 2026 (MT5 data)
Loading historical candles…
7. Real chart: sell-side liquidity on gold, Monday 13 July 2026
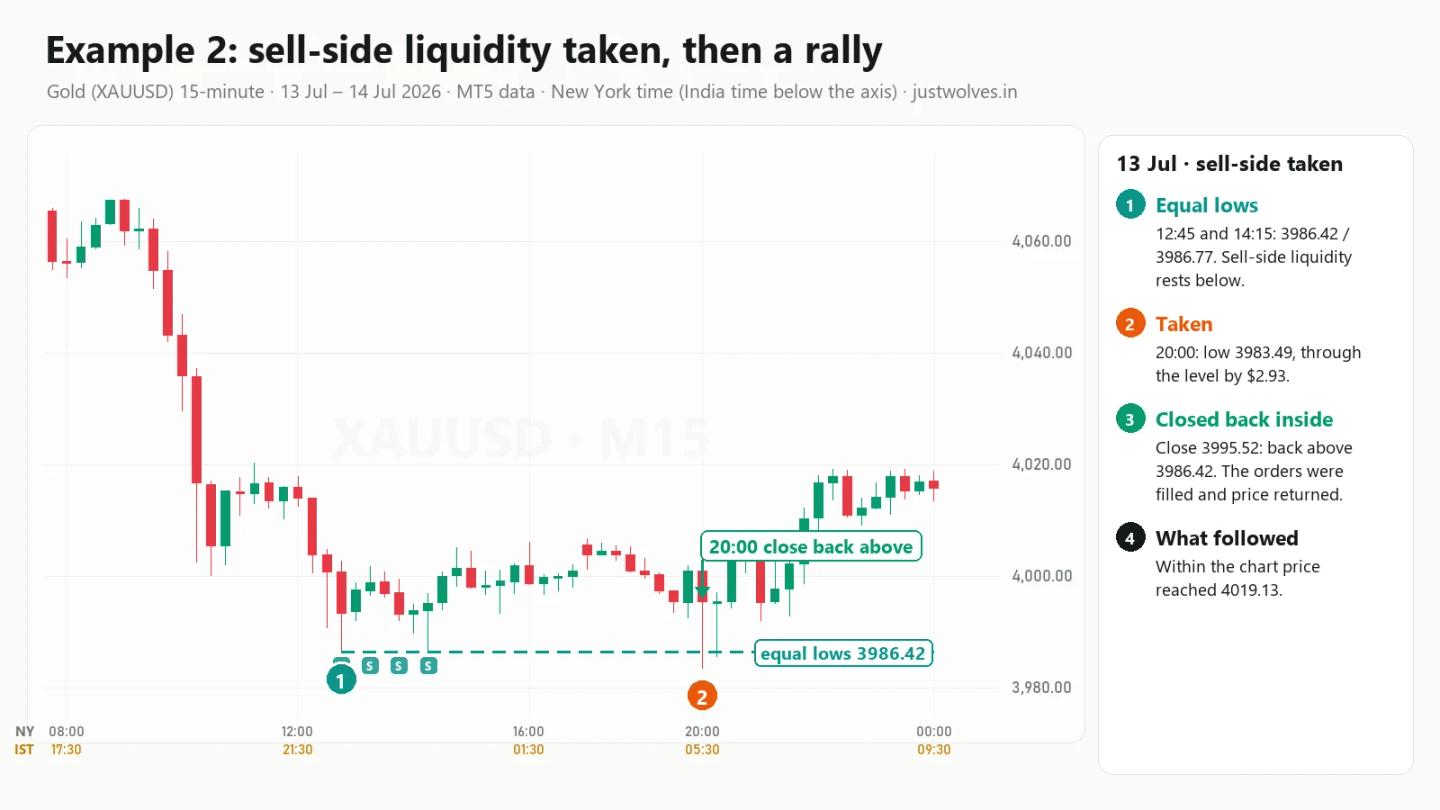
Now the same idea on the other side of the market.
- The context. Since Friday's close at 4119.67, gold had already fallen more than $100 by early Monday afternoon.
- The equal lows. At 12:45 New York time gold made a swing low at 3986.42. At 14:15 it came back down and stopped at 3986.77, just $0.35 away. A pair of equal lows.
- The sell-side liquidity. Below 3986 sat the stops of everyone who bought those lows, plus the sell orders of breakout traders waiting for a break lower.
- The grab. At 20:00 a candle dropped to 3983.49, about $2.93 below the equal lows, filling those sell orders.
- The close. That candle closed back above the level, at 3995.52.
- The move. By 22:15 gold had climbed to 4019.13, more than $32 above the equal lows.
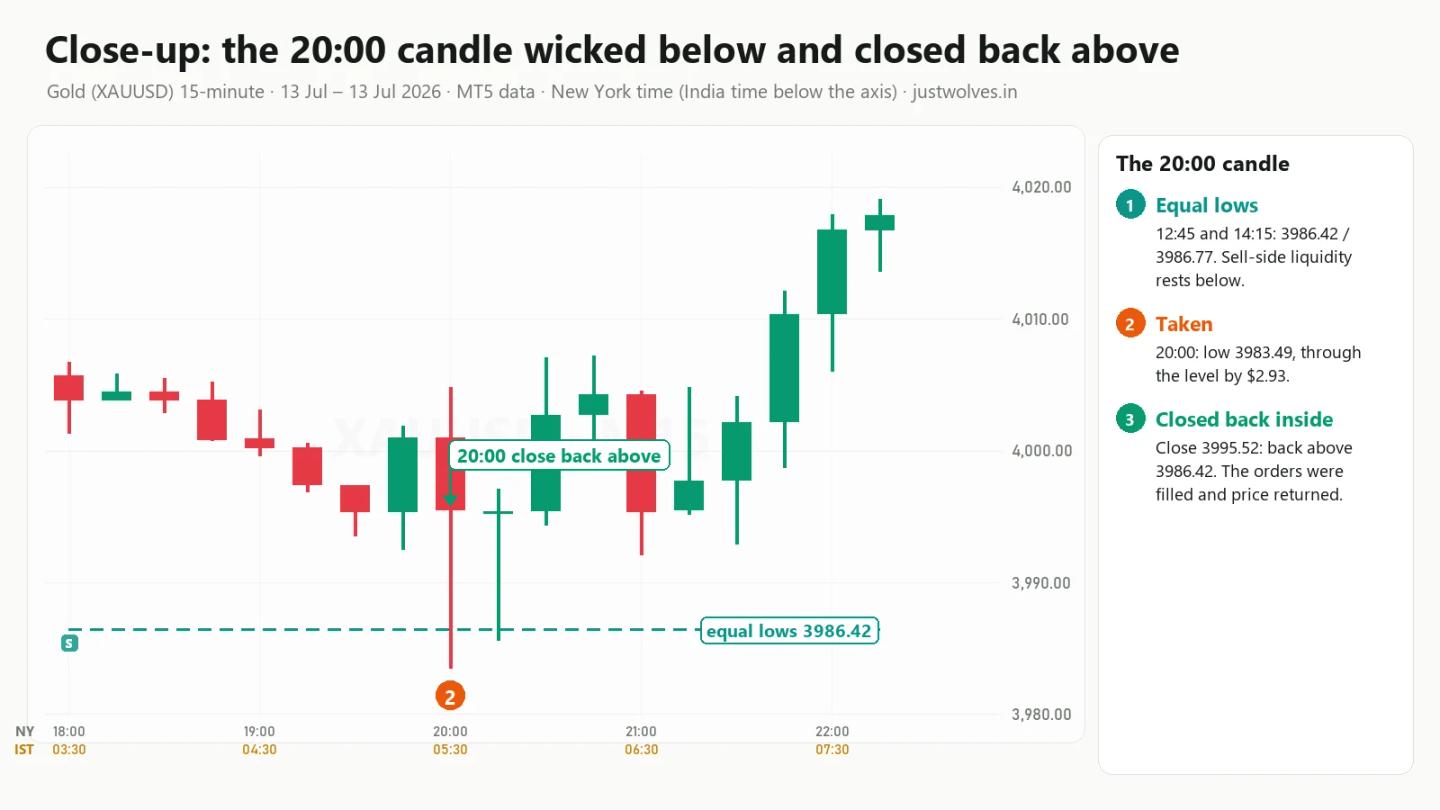
Interactive chart: gold 15-minute, 13 July 2026 (MT5 data)
Loading historical candles…
The same idea in both directions
Put the two examples side by side and the pattern is identical:
- An obvious equal level forms.
- Orders stack up just beyond it.
- A quick move through the level fills them.
- Price closes back inside the level and moves the other way.
This sequence is often called a liquidity sweep, and it has its own lesson later in this course and in our liquidity sweep guide. But be careful with step 4. Liquidity being taken does not guarantee a reversal, and the next chart shows exactly why.
8. When it fails: Wednesday 22 July 2026
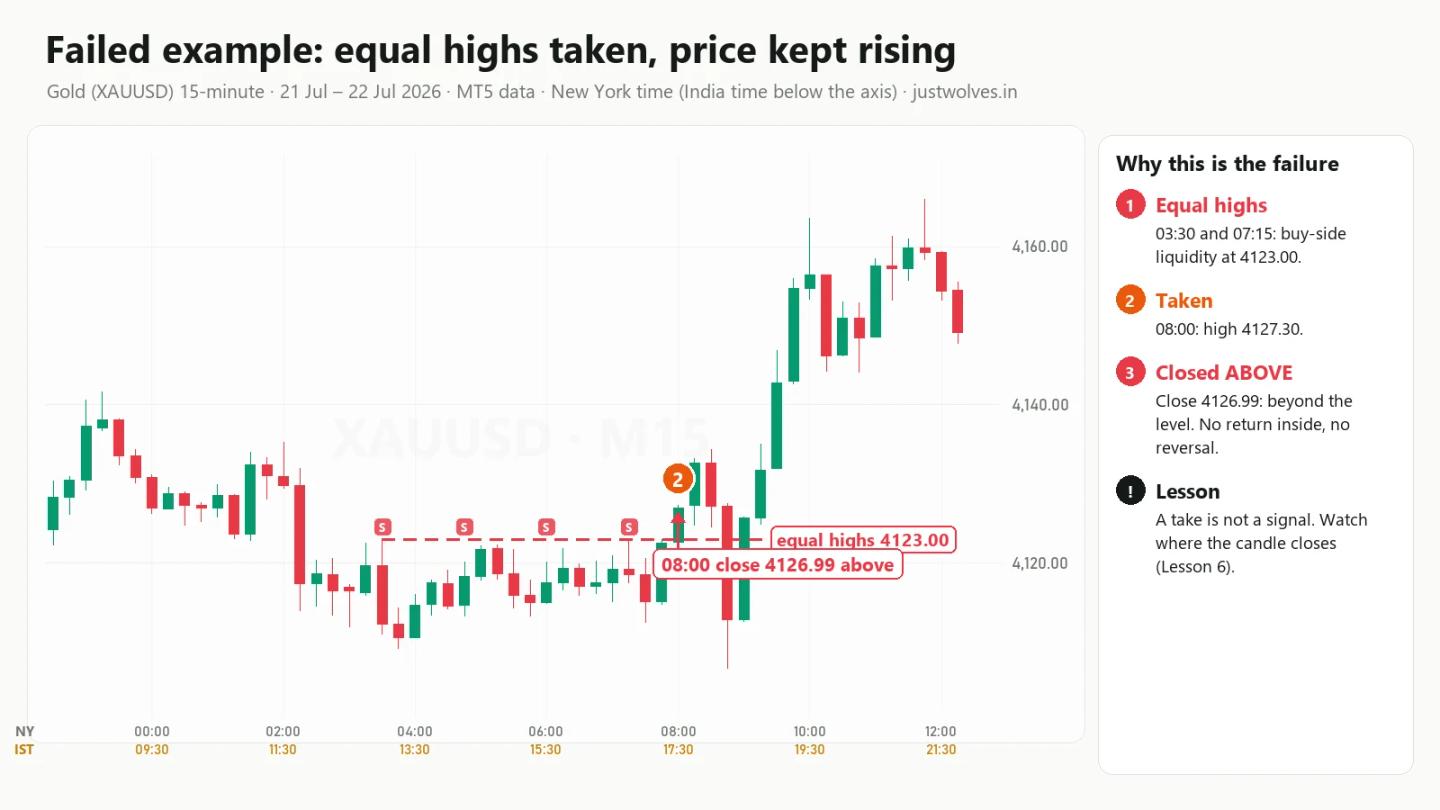
- The equal highs. At 03:30 gold made a swing high at 4122.95, and at 07:15 another at 4123.00, only five cents apart. Buy-side liquidity, set up exactly like the first example.
- The grab. At 08:00 price traded above the equal highs.
- The difference. This time the candle closed above the level, at 4126.99, instead of closing back below it. Of the next 16 candles, 15 also closed above 4123. At 08:45 price dipped sharply to 4106.66, but it did not stay down.
- The move. By 11:45 gold had reached 4166.02, more than $43 above the equal highs. Anyone who sold "because the liquidity was taken" was on the wrong side.
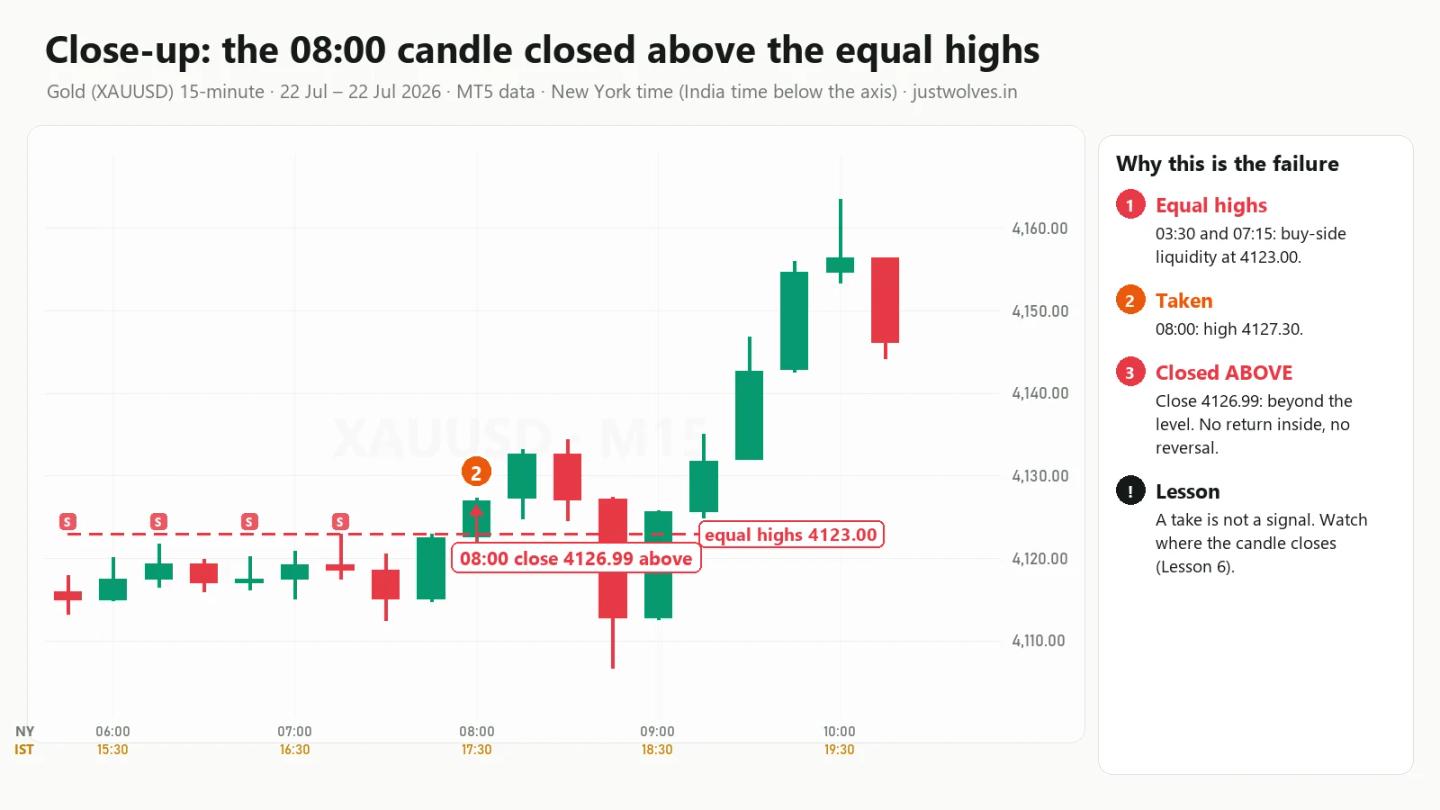
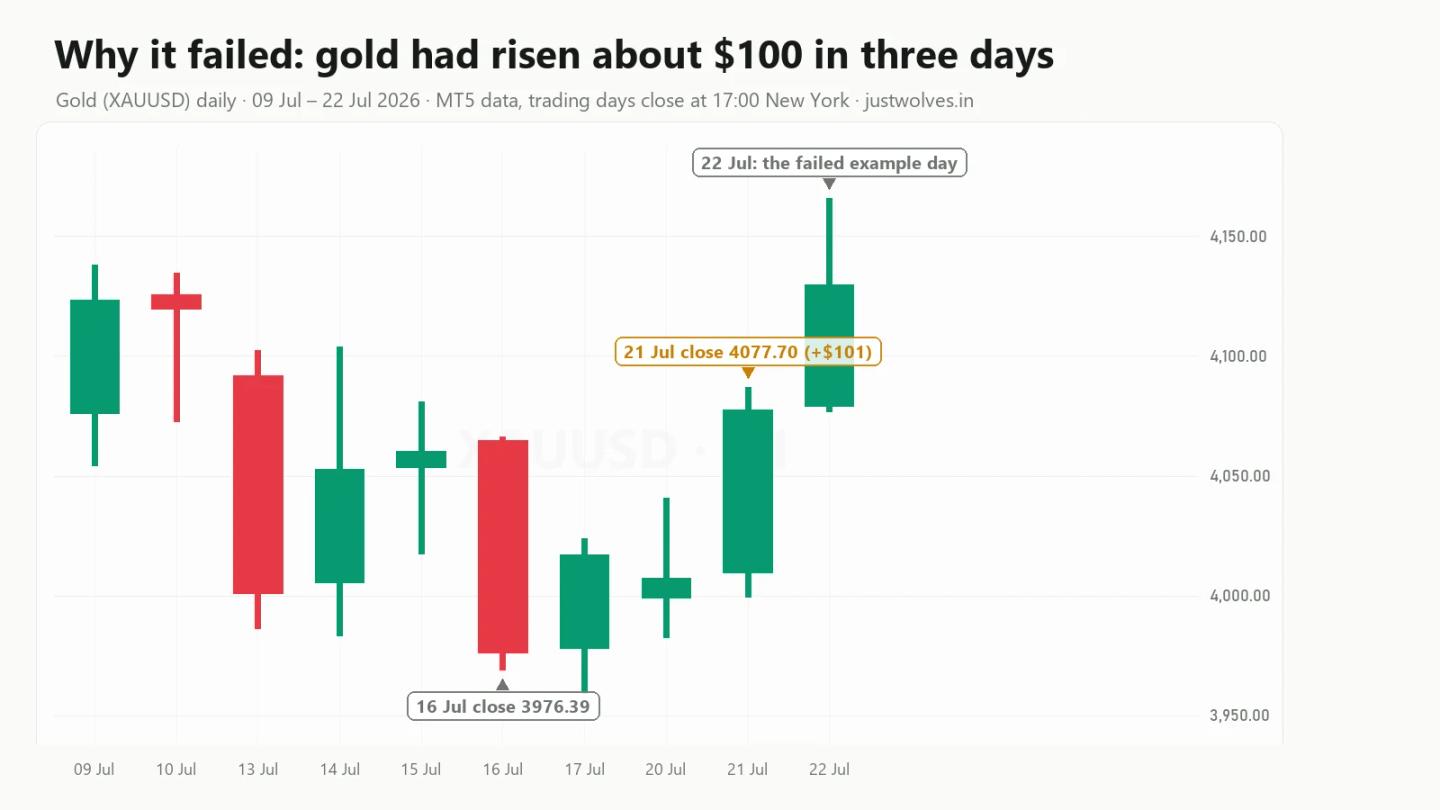
Why was this day different? Look at the bigger picture. On the daily chart, gold had already risen about $100 over the three trading days before, from a close of 3976.39 on 16 July to 4077.70 on 21 July. In a strong move, taking the highs can be the start of the next leg, not the end of the move.
Interactive chart: gold 15-minute, 21–22 July 2026 (MT5 data)
Loading historical candles…
Common mistakes with buy-side and sell-side liquidity
- Trading the name. Buying because "buy-side liquidity" sits above price, or selling because of "sell-side liquidity". The names describe waiting orders, not your trade.
- Calling every high liquidity. Use the rules. Two random highs $5 apart are not equal highs, and a high that was already broken by a close no longer holds the same orders.
- Ignoring the close. A wick through a level and a close through a level are different events. On 18 August and 13 July price closed back inside; on 22 July it closed beyond and kept going.
- Ignoring the bigger trend. The failed example came after a $100 three-day rise. Always check the higher timeframe before expecting a reversal.
- Putting your own stop in the obvious place. If your stop sits exactly where everyone else's does, it is part of the liquidity. Later lessons show how to place stops with that in mind.
Homework
Open a 15-minute chart of gold or EUR/USD. Using the three rules in section 5, mark three equal highs or equal lows from last week. For each one, write down:
- When the level formed (date and time).
- When price reached it.
- Whether that candle closed back inside or closed beyond the level, and what happened over the next few hours.
Keep the notes. In Lesson 6 you will use them to practise reading the reaction.
Practise on the live gold chart
● LiveFrequently Asked Questions
What is the difference between buy-side and sell-side liquidity?
Buy-side liquidity is the pool of buy orders (sellers' stop losses and breakout buys) above highs. Sell-side liquidity is the pool of sell orders (buyers' stop losses and breakout sells) below lows.
Is liquidity the same as volume?
No. Volume counts trades that have already happened. Liquidity, as used in this course, means orders still waiting at a price.
Does price always reverse after taking liquidity?
No. On 22 July 2026 gold took the buy-side liquidity above equal highs, closed above the level and rose more than $43. The close and the higher-timeframe trend matter.
Why do equal highs and equal lows attract price?
They look like strong levels, so many traders place stops just beyond them. That concentrates a lot of orders in a small area, which makes the level a natural target.
Does this work in forex and on every timeframe?
The idea of resting orders applies to any liquid market and timeframe. This course uses gold and EUR/USD on MT5 chart data. Always test it on your own market before using it with real money.
Do banks and institutions really hunt stop losses?
Nobody outside those firms can prove intent. What we can measure is where orders are likely to sit and how price behaved when it reached them, which is the approach this course takes.
Test Your Knowledge
Where does buy-side liquidity sit?
Related lessons
Education only. Not investment advice or a recommendation to trade. JustWolves is not a SEBI-registered adviser. Charts use historical MT5 chart data picked to explain a concept; they are not a record of real trades. Trading forex and commodities involves substantial risk of loss.