How to Find Daily Bias: Draw on Liquidity Tested, Plus a Trading Checklist
JustWolves is an educational platform and is not a SEBI-registered investment advisor. Trading financial instruments involves significant risk of loss and may not be suitable for all investors. Past performance is not indicative of future results. Read our full disclaimer →
What you'll learn
- A narrative is a written set of hypotheses about where liquidity sits and which pool comes next.
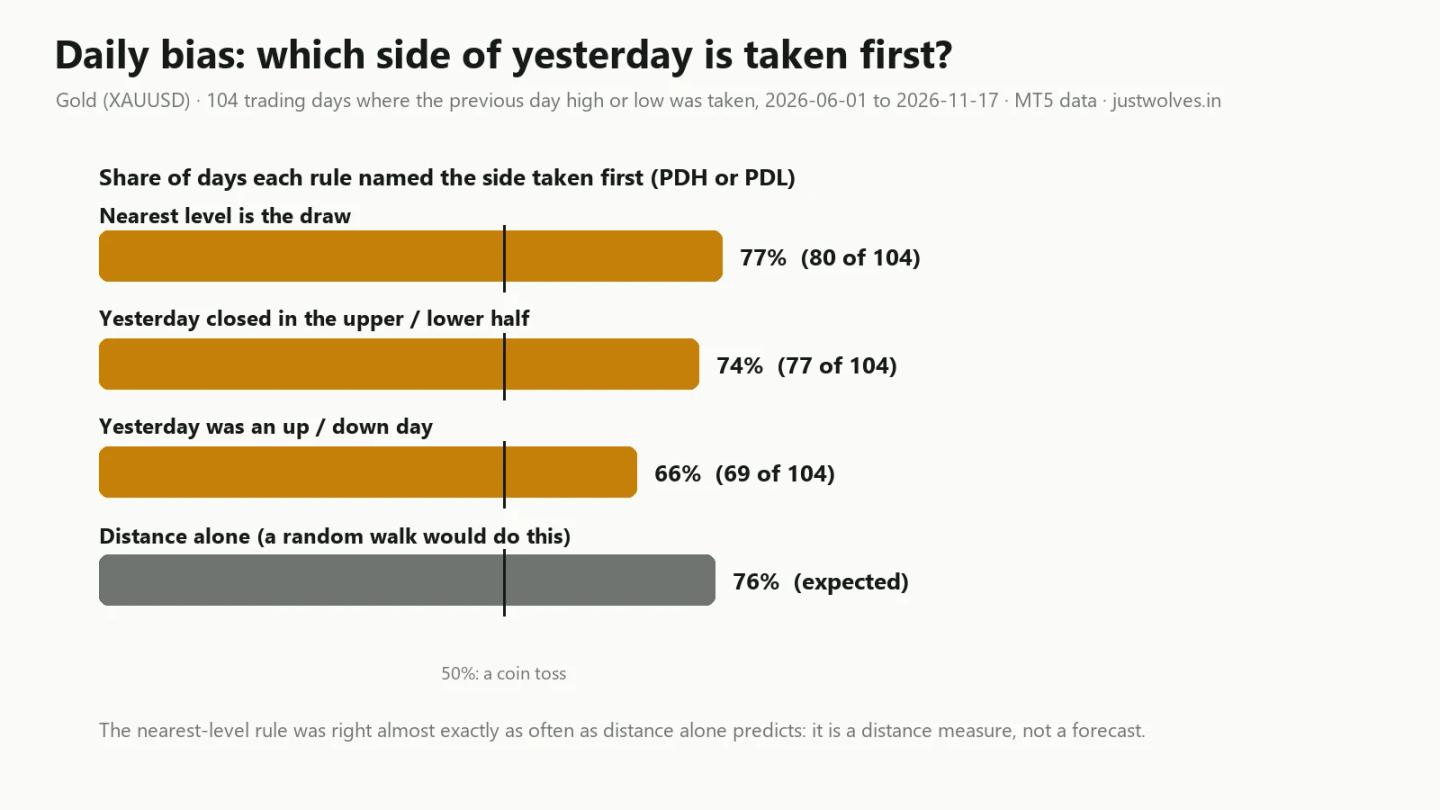
- In 104 gold trading days, the nearest-level bias named the first level taken 77% of the time, almost exactly what distance alone predicts (76%).
- Daily bias tells you what to watch first, not which way to trade; always write the condition that cancels it.
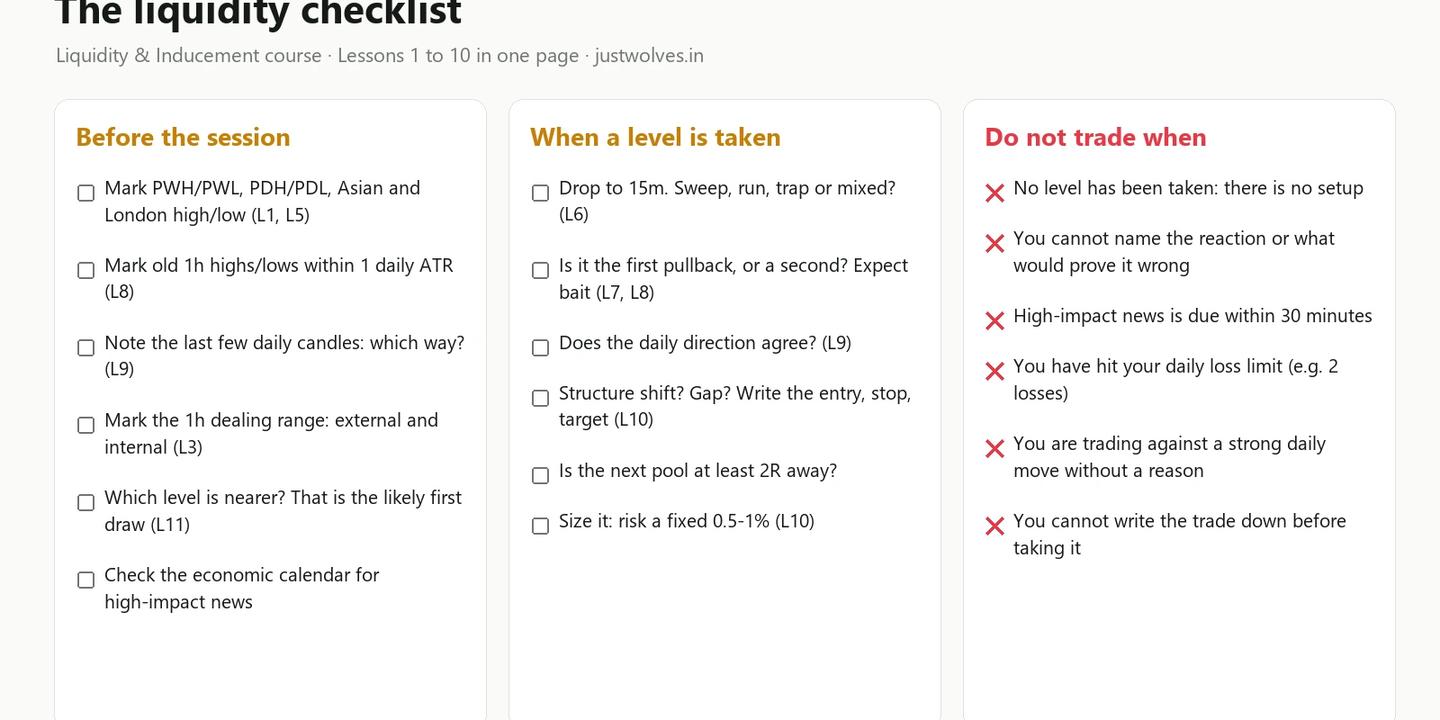
- The written checklist turns Lessons 1 to 11 into a routine: mark the levels, read the reaction, write the trade, size it small.
- Knowing when not to trade (no take, unclear reaction, news, loss limit) is part of the system.
In this article · 13 sections
Daily bias is the idea that, before the day starts, you can judge which way price is likely to go, usually by asking which pool of liquidity it is being drawn to. This final lesson of the course looks at how to find daily bias, tests three common daily bias rules on 104 real trading days of gold (XAUUSD) from MetaTrader 5 (MT5), June to November 2026, and finds something most courses do not mention: the best rule worked almost exactly as often as distance alone would predict. Then it turns everything from Lessons 1 to 11 into a one-page written checklist, including the times when the right decision is not to trade.
What you will learn
- What a market narrative is
- Daily bias as a draw on liquidity
- The test: three daily bias rules on 104 days
- Real chart: the bias was right, 12 June 2026
- Real chart: the bias was wrong, 10 November 2026
- What daily bias is good for, and what it is not
- The written rule system: the liquidity checklist
- When not to trade
- What this course found: the numbers in one place
1. What a market narrative is
Traders who use liquidity concepts often talk about the narrative: the story of where price has been, which pools of liquidity it has already taken, and which pool it is most likely to reach for next. It sounds vague, but it is simply the liquidity map from Lesson 1 told in time order:
- "Yesterday gold rallied and closed near its high. Last week's high is still above. The Asian session has been quiet. The nearest pool is yesterday's high, just above the open."
A narrative like that is useful because it tells you what to watch. It turns a screen full of candles into two or three prices that matter today. The danger is that a story feels like a forecast. The more convincing it sounds, the harder it is to drop when price disagrees.
This lesson treats the narrative as what it really is: a set of hypotheses that you write down before the session and then check against the market.
2. Daily bias as a draw on liquidity
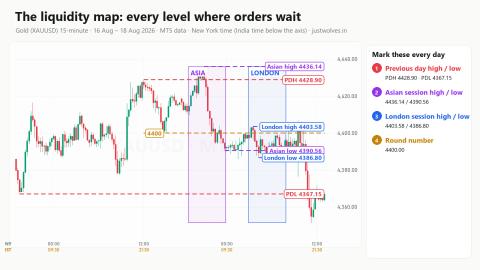
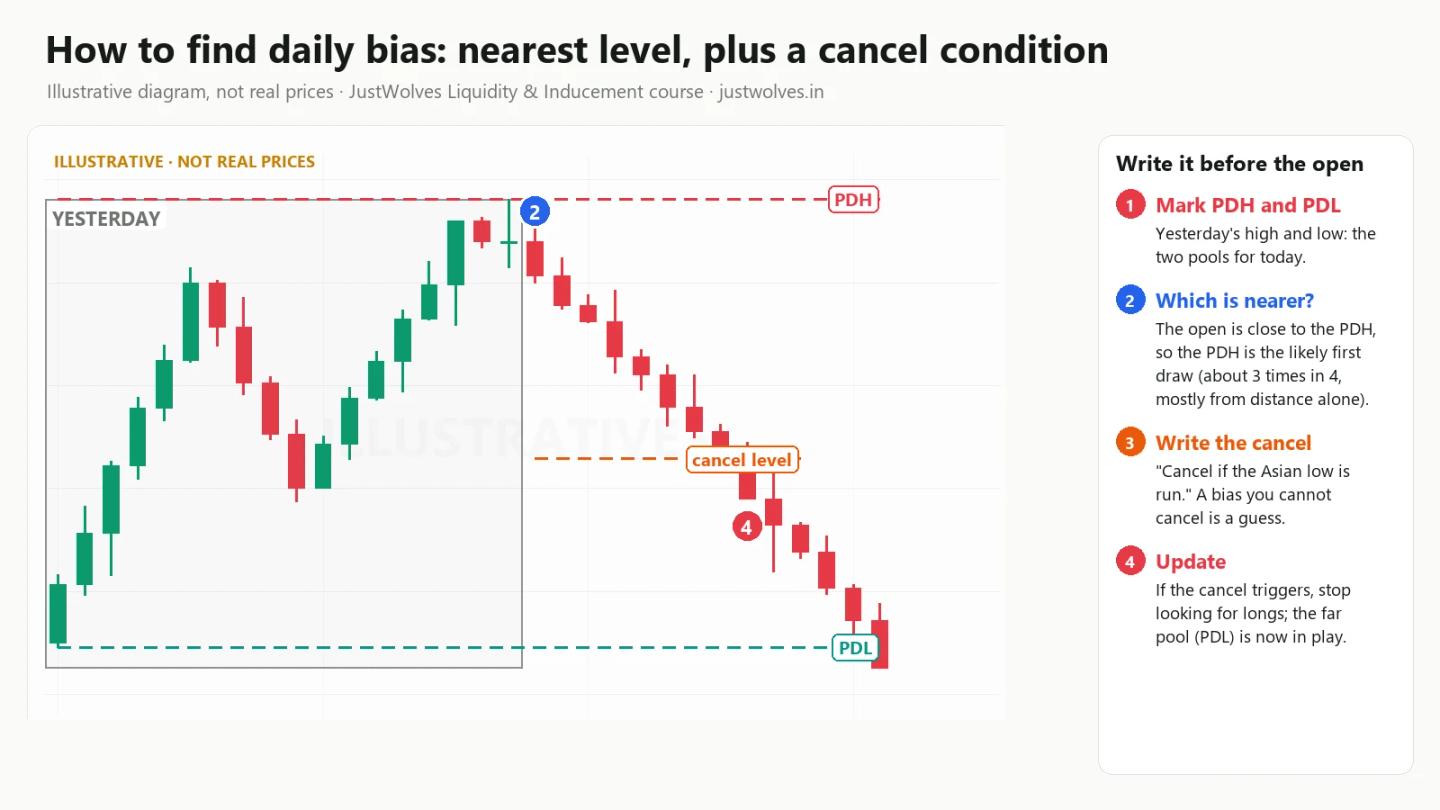
The most common form of narrative is a daily bias: a call, made before the day starts, on whether price is more likely to take the previous day high (PDH) or the previous day low (PDL). Traders who follow ICT-style methods call the target the draw on liquidity. Our daily and weekly bias lesson explains the ICT approach.
Bias rules come in many forms. We tested three simple, common ones. Each uses only what is known at the 17:00 New York open of the trading day:
| Rule | The bias is towards PDH when... | ...and towards PDL when |
|---|---|---|
| Nearest level | the open is closer to the PDH | the open is closer to the PDL |
| Close position | yesterday closed in the upper half of its range | yesterday closed in the lower half |
| Direction | yesterday closed above its open (an up day) | yesterday closed below its open (a down day) |
The question for each rule is simple: which of the two levels was traded through first during the day?
3. How to find daily bias: three rules tested on 104 days
From 1 June to 17 November 2026 there were 118 trading days on which gold opened inside the previous day's range. On 14 of them, neither the PDH nor the PDL was taken (an inside day). On the other 104, one of them was taken first: the PDL on 58 days and the PDH on 46. On 13 days both were taken before the day was over.
For each of the 104 days we checked which side each rule had named.
| Daily bias rule | Right | Share |
|---|---|---|
| Nearest level is the draw | 80 of 104 | 77% |
| Yesterday's close position (upper or lower half) | 77 of 104 | 74% |
| Yesterday's direction (up or down day) | 69 of 104 | 66% |
| Distance alone (what a random walk would do) | about 79 of 104 | 76% |
Gold (XAUUSD), MT5 data. Past results, not a trading signal.
At first glance, 77% looks like an excellent forecast. But look at the last row.
If price moved completely at random, it would still be more likely to reach the closer of two levels first. Mathematically, for a random walk starting between two levels, the chance of reaching the nearer one first is the far distance divided by the total distance. If the open is $10 below the PDH and $90 above the PDL, a random walk reaches the PDH first about 90% of the time. We applied that calculation to each of the 104 days, and it predicts the nearest level would be taken first on about 79 days, or 76%.
The nearest-level rule was right on 80. So it did almost exactly what distance alone would do. It is a correct and useful observation, but it is a measure of distance, not evidence that the market "wants" to go there.
The other two rules did worse. The close-position rule mostly agrees with the nearest-level rule (because the open is close to yesterday's close), so it scored similarly. On the 7 days the two disagreed, the nearest level was right 5 times. The direction rule did worst: on the 17 days it disagreed with the nearest level, the nearest level was right 14 times.
4. Real chart: the bias was right, Friday 12 June 2026
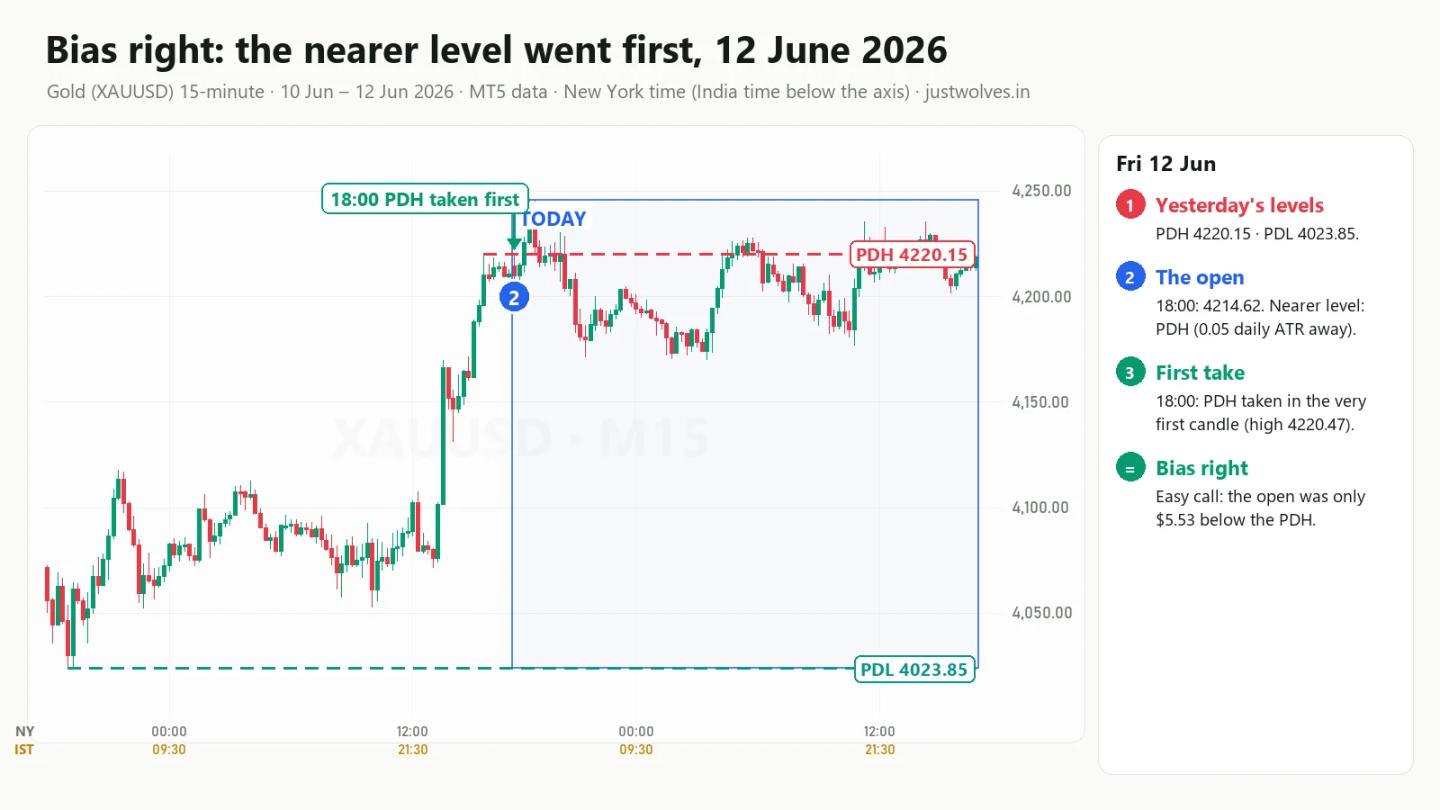
- The levels. The previous trading day (11 June) had a high of 4220.15, made at 15:30 New York time, and a low of 4023.85. It was a huge range: gold rallied almost $200 that day.
- The open. The new trading day opened at 18:00 New York time (03:30 India time) at 4214.62. That was 0.05 daily ATR below the PDH and 1.6 ATR above the PDL.
- The bias. All three rules pointed to the PDH: it was the nearer level, yesterday closed in the upper half of its range, and yesterday was an up day.
- What happened. The first 15-minute candle traded to 4220.47, 32 cents above the PDH. The bias was right within 15 minutes.
This is what most of the "right" calls look like. It is true, and it was useful to know that the PDH would probably be touched early. But it was not a difficult forecast, and it said nothing about what happened next: the day went on to close at 4218.89, just below the level it had taken.
5. Real chart: the bias was wrong, Tuesday 10 November 2026
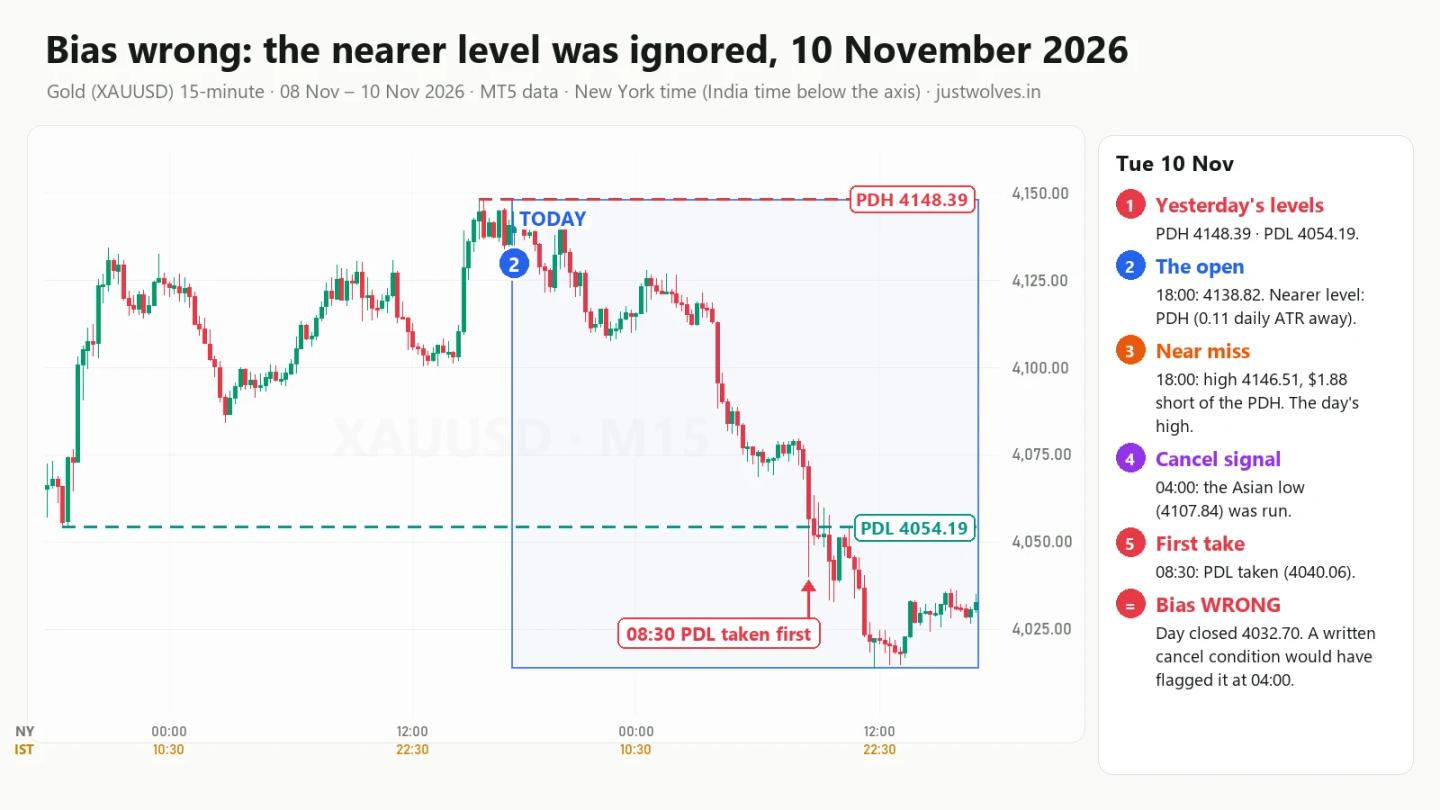
- The levels and the open. On 9 November gold rallied from 4065.26 to close at 4140.91, near its high of 4148.39. The new day opened at 4138.82: 0.11 daily ATR below the PDH and 0.98 ATR above the PDL of 4054.19.
- The bias. All three rules said PDH. The nearer level, an up day, a close near the top of the range: a textbook bullish narrative.
- What happened. The first 15-minute candle, at 18:00, reached 4146.51, just $1.88 short of the PDH. That was the highest price of the whole day. During the Asian session price drifted lower. At 04:00 the Asian low (4107.84) was taken with a run (Lesson 6), at 08:15 the London low (4068.68) was taken, and at 08:30 New York time (19:00 India time) a candle fell from 4073.24 to 4040.06, through the PDL. The day closed at 4032.70, about $116 below the PDH the bias had pointed to.
This day is a good example of how a narrative should be updated. The written plan at the open said "PDH is the draw". By 04:00 the plan had a clear warning: the PDH had not been taken despite being $9 away, and the Asian low on the other side had been taken with a run, which in Lesson 6 continued 81% of the time. A trader with a written rule like "if the opposite session level is run, the bias is cancelled" would have stopped looking for longs hours before the PDL went.
The wrong calls also had a pattern in time. Of the 24 days the nearest-level rule got wrong, 14 had their first take between 08:00 and 10:59 New York time, the hours when US economic data is released and the New York session opens (Lesson 5). Days that were going to break the "obvious" level often did not do it in the quiet hours; they did it when New York arrived.
6. What daily bias is good for, and what it is not
Putting the test and the two days together:
Daily bias is good for:
- Deciding what to watch first. The nearer level will usually be touched first. Plan your attention, and your alerts, around it.
- Setting expectations. If the nearer level is not taken in the quiet hours, be ready for the far one when New York opens.
- Giving you a hypothesis to check. A written bias can be proven wrong, and that is useful information.
Daily bias is not:
- A trade signal. Knowing the PDH will probably be touched says nothing about whether you should buy or sell there. Lesson 10 showed that across 429 takes, the day closed beyond the level exactly half the time.
- A reason to ignore the reaction. The reaction after the level is taken (Lesson 6) carries more information than the bias did.
- Something to defend. On 10 November, the traders who lost most were those who kept buying because "the draw is the PDH".
7. The written rule system: your trading checklist
Everything in this course fits on one page. Print it, or copy it into your trading plan.
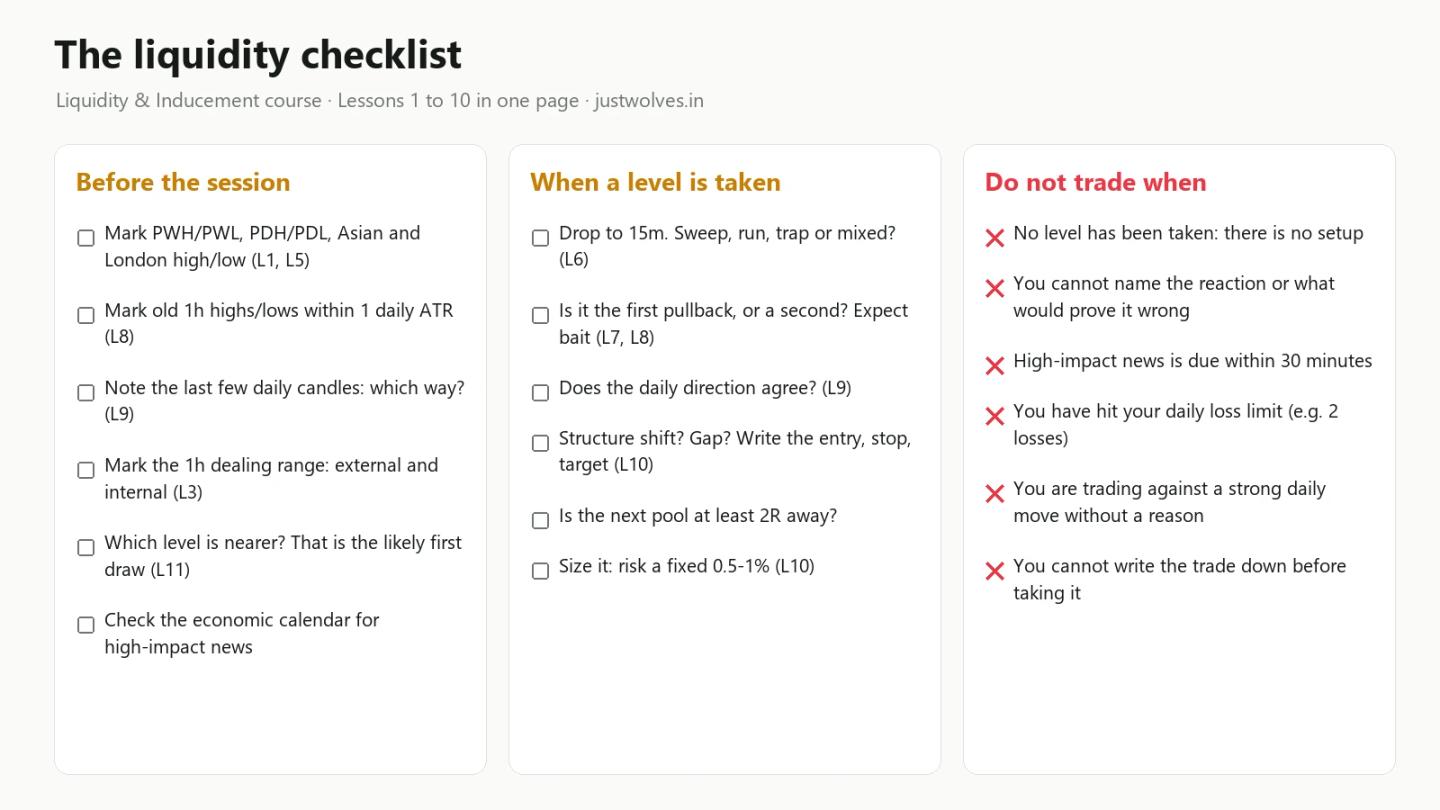
7.1 Before the session (10 minutes)
- Mark the levels. Previous week high and low, previous day high and low, Asian and London session highs and lows (Lesson 1, Lesson 5).
- Add old highs and lows on the 1-hour chart that are within about one daily ATR (Lesson 8).
- Read the daily candles. Which way have the last few days moved? (Lesson 10)
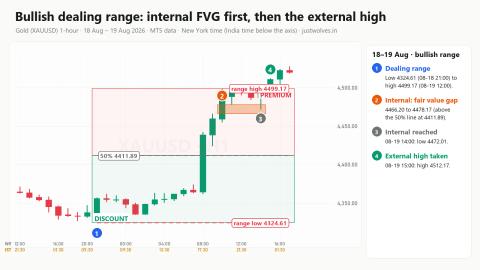
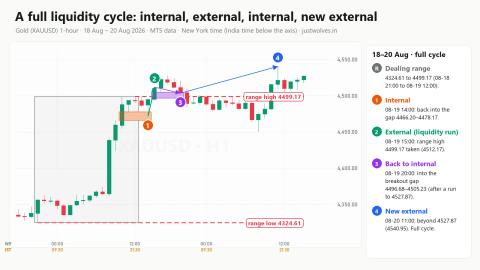
- Mark the 1-hour dealing range, its external liquidity and its internal gaps (Lesson 3).
- Write the bias in one line, with the condition that cancels it: "Nearer level: PDH, $9 away. Cancelled if the Asian low is run."
- Check the economic calendar for high-impact releases and note their times.
7.2 When a level is taken
- Classify the first hour on the 15-minute chart: sweep, run, trap or mixed (Lesson 6).
- Ask if it is bait. Is this the first pullback after a strong move, or the second? Both were usually taken in our tests (Lesson 7, Lesson 8).
- Check the higher timeframe. Does the daily direction agree with the trade? (Lesson 10)
- Write the trade before you take it: entry, stop beyond the sweep with a buffer, target at the next pool (Lesson 11).
- Check the distance to the next pool. If it is less than 2R away, skip the trade.
- Size it at a fixed 0.5–1% risk (Lesson 11, position sizing).
7.3 After the session (5 minutes)
- Record every take you watched, traded or not: the level, the reaction, what happened next.
- Mark whether your bias was right and whether the cancel condition triggered.
- Review weekly. After 50 recorded cases, compare your numbers with this course's numbers. Our trading journal lesson shows a simple format.
8. When not to trade
A rule system is as much about the trades you skip as the ones you take. These are the "do not trade" rules from the checklist, and why each one is there:
- No level has been taken. Without a take, there is no liquidity event to react to. Waiting is a position.
- The reaction is unclear to you. In Lesson 6, "mixed" first hours leaned towards continuation (66%), but they gave no clean signal for an entry or a stop. If you cannot name the reaction and say what would prove it wrong, you cannot trade it.
- High-impact news is due within 30 minutes. The 10 November PDL went at 08:30 New York time, a common release time for US economic data. Spreads widen and stops slip around releases.
- You have hit your daily loss limit. Decide in advance, for example two losing trades or 2% of the account in one day. Lesson 11's test had a run of 12 losses in a row; a daily limit stops a bad run becoming a disaster.
- You are trading against a strong daily move without a reason. Lesson 10's failure case (21 August) was a 15-minute sweep against a strong daily trend.
- You cannot write the trade down before taking it. If the entry, stop and target are not clear enough to write, they are not clear enough to trade.
9. What this course found: the numbers in one place
Every number in this course came from the same source: gold (XAUUSD) data from MT5, June to November 2026, with the rules written down before counting. This is what we found:
| Lesson | Question | What the data said |
|---|---|---|
| 4 | After a breakout, did the liquidity cycle complete? | Full cycle 35%, no return 32%, reversal 21%, return only 11% (71 cases) |
| 5 | When were the day's highs and lows made? | Most often 08:00–11:00 and 18:00–21:00 New York; kill zones no better than the clock |
| 6 | Does the first hour after a take matter? | Sweeps reversed 75%, traps 64%; runs continued 81% (429 takes) |
| 7 | Is the first pullback bait? | Taken before the target 76% of the time; the move still continued 59% after it (206 ranges) |
| 8 | Do old highs and lows get taken? | 64% within 5 days; 79% if under 0.5 daily ATR away, 38% if 1–2 ATR away (227 levels) |
| 9 | Did the liquidity block and inducement trap work? | 26 setups; waiting for a close back out of the block left 13 trades: 5 hit the target, 8 the stop |
| 10 | Does the 15-minute reaction match the daily close? | Runs: day closed beyond 61%. Sweeps: day closed inside 69% (429 takes) |
| 11 | Did a mechanical sweep entry make money? | Structure-shift model −0.34R per trade (43 trades); confirmed sweep about break-even (101 trades) |
| 12 | Does daily bias predict the first level taken? | Nearest level 77%, the same as distance alone (76%) (104 days) |
Read the table from top to bottom and the pattern is clear. Liquidity concepts describe real, measurable behaviour: stops near obvious levels get taken, the first pullback is usually bait, near levels attract price, and the first hour of the reaction carries information. But describing behaviour is not the same as having an edge. When we turned the ideas into fixed entry rules with costs, they did not make money in this period.
That is not a reason to give up on liquidity. It is a reason to use it the way this lesson suggests: as a map of where the crowd's orders sit, a framework for what to watch and where not to put your stop, and a set of hypotheses to test in your own journal, with small size, before you trust any of it with real money.
Common mistakes with daily bias and trading plans
- Treating a likely first touch as a trade direction. The nearer level being touched first tells you nothing about the trade.
- Having no cancel condition. A bias without a "this is wrong if..." rule turns into stubbornness, as on 10 November.
- Writing the plan after the session. A plan written afterwards always looks right.
- Using a checklist as a ritual. Each item should change what you do. If an item never changes a decision, remove it.
- Skipping the journal. Without your own numbers, you are trading on someone else's statistics, including ours.
Homework
For the next ten trading days, write a one-line bias before 18:00 New York time (03:30 or 04:30 India time, depending on the season), with a cancel condition. After each day, record which level was taken first and whether the cancel condition triggered. After ten days, compare your hit rate with the 77% nearest-level rate and the 76% distance baseline in section 3.
Interactive chart: gold 15-minute, 9–10 November 2026 (MT5 data)
Loading historical candles…
Practise on the live gold chart
● LiveFrequently Asked Questions
What is daily bias in trading?
A judgement, made before the day starts, about which way price is more likely to move, often expressed as which side of yesterday's range (the previous day high or low) it will reach first.
How do you find the daily bias?
Common methods use the nearest level, where yesterday closed in its range, or yesterday's direction. In our gold test the nearest level worked best (77%), but almost exactly as often as distance alone would predict (76%).
What is the draw on liquidity?
The pool of liquidity (for example the previous day high) that price is expected to reach for next. It is a useful way to decide what to watch, but not a trade signal.
What should a trading checklist include?
The levels to mark before the session, the questions to ask when a level is taken (reaction, bait, higher timeframe, written entry, stop, target and size), and clear rules for when not to trade.
When should I not trade?
When no level has been taken, when the reaction is unclear, close to high-impact news, after you hit your daily loss limit, and whenever you cannot write the trade down before taking it.
Test Your Knowledge
What is a market narrative?
Related lessons
Education only. Not investment advice or a recommendation to trade. JustWolves is not a SEBI-registered adviser. Charts and statistics use historical MT5 chart data for gold from June to November 2026; they describe past behaviour in one market and period and are not a forecast or a record of real trades. Trading forex and commodities involves substantial risk of loss.