Internal vs External Liquidity in Trading: The Dealing Range Explained
JustWolves is an educational platform and is not a SEBI-registered investment advisor. Trading financial instruments involves significant risk of loss and may not be suitable for all investors. Past performance is not indicative of future results. Read our full disclaimer →
What you'll learn
- A dealing range runs from the swing that started the current move to the swing that ended it.
- External liquidity sits beyond the range high and low; internal liquidity sits inside it, mainly in unfilled fair value gaps.
- The 50% line splits the range into premium and discount.
- In our examples, the internal gap nearest to price was the one reached first.
- Price can take internal liquidity first (9–10 June, 18–19 August), go straight for external liquidity (17–18 June), or reach internal liquidity and then fail (4–6 November).
In this article · 12 sections
Internal vs external liquidity is the split that divides every price move into two kinds of target. External liquidity sits beyond the high and low of the current range; internal liquidity sits inside it, mostly in the fair value gaps a fast move leaves behind. This lesson shows how to mark a dealing range on the 1-hour chart, how to split it into premium and discount, how to find the internal liquidity inside it, and walks through four real gold charts from MetaTrader 5 (MT5), including one where the map failed.
What you will learn
- What a dealing range is and how to mark one
- External liquidity: beyond the range
- Internal liquidity: fair value gaps and minor swings inside the range
- Premium, discount and the 50% line
- Real chart: a bearish dealing range, 9–10 June 2026
- Real chart: a bullish dealing range, 18–19 August 2026
- When external liquidity comes first, and when the map fails
- The liquidity map checklist, common mistakes, FAQ and quiz
1. What is a dealing range?
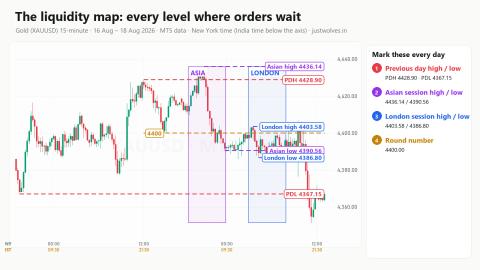
In Lesson 1 you mapped the places where orders wait: swing points, previous day and week highs and lows, session highs and lows and round numbers. In Lesson 2 you saw how textbook patterns add to those pools. This lesson adds structure to the map.
A dealing range is the price range of the current move, from the swing point where it started to the swing point where it ended. On a bearish move it runs from the swing high at the top to the swing low at the bottom; on a bullish move, from the swing low to the swing high.
How we mark it in this course:
- Use the 1-hour chart.
- Find a clear move of at least three times the average hourly range (ATR), so small wiggles are ignored.
- Mark the swing point where the move started and the swing point where it ended. Both must be confirmed swings (two candles on each side that do not go beyond them).
- Draw a box from the start to the end. That box is the dealing range.
Everything above the box and below the box is external. Everything inside it is internal.
2. External liquidity: beyond the range
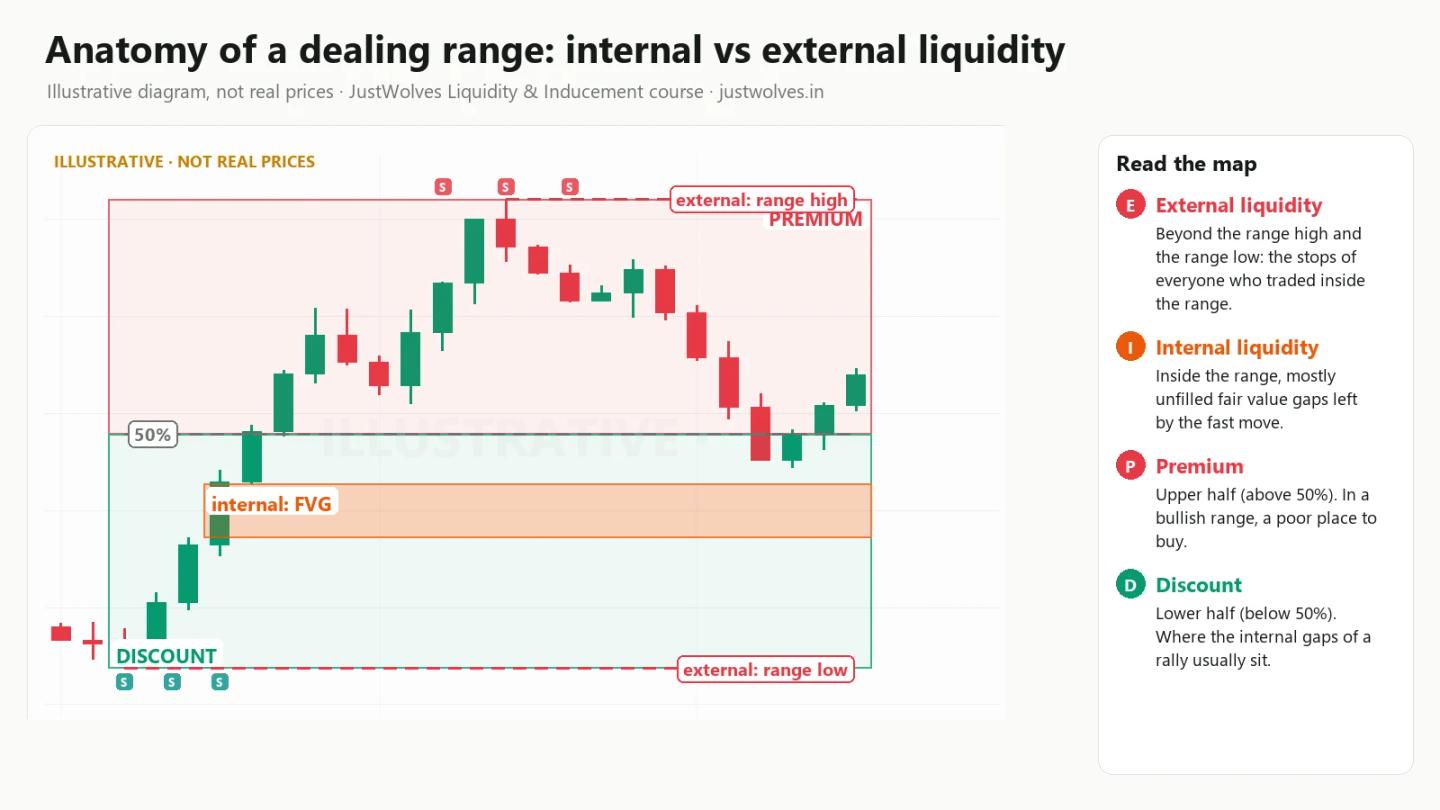
External liquidity sits beyond the dealing range's high and low. It is the same buy-side and sell-side liquidity you learned in Lesson 1, seen from the range's point of view:
- Above the range high: buy stops of traders who sold the move, and breakout buyers. This is external buy-side liquidity.
- Below the range low: sell stops of traders who bought the move, and breakout sellers. This is external sell-side liquidity.
External liquidity often lines up with the levels from Lesson 1. A range high can also be the previous day high; a range low can also be the Asian session low. When two levels line up, the pool of orders beyond them is usually bigger.
3. Internal liquidity: what sits inside the range
Internal liquidity sits inside the dealing range. There are two main kinds:
- Fair value gaps (FVGs). When price moves fast, it can leave a gap: three candles where the first candle's high and the third candle's low (or the reverse, in a falling move) do not overlap. Price often comes back to trade inside these gaps. In this course an FVG counts as internal liquidity only if it is still unfilled when the range is complete. See our fair value gap lesson for the full rules.
- Minor swing highs and lows, and equal highs and lows inside the range. Small pools of stops left by traders who joined the move late.
A useful way to think about it: external liquidity is where the move is going; internal liquidity is where it may pause on the way. Price often reaches into internal liquidity first, then heads for the external level, or the other way round. Lesson 4 is dedicated to that cycle.
4. Premium, discount and the 50% line
Draw a line halfway between the range high and the range low. This is the equilibrium, or 50% line.
- The half above the 50% line is premium: prices are expensive relative to the range.
- The half below it is discount: prices are cheap relative to the range.
The usual guideline is to look for buys in discount when the range is bullish, and sells in premium when it is bearish, because that keeps your entry closer to the start of the move. Treat it as a guide, not a law. In one of the four real examples below, the internal liquidity price actually reached sat in the "wrong" half of the range. For more on this idea, read premium and discount.
| Part of the range | What it is | What usually sits there |
|---|---|---|
| Above the range high | External | Buy stops, breakout buyers (buy-side liquidity) |
| Premium (top half) | Internal | Fair value gaps and minor highs from the move |
| 50% line | Equilibrium | The reference that splits premium and discount |
| Discount (bottom half) | Internal | Fair value gaps and minor lows from the move |
| Below the range low | External | Sell stops, breakout sellers (sell-side liquidity) |
5. Real chart: a bearish dealing range, 9–10 June 2026
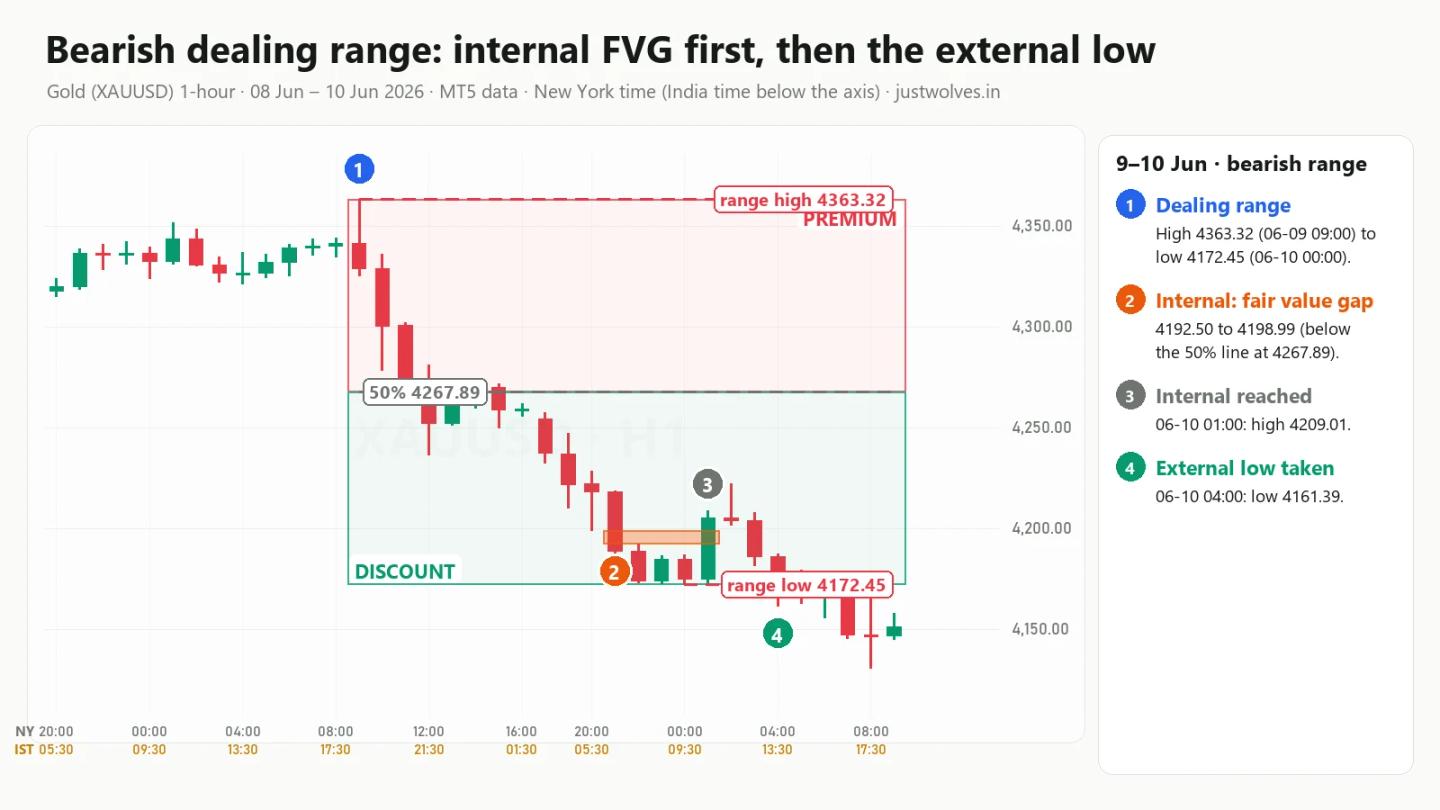
You have seen the top of this range before. In Lesson 1, section 4.3, gold took the previous day high on 9 June at 09:45 New York time and then fell. That hour's high, 4363.32, became the top of a bearish dealing range.
- The range. From the high of 4363.32 (the 09:00 hourly candle) gold fell to a swing low of 4172.45 at 00:00 on 10 June: a range of $190.87. The 50% line sat at 4267.89.
- External liquidity. Buy stops above 4363.32, and sell stops below 4172.45.
- Internal liquidity. The fall left four unfilled bearish fair value gaps inside the range. The nearest one to the low ran from 4192.50 to 4198.99.
- What happened. At 01:00 a candle bounced to 4209.01, trading through that nearest gap. Three hours later, at 04:00, gold fell to 4161.39, about $11 below the range low. The internal liquidity was reached first; the external sell-side liquidity came next.
Interactive chart: gold 1-hour, 9–10 June 2026 (MT5 data)
Loading historical candles…
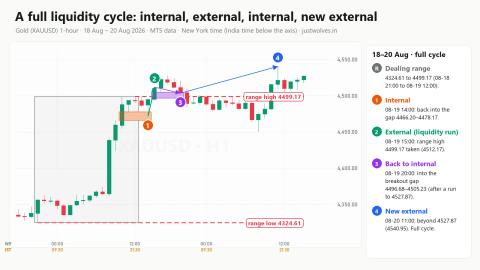
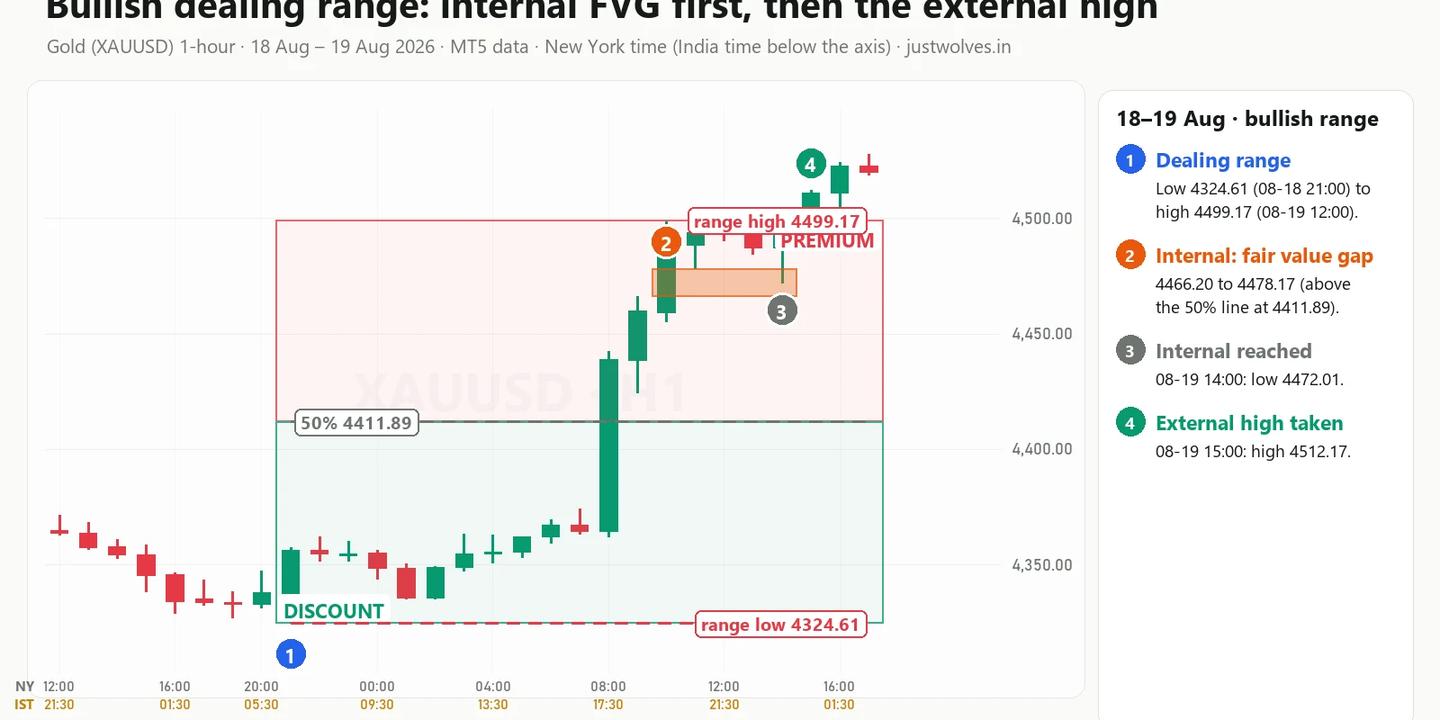
6. Real chart: a bullish dealing range, 18–19 August 2026
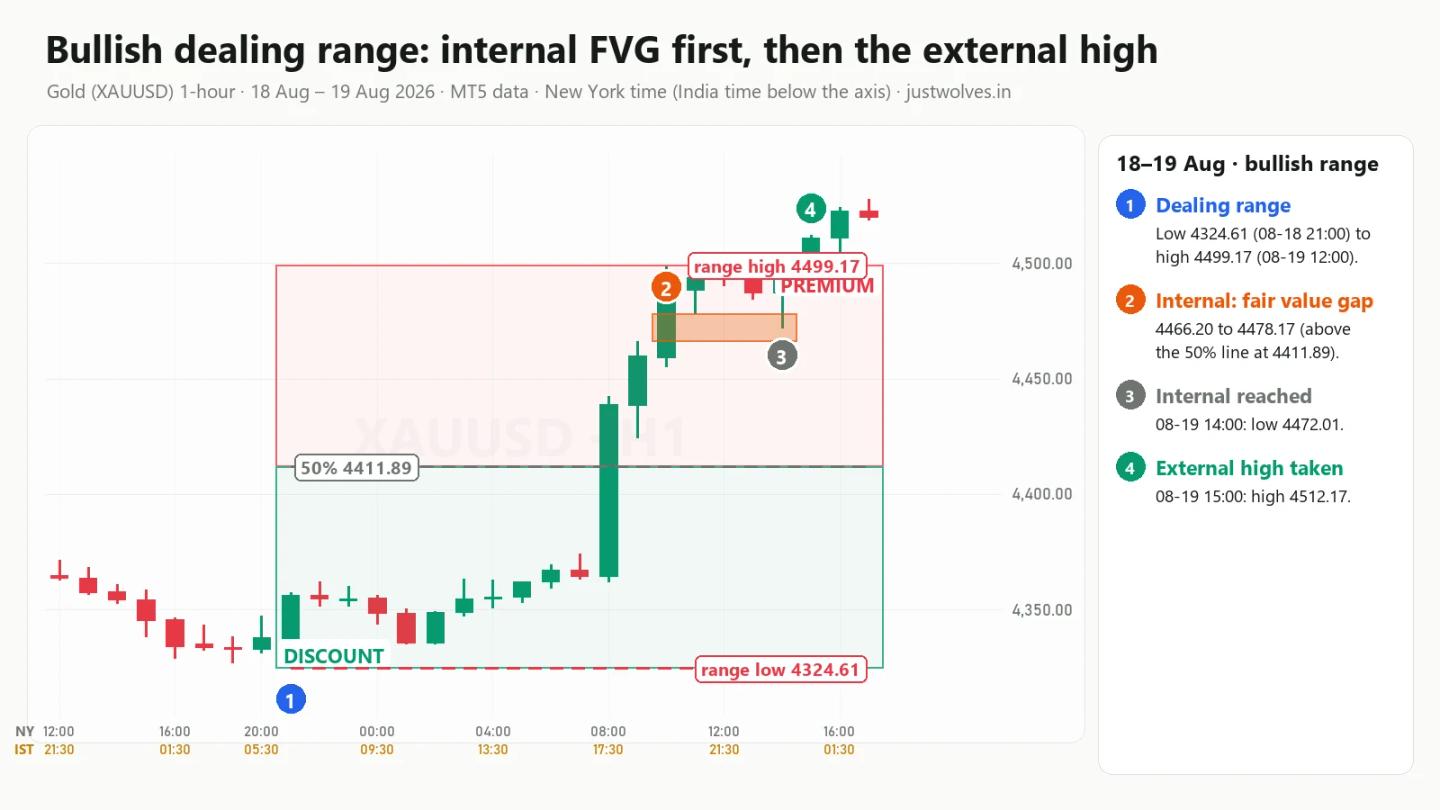
This range began the evening after Lesson 1's main example. After the fall on 18 August, gold made a swing low and turned higher.
- The range. From a swing low of 4324.61 at 21:00 on 18 August to a swing high of 4499.17 at 12:00 on 19 August: a range of $174.56. The 50% line sat at 4411.89.
- Internal liquidity. The rally left four unfilled bullish fair value gaps, including one large gap of about $50 between 4374.09 and 4424.33.
- What happened. At 14:00 price pulled back to 4472.01, into the nearest gap (4466.20 to 4478.17). At 15:00 it traded up to 4512.17, $13 above the range high, taking the external buy-side liquidity.
Notice two things. First, price reached the gap nearest to it, not the biggest one; the large $50 gap further down stayed untouched until 30 August, eleven days later. Second, that nearest gap sat in the premium half of the range, above the 50% line. The pullback was shallow because the move was strong.
Interactive chart: gold 1-hour, 18–19 August 2026 (MT5 data)
Loading historical candles…
7. When external liquidity comes first, and when the map fails
7.1 External first: 17–18 June 2026
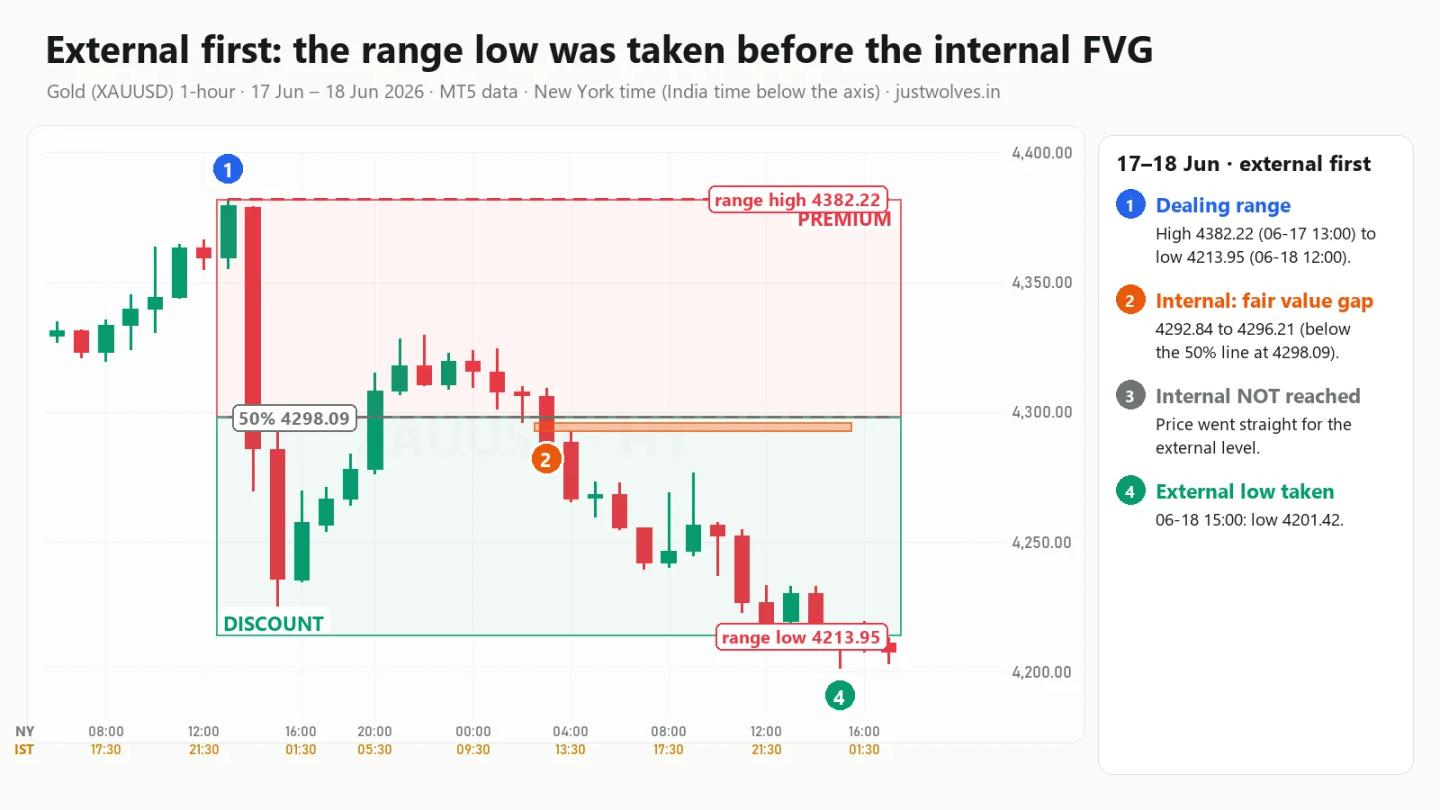
Price does not always visit internal liquidity first.
- The range. From a swing high of 4382.22 at 13:00 on 17 June to a swing low of 4213.95 at 12:00 on 18 June: $168.27, with the 50% line at 4298.09.
- Internal liquidity. Two unfilled bearish gaps, one near the 50% line (4292.84 to 4296.21) and one lower down (4233.27 to 4237.19).
- What happened. After the range was complete, gold never rose above 4233.15, 12 cents short of the lower gap. At 15:00 it fell to 4201.42, about $12.53 below the range low.
When a move is strong, price can head straight for external liquidity and leave the internal gaps for later. So keep both targets on your map.
7.2 When the map fails: 4–6 November 2026
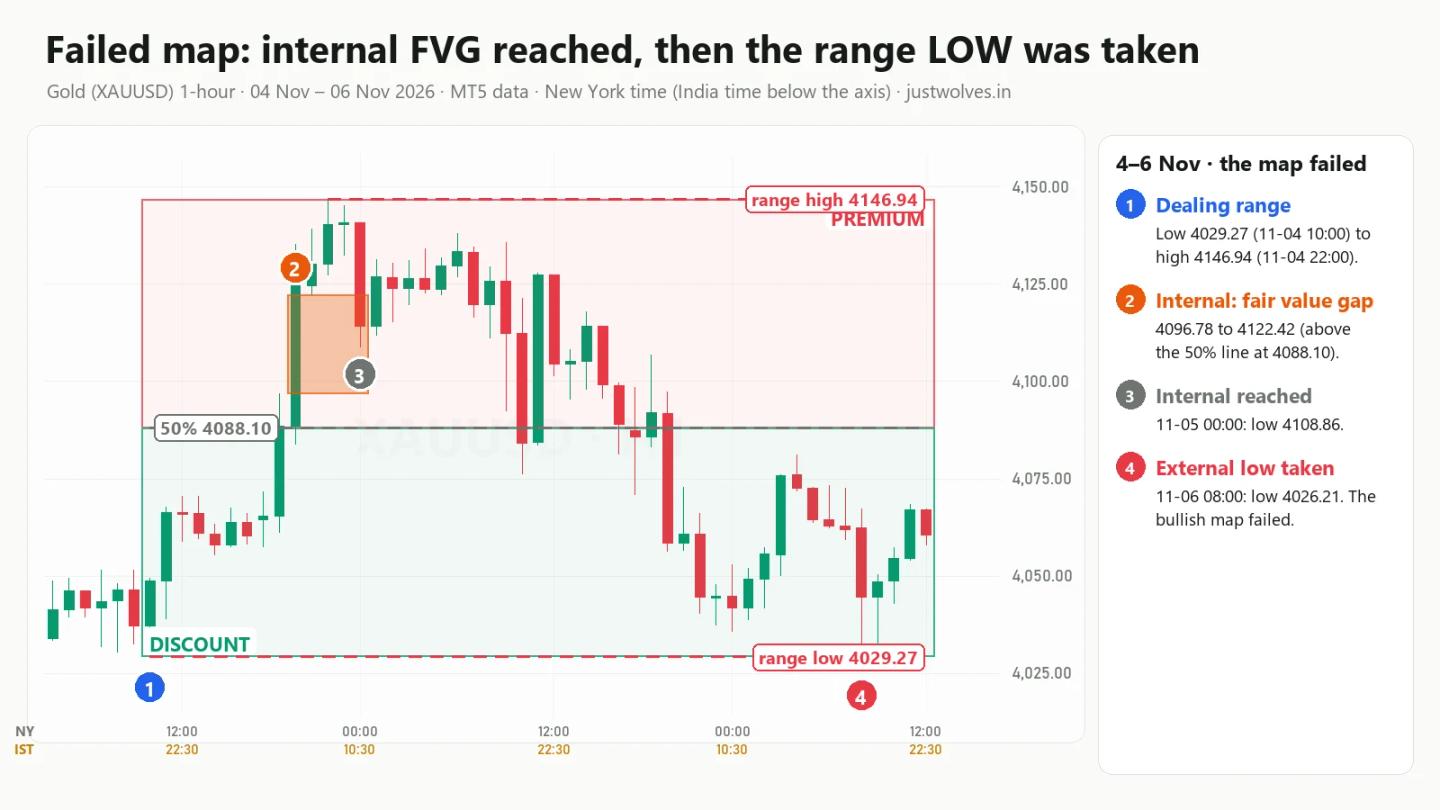
- The range. A bullish move from 4029.27 at 10:00 on 4 November to 4146.94 at 22:00: $117.67, with the 50% line at 4088.10.
- Internal liquidity. Two unfilled bullish gaps: 4096.78 to 4122.42, and a deeper one at 4071.57 to 4084.01.
- What a bullish map expects. A pullback into a gap, then a run to the external high above 4146.94.
- What happened. Price reached the nearest gap at 00:00 on 5 November (low 4108.86) and the deeper one later that morning. But it never took the range high (the closest it came was 4145.23, $1.71 short). Instead it kept falling, and at 08:00 on 6 November it traded to 4026.21, $3.06 below the range low.
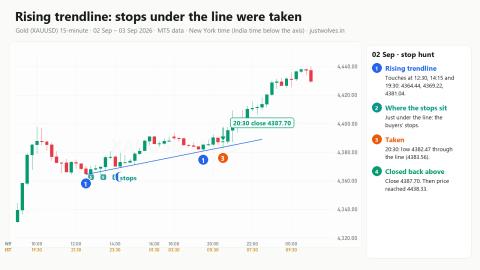
If you followed Lesson 2, you have seen part of this decline: the 5 November falling trendline that was swept at 19:15 before gold dropped more than $68. A bullish dealing range had turned into a series of lower highs.
What to learn from it: reaching internal liquidity is not proof that the external target in the same direction will follow. Watch what price does after it reaches the gap. A strong reaction away from the gap supports the map; repeated lower highs, as here, warn that the other side of the range may be the real target.
The liquidity map checklist
- Mark the dealing range on the 1-hour chart: confirmed swing at the start, confirmed swing at the end, a move of at least three times the hourly ATR.
- Draw the 50% line and label premium and discount.
- Mark external liquidity beyond the range high and low, and note any Lesson 1 levels that line up with them.
- Mark internal liquidity: every unfilled fair value gap, plus minor swings and equal highs or lows inside the range.
- Note which internal gap is nearest to price. In our examples, that is the one price reached first.
- Watch the reaction at internal liquidity before expecting the external target.
Common mistakes with external and internal liquidity
- Choosing the dealing range by eye. Use confirmed swing points and a minimum size, or every chart becomes a different range.
- Counting filled gaps as internal liquidity. A gap that has already been traded through is no longer a target.
- Expecting the biggest gap to be reached first. On 19 August the nearest gap was reached and the $50 gap was left alone.
- Treating premium and discount as rules. On 19 August the reached gap sat in premium in a bullish range.
- Ignoring the failed version. On 4–6 November the internal gap was reached and the opposite external level was taken.
Homework
Open a 1-hour gold chart and find the most recent move of at least three times the hourly ATR. Mark the dealing range, the 50% line, every unfilled fair value gap and both external levels. Then note which gap is nearest to price, and over the next session record whether price reaches it first or goes straight for an external level.
Practise on the live gold chart
● LiveFrequently Asked Questions
How is internal liquidity different from external liquidity?
External liquidity sits beyond the high and low of the current dealing range. Internal liquidity sits inside the range, mainly in fair value gaps and minor swing points that the move left behind.
What is a dealing range?
The range of the current move, from the confirmed swing point where it started to the confirmed swing point where it ended. In this course we mark it on the 1-hour chart.
Is a fair value gap internal liquidity?
An unfilled fair value gap inside the dealing range is the main form of internal liquidity. Once price has traded through it, it is no longer a target.
Does price always go to internal liquidity before external liquidity?
No. On 17–18 June 2026 gold took the external low without returning to either internal gap.
Should I only buy in discount and sell in premium?
It is a useful guide, not a rule. On 19 August 2026, in a bullish range, the gap price reached before taking the external high sat in the premium half.
Test Your Knowledge
Where does external liquidity sit?
Related lessons
Education only. Not investment advice or a recommendation to trade. JustWolves is not a SEBI-registered adviser. Charts use historical MT5 chart data picked to explain a concept; they are not a record of real trades. Trading forex and commodities involves substantial risk of loss.