The Liquidity Cycle: Liquidity Runs, Returns and Reversals
JustWolves is an educational platform and is not a SEBI-registered investment advisor. Trading financial instruments involves significant risk of loss and may not be suitable for all investors. Past performance is not indicative of future results. Read our full disclaimer →
What you'll learn
- The liquidity cycle has four stages: internal, external, back to internal, then the next external level or a reversal.
- A breakout usually leaves new fair value gaps, and those gaps are the most common stage 3 targets.
- On 18–20 August and 9–10 June 2026 the full cycle completed, each time returning to a gap left by the breakout candle.
- In 71 real cases, the full cycle happened 35% of the time, no return 32%, reversal 21% and return only 11%.
- Stage 3 is a decision point: watch the reaction before assuming continuation.
In this article · 12 sections
The liquidity cycle describes how price moves between the two kinds of target you met in Lesson 3: it reaches into internal liquidity, makes a liquidity run out to external liquidity, comes back for the internal liquidity its own move left behind, and then either takes the next external level or turns around. This lesson walks through the four stages on real 1-hour gold charts from MetaTrader 5 (MT5), shows what happened in 71 real cases from June to November 2026, and includes the two ways the cycle breaks.
What you will learn
- The four stages of the liquidity cycle
- Why a breakout leaves new internal liquidity behind
- Real chart: a full bullish cycle, 18–20 August 2026
- Real chart: a full bearish cycle, 9–10 June 2026
- What happened in 71 real cases
- When the cycle breaks: a reversal, 31 August – 3 September 2026
- When there is no return: 9–12 November 2026
- How to use the cycle, common mistakes, FAQ and quiz
1. The four stages of the liquidity cycle
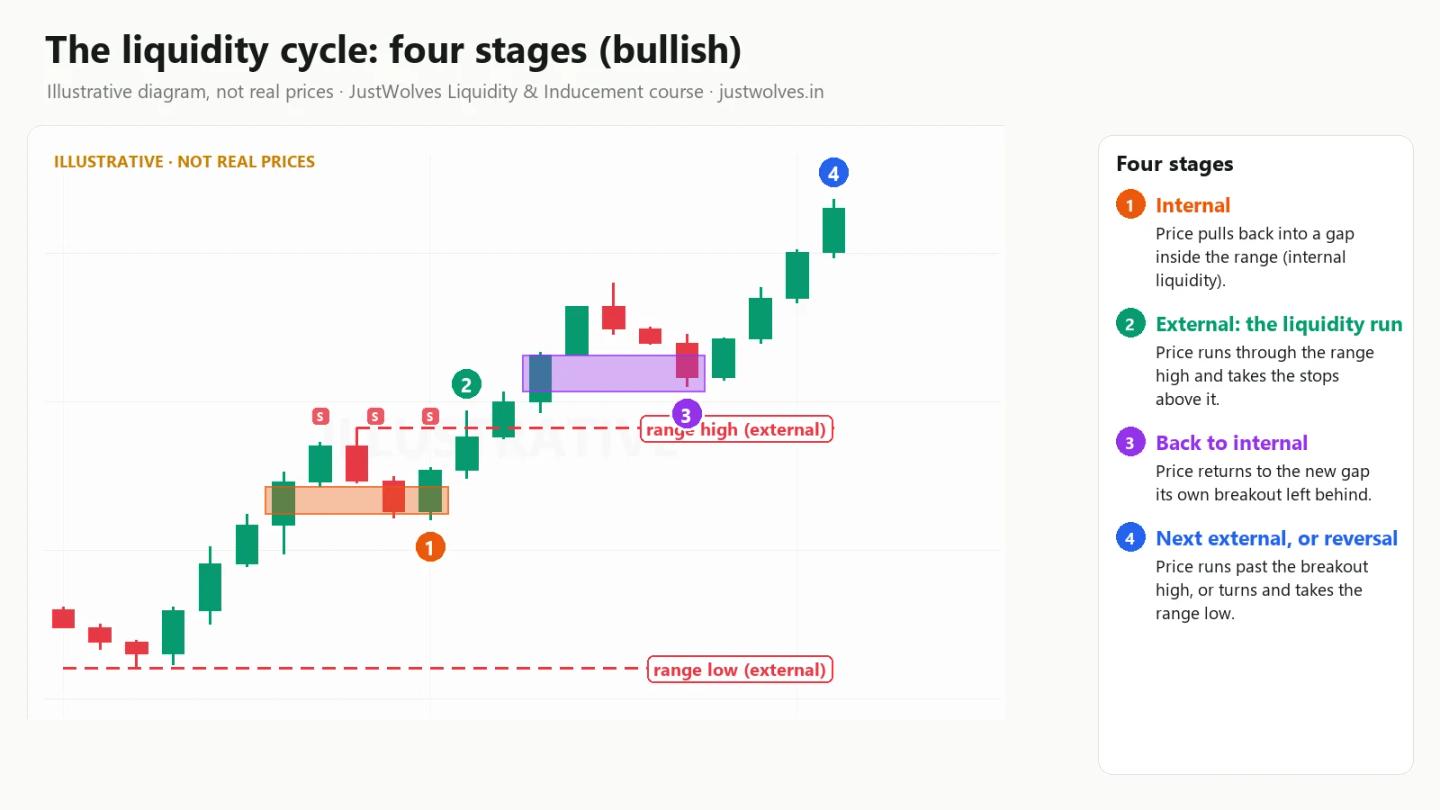
In Lesson 3 you marked a dealing range on the 1-hour chart, with external liquidity beyond its high and low and internal liquidity inside it, mostly in unfilled fair value gaps. The liquidity cycle is the order in which price tends to visit those targets:
- Internal. Price pulls back into internal liquidity: an unfilled fair value gap inside the range. This is the retracement.
- External. Price runs beyond the range high or low and takes the external liquidity there. This is the expansion.
- Back to internal. The run out of the range is usually fast, so it leaves new fair value gaps behind. Price comes back into one of them: a second retracement.
- Next external, or reversal. From there, price either goes beyond the extreme it reached in stage 2, taking the next pool of external liquidity, or it turns and takes the external level on the other side of the range.
Stages 1 and 2 are what you saw in Lesson 3. Stages 3 and 4 are what makes it a cycle: each expansion creates the internal liquidity for the next retracement.
| Stage | Price is moving | Target | Typical behaviour |
|---|---|---|---|
| 1. Internal | Against the move | Nearest unfilled gap inside the range | A pullback, often shallow |
| 2. External | With the move | Beyond the range high or low | A fast run that leaves new gaps |
| 3. Back to internal | Against the move | A gap left by the stage 2 run | A second, usually smaller pullback |
| 4. Next external or reversal | With or against the move | The next external level, or the opposite side of the range | Continuation, or a change of direction |
2. Why a breakout leaves new internal liquidity behind
When price takes external liquidity, many stop orders fill at once, and the move out of the range is often a single strong candle or a short burst of them. Fast candles leave fair value gaps: price jumped through a zone without trading much inside it.
Those new gaps become the internal liquidity of the next leg. So stage 3 often returns to the area just beyond the old range edge: the gap was created by the very candles that broke out. You will see it in both full-cycle examples below, where the stage 3 gap was made by the breakout candle itself.
3. Real chart: a full bullish cycle, 18–20 August 2026
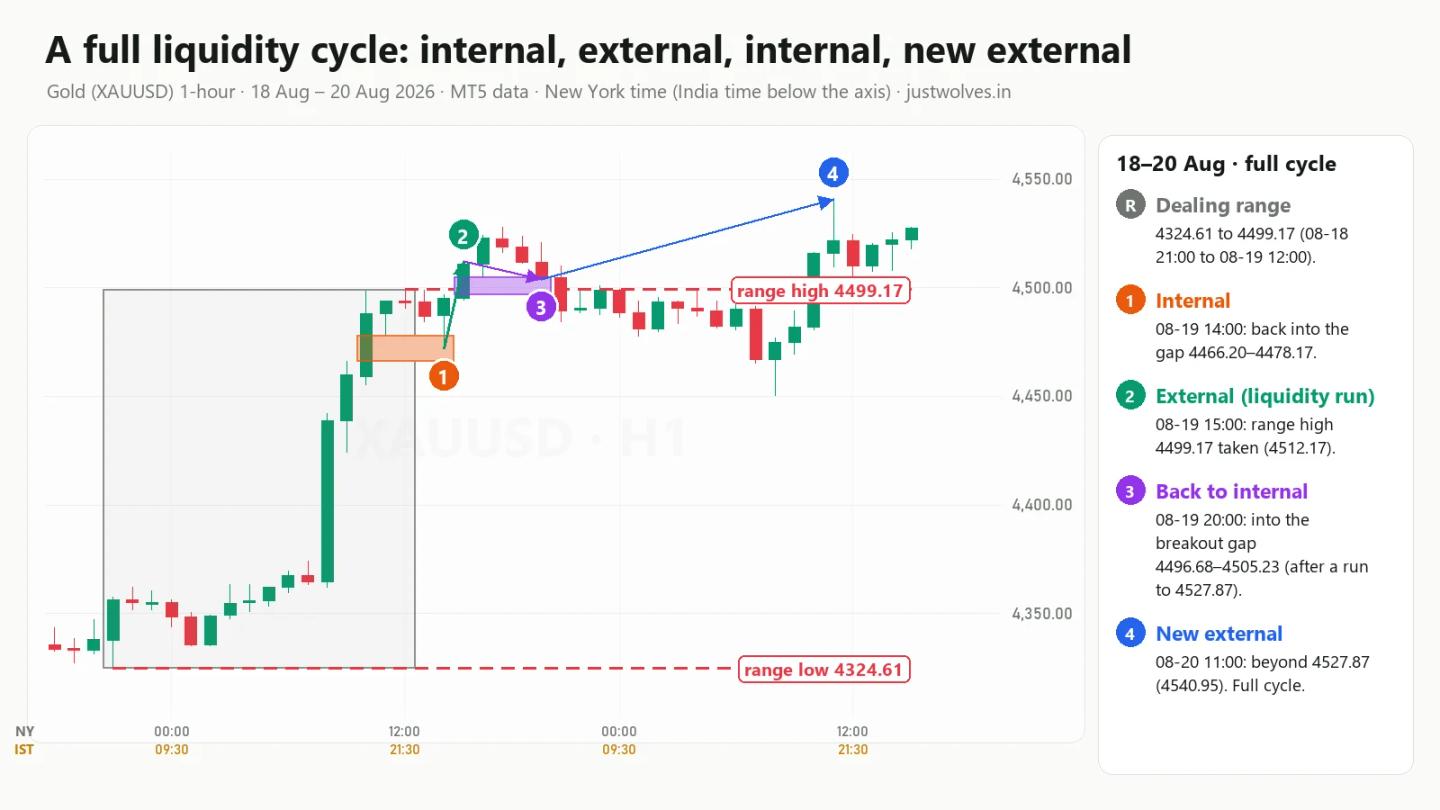
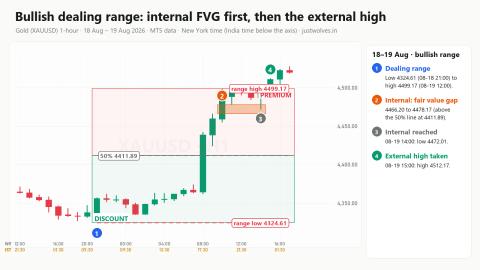
This continues the bullish dealing range from Lesson 3: a range from 4324.61 (21:00 on 18 August) to 4499.17 (12:00 on 19 August).
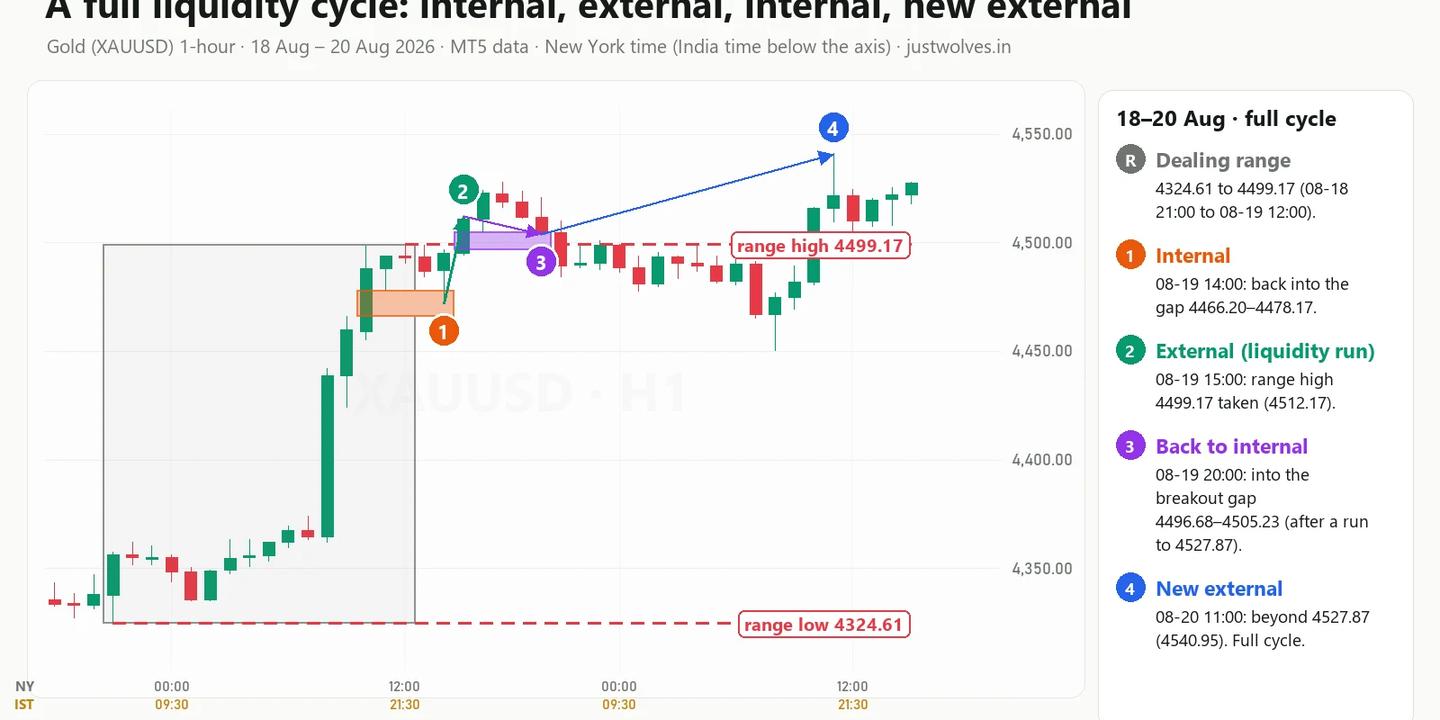
- Internal (14:00, 19 August). Price pulled back to 4472.01, into the nearest unfilled gap inside the range, 4466.20 to 4478.17.
- External (15:00). A candle traded up to 4512.17, above the range high, taking the external buy-side liquidity. The run continued to 4527.87 by 18:00.
- Back to internal (20:00). The 15:00 breakout candle had left a new gap from 4496.68 to 4505.23. At 20:00 price came back into it, with a low of 4503.91.
- Next external (11:00, 20 August). Price traded to 4540.95, above the 4527.87 high from stage 2. The cycle continued.
Interactive chart: gold 1-hour, 18–20 August 2026 (MT5 data)
Loading historical candles…
4. Real chart: a full bearish cycle, 9–10 June 2026
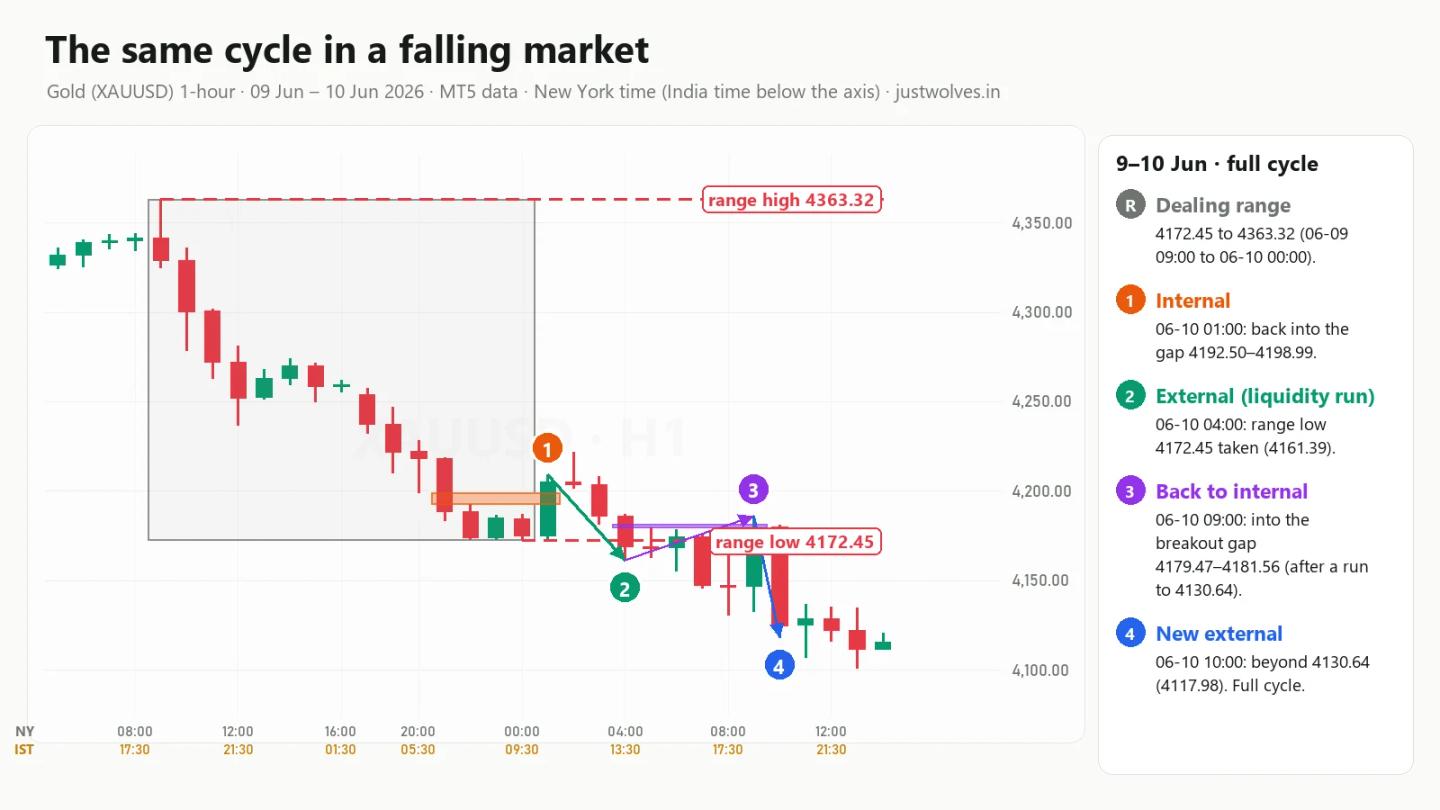
The mirror image, continuing Lesson 3's bearish range from 4363.32 down to 4172.45.
- Internal (01:00, 10 June). Price bounced to 4209.01, through the nearest unfilled gap, 4192.50 to 4198.99.
- External (04:00). A candle fell to 4161.39, below the range low, taking the external sell-side liquidity. The fall reached 4130.64 by 08:00.
- Back to internal (09:00). The 04:00 breakdown candle had left a small gap from 4179.47 to 4181.56. At 09:00 price swung back up to 4186.22, through that gap.
- Next external (10:00). One hour later price fell to 4117.98, below the 4130.64 low from stage 2.
Notice how quickly this cycle ran: from the first internal touch to the new low took nine hours.
5. What happened in 71 real cases
One or two examples can be picked to look good, so we measured the cycle on every qualifying 1-hour dealing range in gold from 2 June to 17 November 2026. We started from each case where price reached internal liquidity and then took the external level in the direction of the move (stages 1 and 2), counted each external break only once, and followed the next 48 hours.
| What happened after the external level was taken | Cases | Share |
|---|---|---|
| Full cycle: back to internal liquidity, then beyond the stage 2 extreme | 25 | 35% |
| No return: never came back to the internal gaps that were open at the break | 23 | 32% |
| Reversal: back to internal liquidity, then took the range's opposite external level | 15 | 21% |
| Return only: back to internal liquidity, then neither within 48 hours | 8 | 11% |
| Total | 71 | 100% |
Gold (XAUUSD) 1-hour, MT5 data, rules as in Lessons 3 and 4. A description of past behaviour in one market and period, not a forecast or a trading edge.
Read the table like this:
- The full cycle was the most common outcome, but it happened in only about one case in three.
- Price came back to internal liquidity in 48 of 71 cases (25 + 15 + 8), about two in three. The return itself is common; what happens after it is not decided.
- In about one case in five, the return to internal liquidity was the start of a reversal. Stage 3 is a decision point, not a guarantee.
6. When the cycle breaks: a reversal, 31 August – 3 September 2026
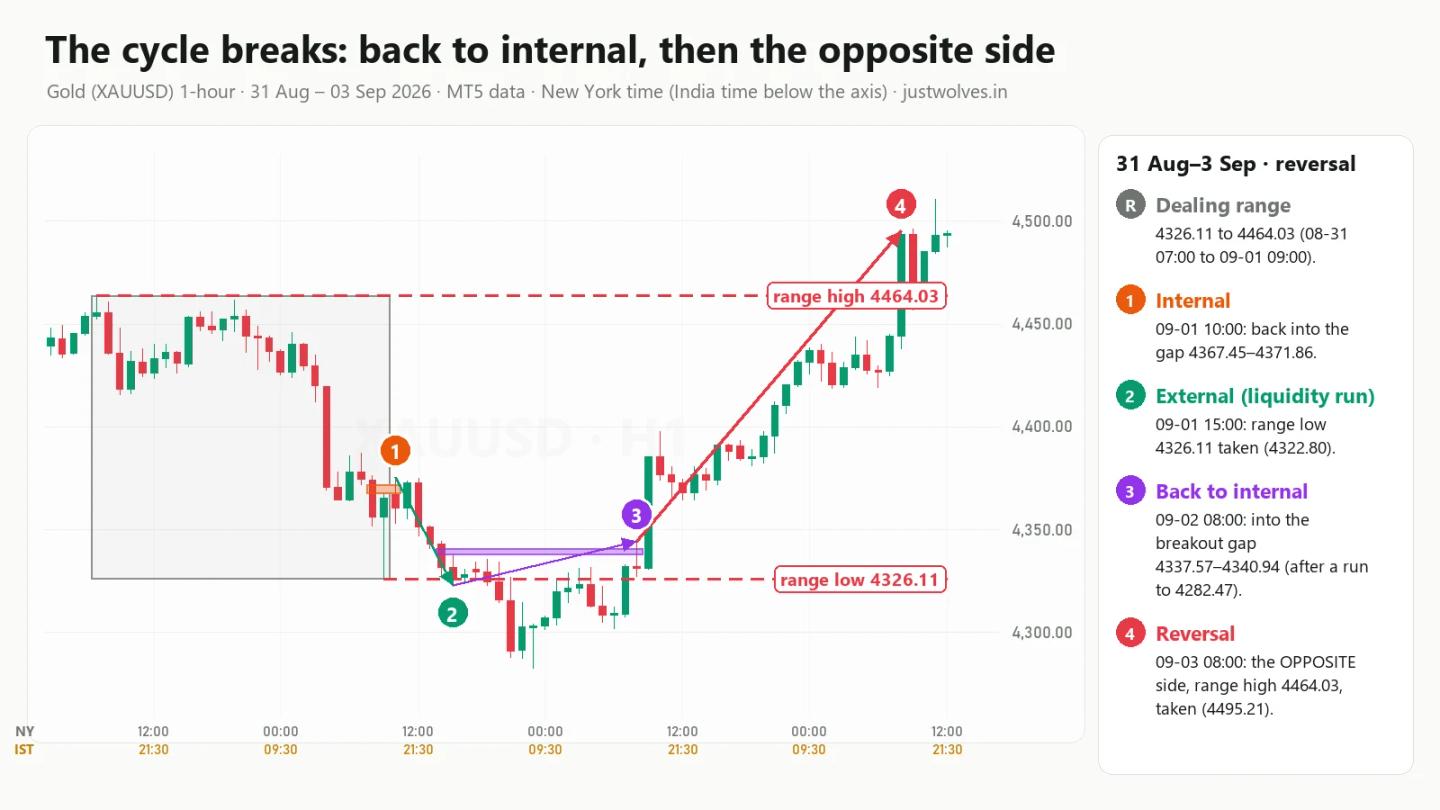
- The range. A bearish dealing range from 4464.03 (07:00 on 31 August) down to 4326.11 (09:00 on 1 September).
- Stage 1. At 10:00 on 1 September price bounced to 4375.57, through the internal gap at 4367.45 to 4371.86.
- Stage 2. At 15:00 it fell to 4322.80, taking the external low, and the fall reached 4282.47 by 23:00.
- Stage 3. The 14:00 candle had left a gap at 4337.57 to 4340.94. At 08:00 on 2 September price rose to 4344.46, back into it.
- Stage 4, reversed. Instead of falling below 4282.47, gold kept rising. At 08:00 on 3 September it traded to 4495.21, above the range high of 4464.03. The opposite external level was taken.
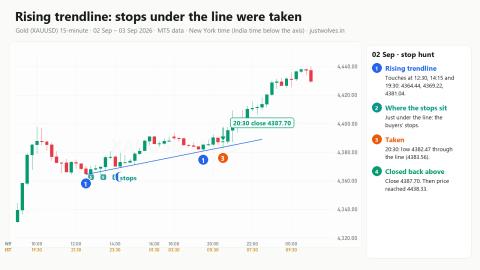
If you followed Lesson 2, you have seen part of this climb: the rising trendline on 2 September that was swept at 20:30 before gold rose almost $55.
What to learn from it: stage 3 is where continuation and reversal look the same. In a bearish cycle that continues, the bounce into the new gap should fail and price should make a new low soon after. Here it did not: price kept rising for a full day. Lesson 6 covers how to read that reaction, and a market structure shift is one of the signs that a reversal has begun.
Interactive chart: gold 1-hour, 31 August – 3 September 2026 (MT5 data)
Loading historical candles…
7. A liquidity run with no return: 9–12 November 2026
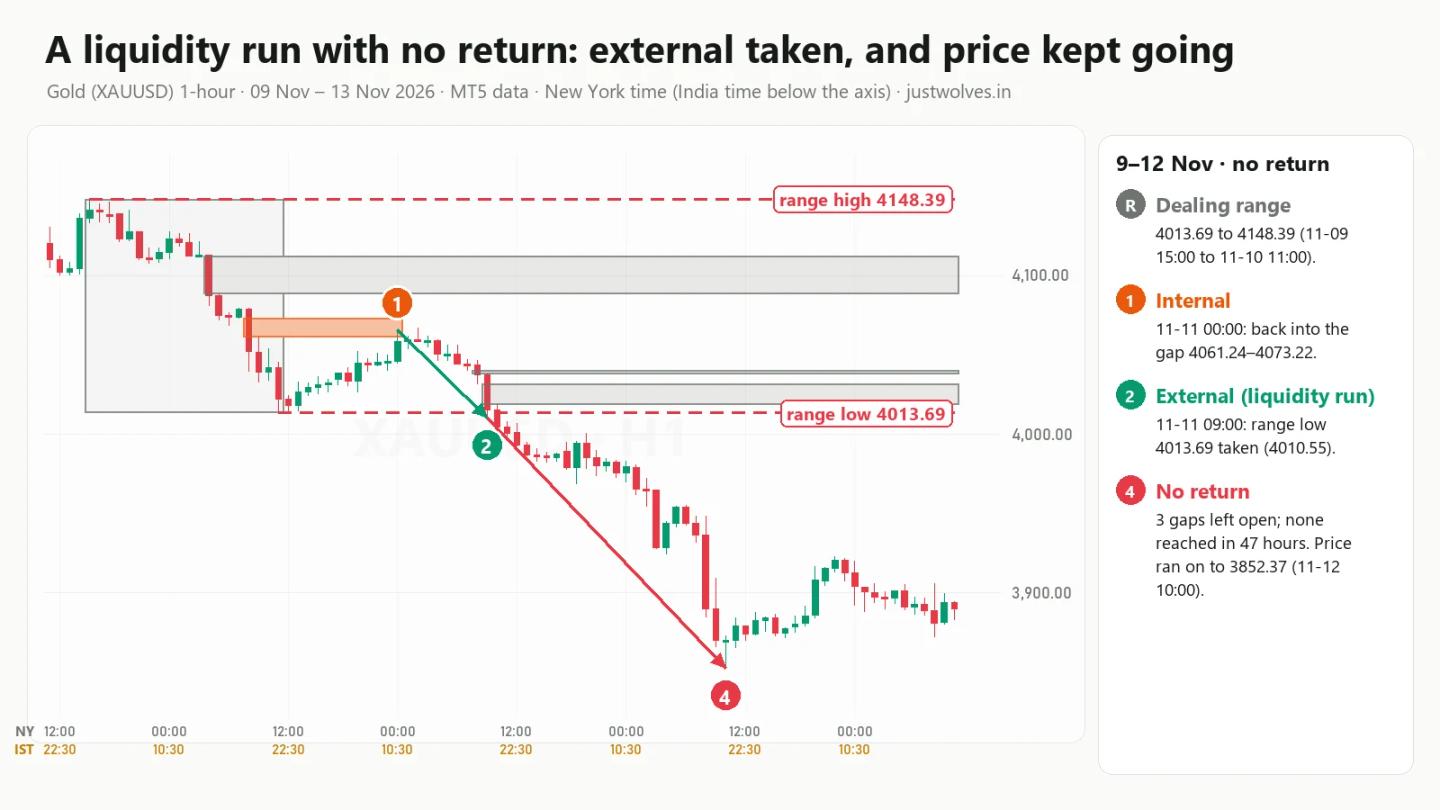
- The range. A bearish dealing range from 4148.39 (15:00 on 9 November) to 4013.69 (11:00 on 10 November).
- Stage 1. At 00:00 on 11 November price bounced to 4066.06, into the internal gap at 4061.24 to 4073.22.
- Stage 2. At 09:00 it fell to 4010.55, below the range low.
- No stage 3. At that moment three internal gaps were still open: 4088.53 to 4112.20, 4038.00 to 4040.37 and 4018.61 to 4032.05. In the next 47 hours price did not come back to any of them. Instead it fell to 3852.37 by 10:00 on 12 November, more than $160 below the range low.
Price did make small bounces along the way, and six newer gaps formed after the break were reached during the fall. But the internal liquidity that existed when the external level broke was left behind. In a strong move, waiting for stage 3 can mean missing the move completely, which is why no-return was the second most common outcome in the 71 cases.
8. How to use the liquidity cycle
- Mark the dealing range and its internal liquidity on the 1-hour chart (Lesson 3).
- Identify the stage. Has price reached internal liquidity yet? Has it taken the external level?
- After an external break, mark the new gaps the breakout created. The nearest one is the likely stage 3 target.
- At stage 3, watch the reaction. A quick rejection from the gap and a new extreme supports the full cycle. A move that keeps going through the gap and beyond, as on 2–3 September, warns of a reversal.
- Plan for all four outcomes. Full cycle, no return, reversal and return-only all happened in the 71 cases. Your plan needs an answer for each.
- Size every trade for being wrong. See our stop loss lesson.
Common mistakes with the liquidity cycle
- Treating the cycle as a law. In the 71 cases the full cycle happened about one time in three.
- Waiting for stage 3 in every move. In about one case in three there was no return to the internal gaps open at the break.
- Forgetting the new gaps. Stage 3 usually returns to a gap created by the breakout itself, not to an old gap deep inside the range.
- Assuming stage 3 means continuation. In 15 of the 71 cases the return to internal liquidity became a reversal.
- Counting the same move twice. When you review your own charts, count each external break once, as we did here.
Homework
On a 1-hour gold chart, find the last time price took an external level of a dealing range. Mark the new gaps the breakout created, then label what happened next with the four outcomes from this lesson: full cycle, no return, reversal or return only. Do this for five past breaks and compare your tally with the table in section 5.
Practise on the live gold chart
● LiveFrequently Asked Questions
What is the liquidity cycle?
It is the order in which price tends to move between targets: into internal liquidity, out to external liquidity, back into the internal liquidity its own move created, and then on to the next external level or into a reversal.
Why does price come back after taking external liquidity?
The run out of the range is often fast and leaves fair value gaps behind. Price frequently returns to those gaps. In our 71 gold cases it came back to internal liquidity about two times in three.
Does the cycle always continue after the return?
No. In the 71 cases, 25 continued to a new extreme, 15 reversed and took the other side of the range, and 8 did neither within 48 hours.
What should I do if price never comes back?
Accept that some moves leave without a second chance. That happened in 23 of the 71 cases. Waiting for a return that never comes is better than chasing a move with no plan.
Which timeframe should I use?
This lesson uses the 1-hour chart for the dealing range, the same as Lesson 3. Lesson 10 shows how to combine it with lower timeframes.
Test Your Knowledge
What is stage 3 of the liquidity cycle?
Related lessons
Education only. Not investment advice or a recommendation to trade. JustWolves is not a SEBI-registered adviser. Charts use historical MT5 chart data picked to explain a concept; they are not a record of real trades. The 71-case table describes past behaviour in one market and period and is not a forecast. Trading forex and commodities involves substantial risk of loss.